Share :
Selecting an Appropriate Inference Procedure

In AP Statistics, selecting an appropriate inference procedure is essential for analyzing data and drawing valid conclusions about a population based on a sample. Understanding how to choose the correct method, whether it’s a confidence interval or a hypothesis test, depends on the type of data, the number of samples, and the objective of the analysis. By mastering this skill, students can accurately estimate parameters or test hypotheses, ensuring that their statistical conclusions are both reliable and meaningful. This foundational ability is key to success on the AP Statistics exam and in any real-world application of statistics.
Learning Objectives
In studying “Selecting an Appropriate Inference Procedure,” you will be guided through identifying the correct statistical method for various data types and research contexts. Emphasis will be placed on recognizing when to apply confidence intervals or hypothesis tests, ensuring that the conditions for each procedure are met. You will be equipped to determine the most suitable inference method based on sample characteristics and study objectives, enabling you to make accurate and valid conclusions in statistical analyses.
Types of Inference Procedures
Inference procedures generally fall into two categories: confidence intervals and hypothesis tests. These can be applied to different types of data depending on the study design and the nature of the variables involved.
Confidence Intervals
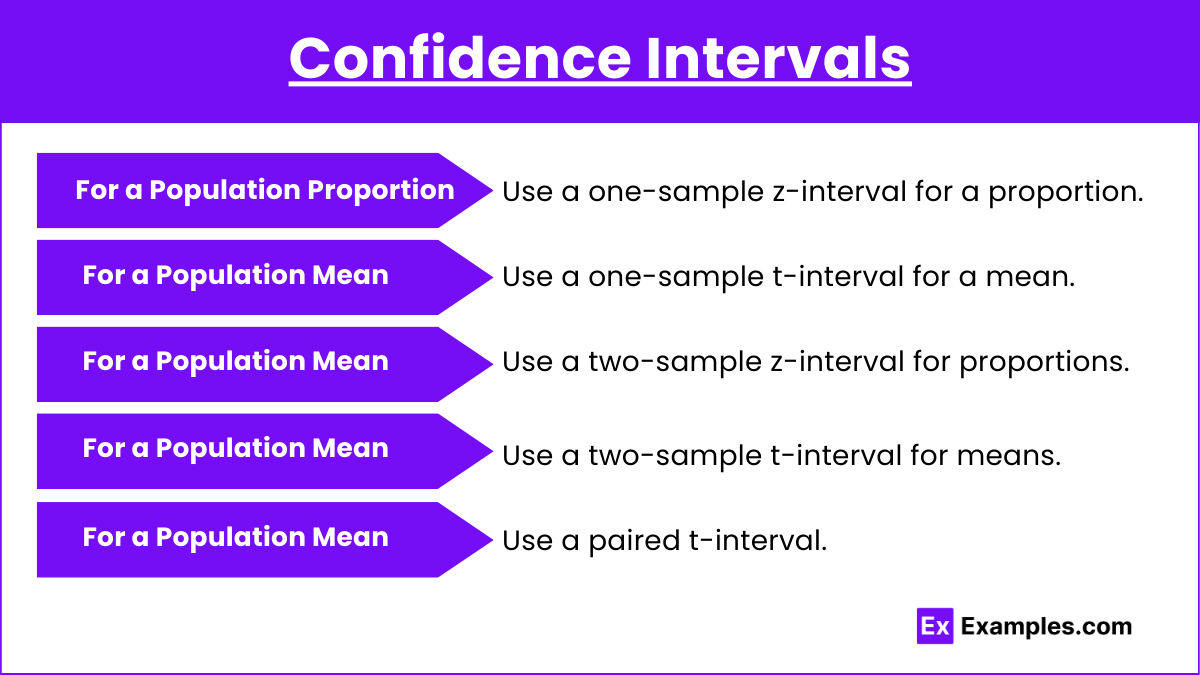
A confidence interval provides a range of plausible values for a population parameter (e.g., population mean or proportion). The procedure chosen depends on the type of data and sample size.
- For a Population Proportion: Use a one-sample z-interval for a proportion.
- For a Population Mean: Use a one-sample t-interval for a mean.
- For Difference in Proportions: Use a two-sample z-interval for proportions.
- For Difference in Means: Use a two-sample t-interval for means.
- For Paired Data: Use a paired t-interval.
Hypothesis Tests
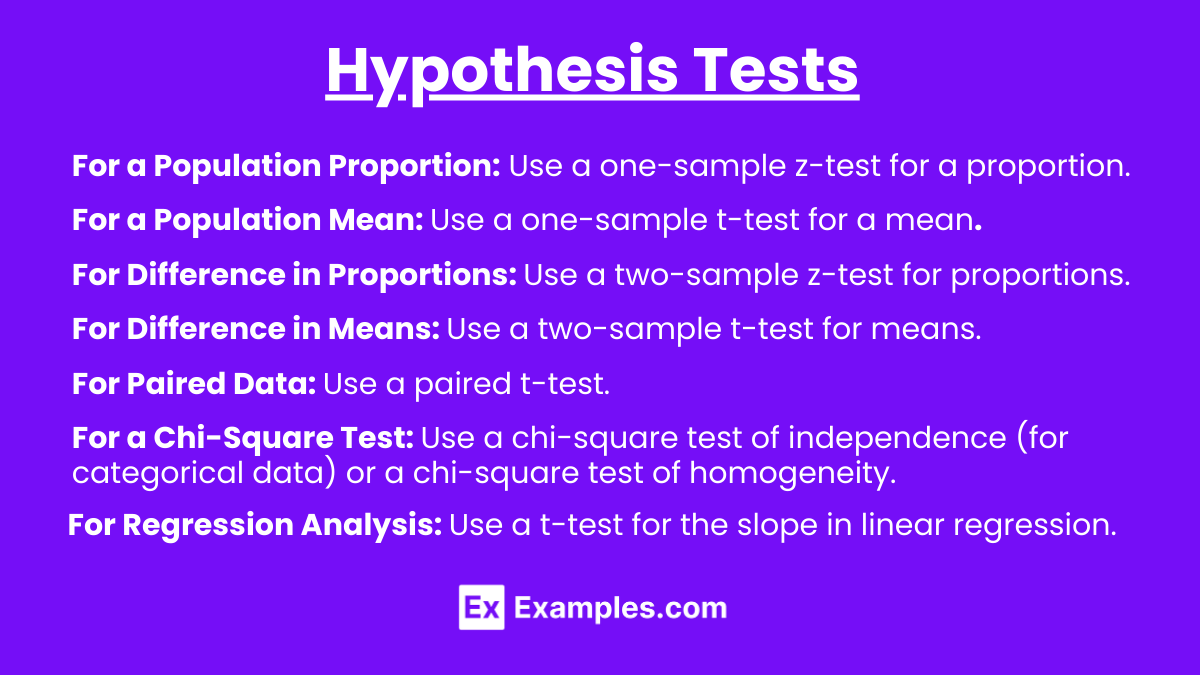
Hypothesis tests assess evidence against a null hypothesis. The correct test depends on the nature of the data and the hypothesis.
- For a Population Proportion: Use a one-sample z-test for a proportion.
- For a Population Mean: Use a one-sample t-test for a mean.
- For Difference in Proportions: Use a two-sample z-test for proportions.
- For Difference in Means: Use a two-sample t-test for means.
- For Paired Data: Use a paired t-test.
- For a Chi-Square Test: Use a chi-square test of independence (for categorical data) or a chi-square test of homogeneity.
- For Regression Analysis: Use a t-test for the slope in linear regression.
Steps to Select the Appropriate Inference Procedure
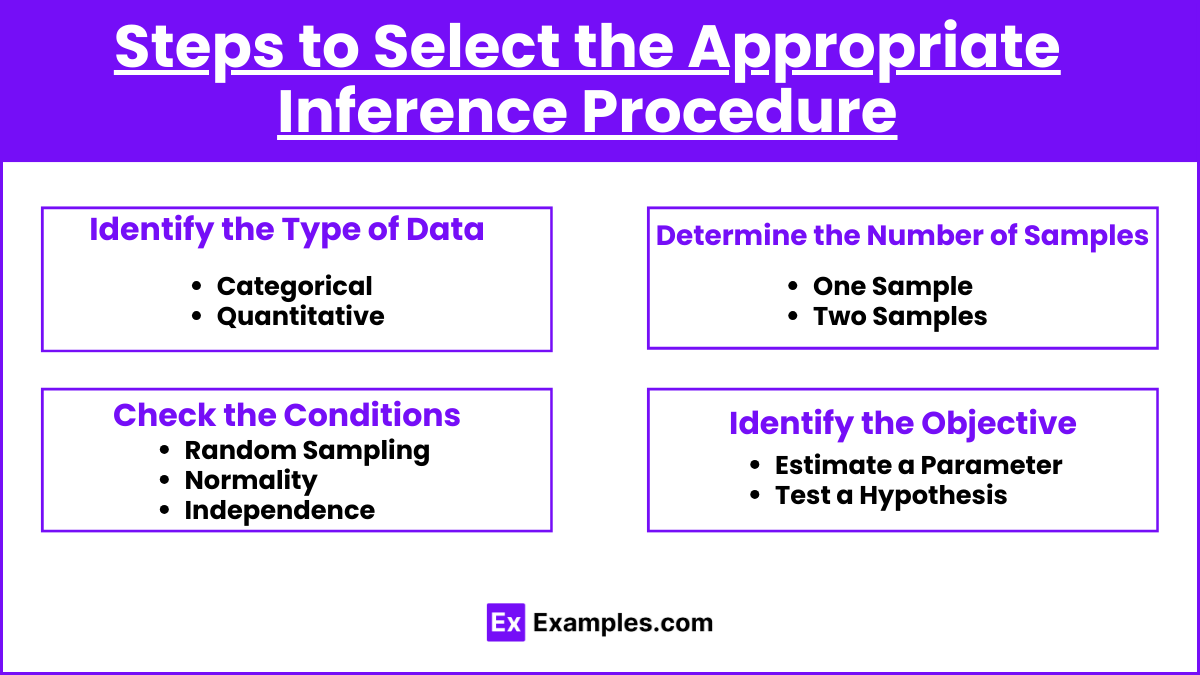
- Identify the Type of Data:
- Categorical: Use procedures involving proportions or chi-square tests.
- Quantitative: Use procedures involving means, medians, or regression.
- Determine the Number of Samples:
- One Sample: Procedures like one-sample z-tests, one-sample t-tests, and corresponding confidence intervals.
- Two Samples: Consider whether the samples are independent or paired.
- Independent: Two-sample z or t-tests, two-sample confidence intervals.
- Paired: Paired t-tests or paired confidence intervals.
- Check the Conditions:
- Random Sampling: The data must come from a random sample or randomized experiment.
- Normality: For t-procedures, check if the data distribution is approximately normal.
- Independence: Data points should be independent of each other.
- Identify the Objective:
- Estimate a Parameter: Use a confidence interval.
- Test a Hypothesis: Use an appropriate hypothesis test.
Examples
Example 1: Proportion of Voters Supporting a Candidate
- Scenario: You want to estimate the proportion of voters who support a candidate.
- Procedure: One-sample z-interval for a proportion.
- Explanation: Since you are estimating a single population proportion, this is the appropriate method.
Example 2: Difference in Average Test Scores Between Two Groups
- Scenario: Compare average test scores between two independent groups of students.
- Procedure: Two-sample t-test for means.
- Explanation: You are comparing means from two independent samples, so the two-sample t-test is suitable.
Example 3: Testing the Effect of a New Drug
- Scenario: You want to test whether a new drug is more effective than a placebo in a paired study.
- Procedure: Paired t-test.
- Explanation: The data is paired (e.g., before and after treatment), so a paired t-test is appropriate.
Example 4: Association Between Two Categorical Variables
- Scenario: Test whether there is an association between gender and preference for a product.
- Procedure: Chi-square test of independence.
- Explanation: Both variables are categorical, and you want to test for association.
Example 5: Predicting Final Exam Scores Based on Study Hours
- Scenario: You want to determine if there is a significant linear relationship between study hours and final exam scores.
- Procedure: t-test for the slope in linear regression.
- Explanation: You are assessing the slope of the regression line, which involves a t-test.
Multiple-Choice Questions (MCQs)
Question 1:
You are studying whether a new teaching method is more effective than the traditional method. You randomly assign 50 students to each group and compare their final exam scores. Which inference procedure should you use?
- A) One-sample t-test for a mean
- B) Paired t-test
- C) Two-sample t-test for means
- D) Chi-square test of independence
Answer: C) Two-sample t-test for means
Explanation: The question involves comparing the means of two independent groups, making the two-sample t-test the correct procedure.
Question 2:
A researcher wants to estimate the proportion of people in a city who prefer a new flavor of ice cream. What is the appropriate inference procedure?
- A) One-sample z-test for a proportion
- B) One-sample z-interval for a proportion
- C) Two-sample t-test for means
- D) Paired t-test
Answer: B) One-sample z-interval for a proportion
Explanation: Since the researcher wants to estimate a proportion, a one-sample z-interval for a proportion is appropriate.
Question 3:
Which of the following conditions must be met to perform a one-sample t-test?
- A) The sample size must be greater than 30.
- B) The data must be categorical.
- C) The sample data should be approximately normally distributed.
- D) The population standard deviation must be known.
Answer: C) The sample data should be approximately normally distributed
Explanation: The one-sample t-test requires that the sample data be approximately normally distributed, especially if the sample size is small.