In AP Statistics, selecting an appropriate inference procedure for categorical data is crucial for drawing accurate conclusions from survey or experimental results. Categorical data, which categorizes individuals into groups or categories (like “yes” or “no,” “red” or “blue”), requires specific statistical tests to analyze proportions and associations. Depending on the research question and data structure, students must choose from procedures such as the one-proportion Z-test, two-proportion Z-test, or various chi-square tests. Understanding the context and assumptions of these methods ensures that the statistical inferences made are valid and reliable.
Learning Objectives
In learning about selecting an appropriate inference procedure for categorical data, you will be guided to understand how to identify the correct statistical test based on the type of categorical data. You will be taught to assess conditions for using tests such as the one-proportion Z-test, two-proportion Z-test, and chi-square tests. Emphasis will be placed on ensuring that assumptions are met, allowing you to confidently apply these methods in various statistical analyses.
Types of Inference Procedures for Categorical Data
One-Proportion Z-Test
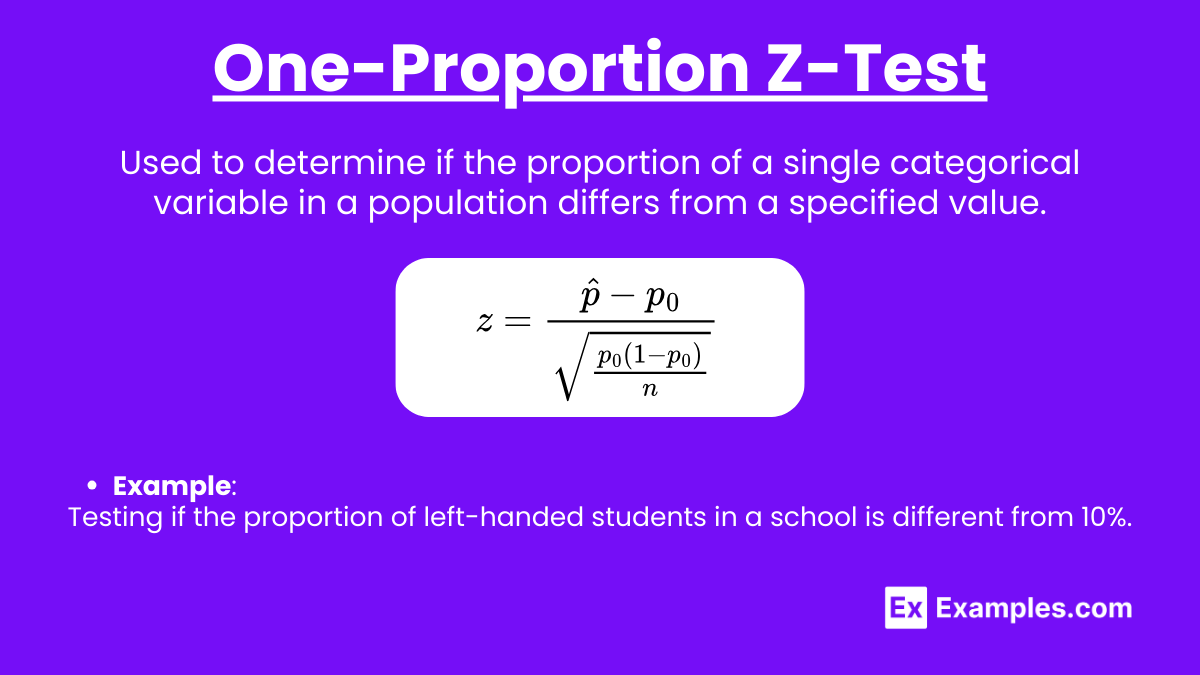
- Purpose: Used to determine if the proportion of a single categorical variable in a population differs from a specified value.
- Example: Testing if the proportion of left-handed students in a school is different from 10%.
- Conditions:
- Random sample.
- Large sample size (typically
 .
. - Independent observations.
Two-Proportion Z-Test
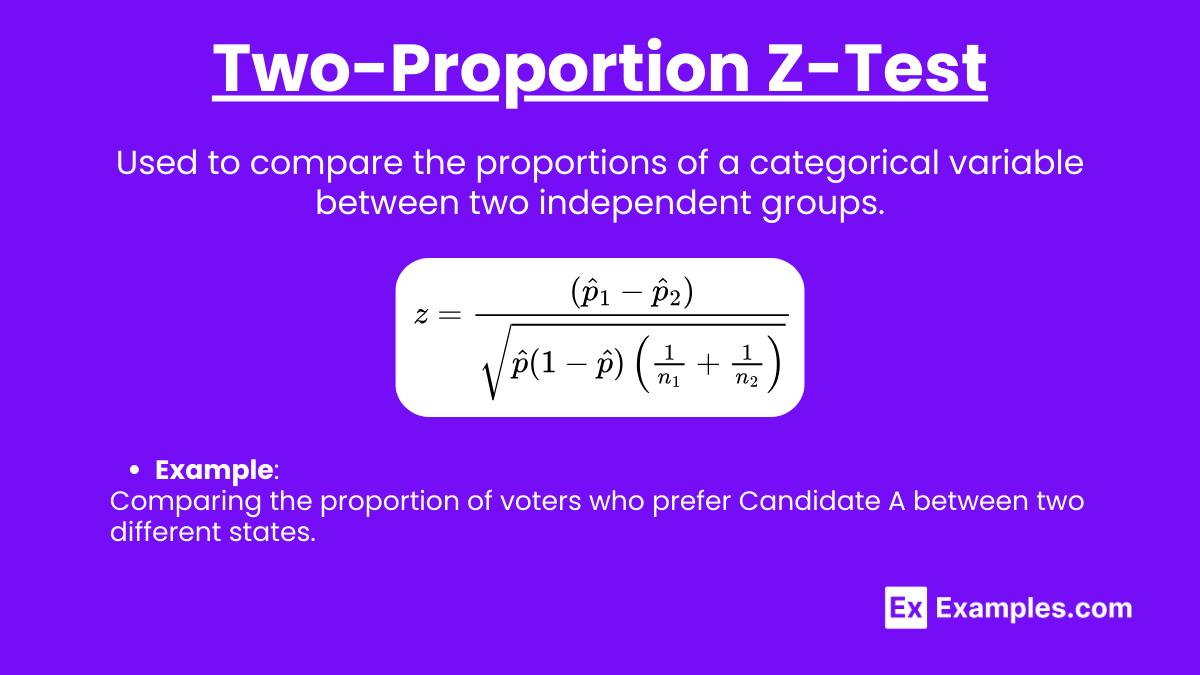
- Purpose: Used to compare the proportions of a categorical variable between two independent groups.
- Example: Comparing the proportion of voters who prefer Candidate A between two different states.
- Conditions:
- Random samples.
- Large enough sample size for both groups.
- Independent observations within and between groups.
Chi-Square Goodness-of-Fit Test
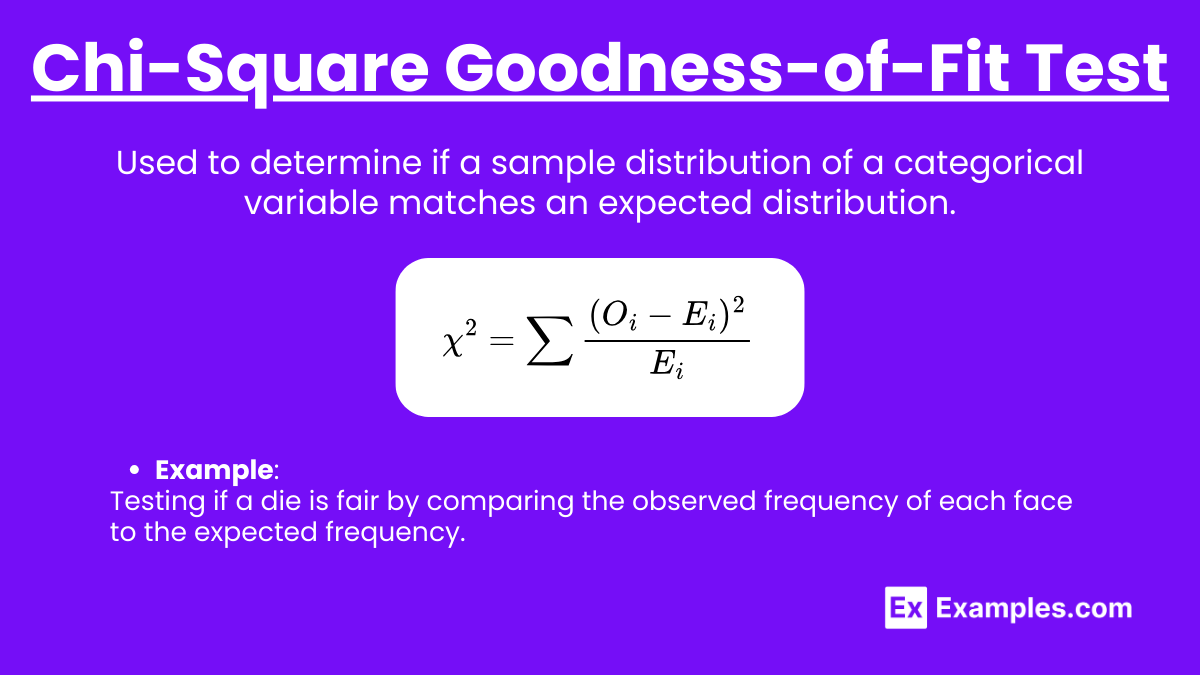
- Purpose: Used to determine if a sample distribution of a categorical variable matches an expected distribution.
- Example: Testing if a die is fair by comparing the observed frequency of each face to the expected frequency.
- Conditions:
- Random sample.
- All expected frequencies should be at least 5.
- Independent observations.
Chi-Square Test of Independence
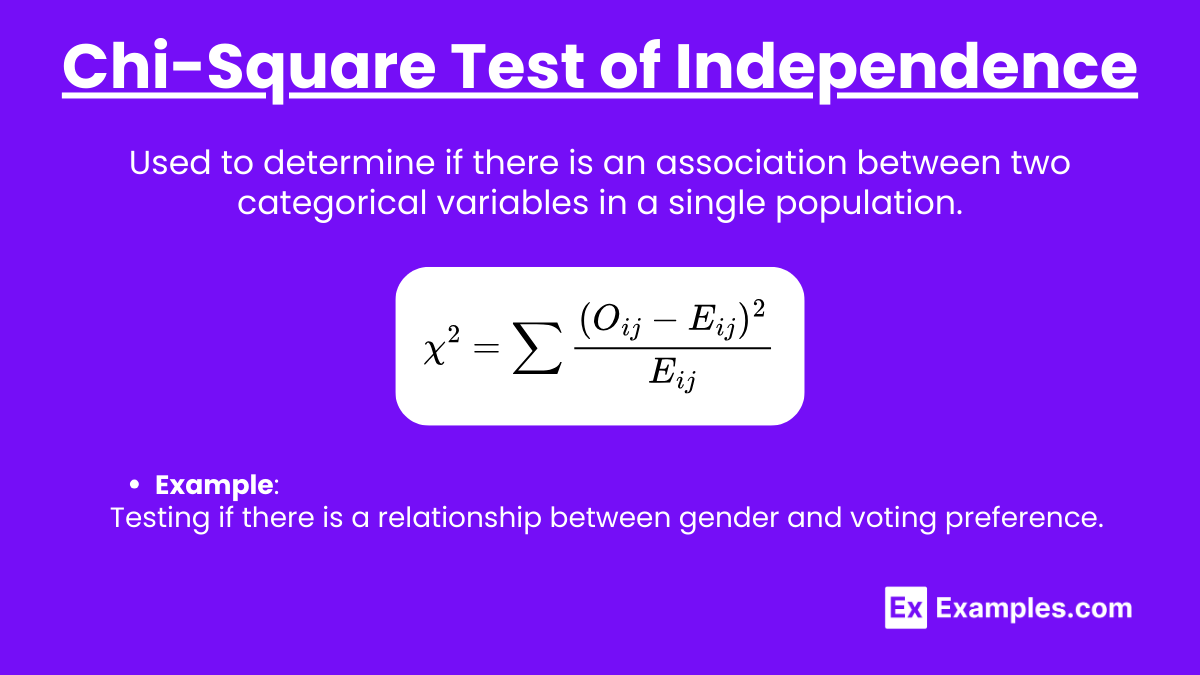
- Purpose: Used to determine if there is an association between two categorical variables in a single population.
- Example: Testing if there is a relationship between gender and voting preference.
- Conditions:
- Random sample.
- Large enough sample size (expected counts of at least 5 in each cell).
- Independent observations.
Chi-Square Test of Homogeneity
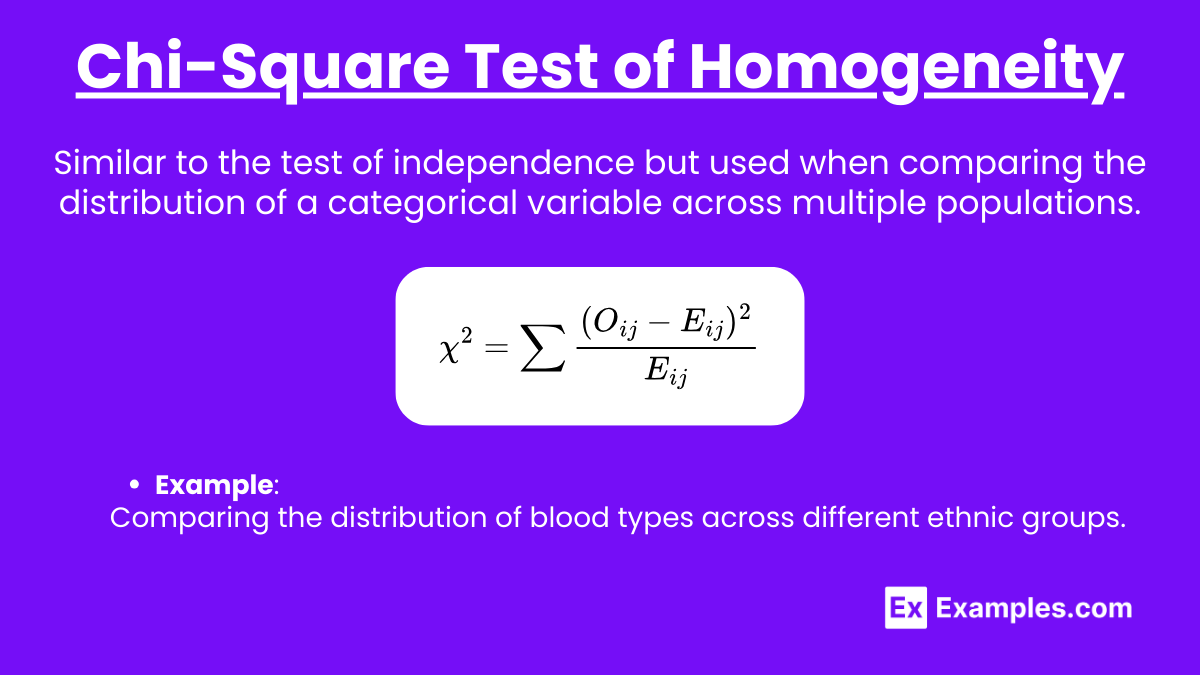
- Purpose: Similar to the test of independence but used when comparing the distribution of a categorical variable across multiple populations.
- Example: Comparing the distribution of blood types across different ethnic groups.
- Conditions:
- Random samples.
- Independent observations.
- Expected counts of at least 5 in each cell.
Steps to Selecting the Appropriate Procedure
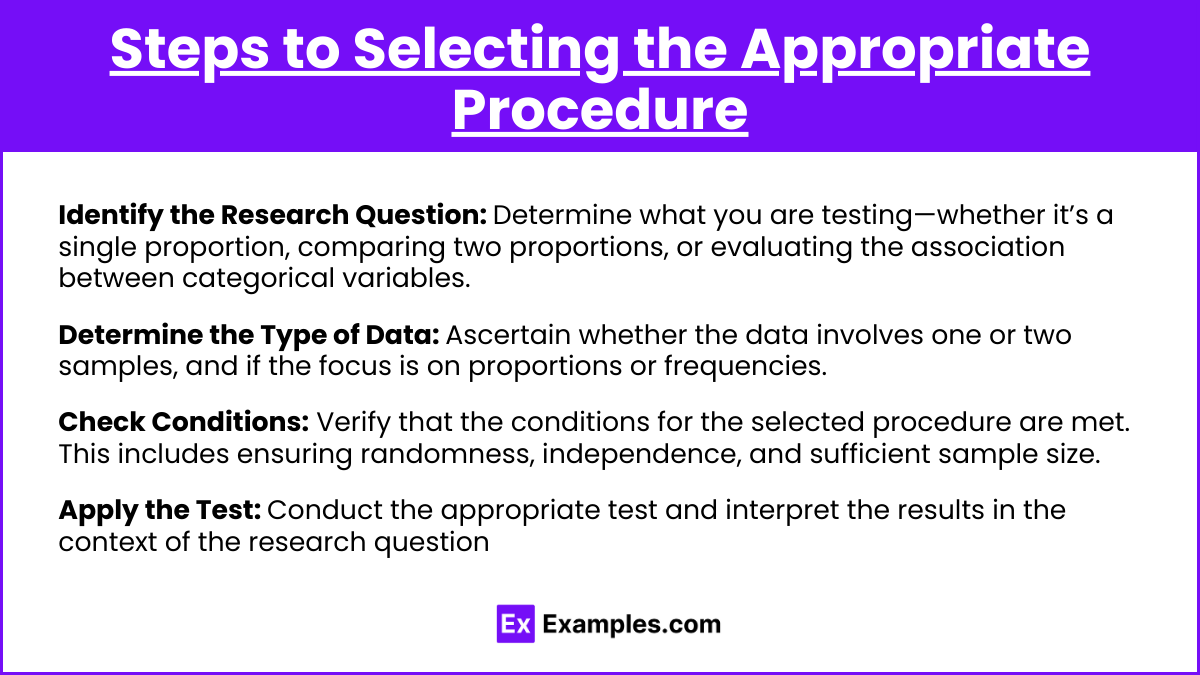
- Identify the Research Question: Determine what you are testing—whether it’s a single proportion, comparing two proportions, or evaluating the association between categorical variables.
- Determine the Type of Data: Ascertain whether the data involves one or two samples, and if the focus is on proportions or frequencies.
- Check Conditions: Verify that the conditions for the selected procedure are met. This includes ensuring randomness, independence, and sufficient sample size.
- Apply the Test: Conduct the appropriate test and interpret the results in the context of the research question.
Examples
Example 1: One-Proportion Z-Test
Scenario: A researcher claims that 30% of the population prefers a new brand of cereal. You sample 200 people, and 64 of them prefer the new brand. Is this significantly different from the claim?
Solution: Conduct a one-proportion Z-test to compare the sample proportion (0.32) with the claimed proportion (0.30).
Example 2: Two-Proportion Z-Test
Scenario: In a survey, 40% of 150 men and 30% of 200 women said they prefer watching sports on TV. Is there a significant difference in preference between men and women?
Solution: Use a two-proportion Z-test to compare the proportions between men and women.
Example 3: Chi-Square Goodness-of-Fit Test
Scenario: A bag of candy is supposed to contain equal amounts of red, blue, green, and yellow candies. You randomly select 100 candies and find 20 red, 30 blue, 25 green, and 25 yellow. Is the distribution as expected?
Solution: Perform a chi-square goodness-of-fit test comparing the observed and expected frequencies.
Example 4: Chi-Square Test of Independence
Scenario: A researcher wants to know if there is a relationship between students’ grade levels (freshman, sophomore, junior, senior) and their preference for online or in-person classes.
Solution: Use a chi-square test of independence to examine the association between grade level and class preference.
Example 5: Chi-Square Test of Homogeneity
Scenario: You want to compare the distribution of favorite pizza toppings among people from three different cities.
Solution: Conduct a chi-square test of homogeneity to compare the distributions across the three cities.
Multiple-Choice Questions
Which of the following tests would you use to determine if a sample proportion is different from a known population proportion?
- a) Two-proportion Z-test
- b) Chi-square test of independence
- c) One-proportion Z-test
- d) Chi-square goodness-of-fit test
Explanation: The one-proportion Z-test is used to compare a sample proportion to a known population proportion to see if there is a significant difference.
What is the main purpose of a chi-square test of independence?
- a) To compare two population means.
- b) To determine if there is an association between two categorical variables.
- c) To test if a sample proportion matches a population proportion.
- d) To compare the variances of two populations.
Explanation: The chi-square test of independence assesses whether there is a significant association between two categorical variables within a single population.
Which condition must be met for a chi-square goodness-of-fit test to be valid?
- a) The sample size must be at least 30.
- b) The data must come from a normally distributed population.
- c) All expected frequencies must be at least 5.
- d) The population standard deviation must be known.
Explanation: For the chi-square goodness-of-fit test, one of the key conditions is that all expected frequencies should be at least 5 to ensure the test’s validity.

