
Setting up and Carrying Out a Test For a Population Mean


 (two-sided),
  (one-sided), or
  (one-sided)
 ), the Central Limit Theorem suggests that the sampling distribution of the sample mean is approximately normal.
 is the sample mean
 is the hypothesized population mean
 is the sample standard deviation
 is the sample size
 , reject the null hypothesis.
 , fail to reject the null hypothesis.


 . The p-value is approximately 0.02, which is less than 0.05. Hence, reject H0H₀H0 and conclude that the average height is different from 20 meters.
 is ideal for the Central Limit Theorem to apply, it is not a strict requirement. A t-test can still be conducted with a smaller sample size, especially if the population distribution is approximately normal.
In AP Statistics, hypothesis testing for a population mean is a fundamental technique that enables students to make inferences about a population based on sample data. This process involves comparing a sample mean to a hypothesized population mean to determine whether there is enough evidence to reject the null hypothesis. By following a structured approach—stating the hypotheses, choosing a significance level, checking assumptions, calculating the test statistic, finding the p-value, and making a conclusion—students can draw meaningful conclusions about population parameters. Mastery of this concept is essential for success in both the AP exam and real-world statistical analysis.
Learning Objectives
In this lesson on setting up and carrying out a test for a population mean, you will be introduced to the process of hypothesis testing for population means. You will be guided through the steps of formulating hypotheses, choosing an appropriate significance level, and calculating the test statistic. The method of interpreting p-values and making informed decisions based on statistical evidence will also be learned. Confidence in conducting and interpreting tests for population means will be developed through examples and practice.
Steps to Set Up and Carry Out a Test for a Population Mean
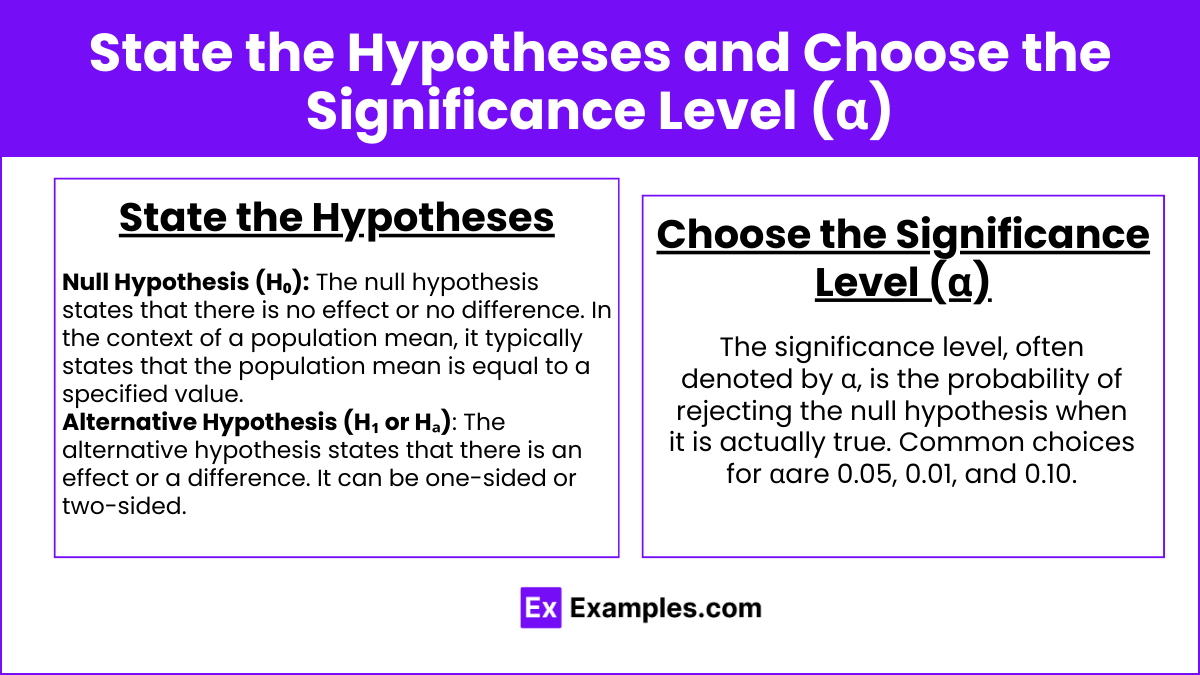
State the Hypotheses
Null Hypothesis (H₀): The null hypothesis states that there is no effect or no difference. In the context of a population mean, it typically states that the population mean is equal to a specified value.
Example:
Alternative Hypothesis (H₁ or Hₐ): The alternative hypothesis states that there is an effect or a difference. It can be one-sided or two-sided.
Example: (two-sided), (one-sided), or (one-sided)
Choose the Significance Level (α)
The significance level, often denoted by α, is the probability of rejecting the null hypothesis when it is actually true. Common choices for αare 0.05, 0.01, and 0.10.
Check Assumptions
Ensure the conditions for performing the test are met:
Randomness: The data should come from a random sample or randomized experiment.
Independence: Observations must be independent of each other.
Normality: The population distribution should be approximately normal, especially important for small sample sizes. If the sample size is large (usually ), the Central Limit Theorem suggests that the sampling distribution of the sample mean is approximately normal.
Calculate the Test Statistic
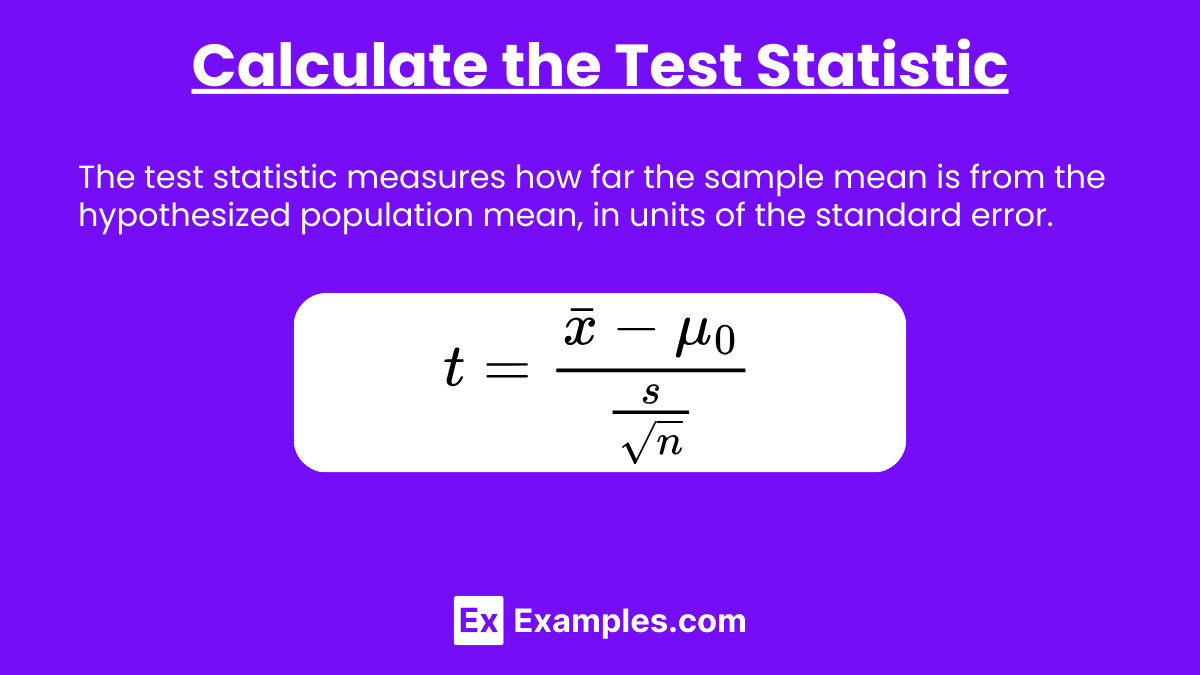
The test statistic measures how far the sample mean is from the hypothesized population mean, in units of the standard error.
For a population mean, the test statistic is given by:
where:
is the sample mean
is the hypothesized population mean
is the sample standard deviation
is the sample size
Find the p-value
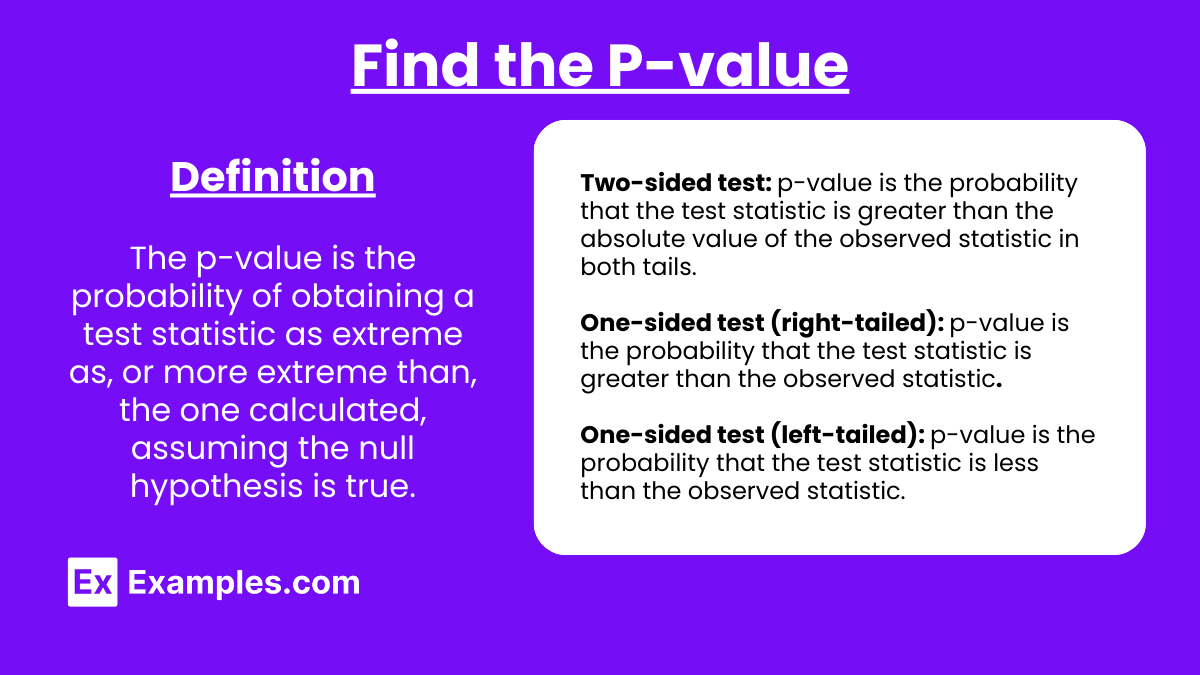
The p-value is the probability of obtaining a test statistic as extreme as, or more extreme than, the one calculated, assuming the null hypothesis is true.
Depending on the alternative hypothesis, the p-value is calculated differently:
Two-sided test: ppp-value is the probability that the test statistic is greater than the absolute value of the observed statistic in both tails.
One-sided test (right-tailed): ppp-value is the probability that the test statistic is greater than the observed statistic.
One-sided test (left-tailed): ppp-value is the probability that the test statistic is less than the observed statistic.
Make a Decision
Compare the p-value to the significance level α\alphaα:
If , reject the null hypothesis.
If , fail to reject the null hypothesis.
State the Conclusion
Based on the decision, state the conclusion in the context of the problem, indicating whether there is sufficient evidence to support the alternative hypothesis.
Examples
Example 1
A cereal company claims that the mean weight of cereal boxes is 500 grams. A quality control officer selects a random sample of 25 boxes and finds a mean weight of 495 grams with a standard deviation of 5 grams. Test the claim at the 0.05 significance level.
H₀:
H₁:
Significance Level:
Test Statistic:
p-value: The p-value is extremely small, less than 0.05.
Decision: Reject H₀.
Conclusion: There is sufficient evidence to suggest that the mean weight of cereal boxes is not 500 grams.
Example 2
A professor claims that the average time students spend on homework each week is 10 hours. A sample of 30 students has a mean of 9.5 hours with a standard deviation of 1.5 hours. Test the claim at the 0.01 significance level.
H₀: μ=10
H₁: μ<10
Significance Level: α=0.01
Test Statistic:
p-value: Using a t-distribution table, the p-value is around 0.04.
Decision: Fail to reject H0H₀H0 because the p-value is greater than 0.01.
Conclusion: There is not enough evidence to support the claim that students spend less than 10 hours on homework.
Example 3
A pharmaceutical company claims that its drug reduces blood pressure by 8 mm Hg on average. In a study, 40 patients experienced an average reduction of 7.5 mm Hg with a standard deviation of 2 mm Hg. Test the claim at the 0.05 significance level.
H₀: μ=8
H₁: μ≠8
Significance Level: α=0.05
Test Statistic:
p-value: The p-value is approximately 0.12.
Decision: Fail to reject H₀.
Conclusion: There is not enough evidence to reject the claim that the drug reduces blood pressure by 8 mm Hg.
Example 4
A school principal claims that the mean score of students on a standardized test is 75. A sample of 50 students has a mean score of 73 with a standard deviation of 4. Test the principal's claim at the 0.05 significance level.
H₀: μ=75
H₁: μ≠75
Significance Level: α=0.05
Test Statistic:
p-value: The p-value is less than 0.01.
Decision: Reject H0H₀H0.
Conclusion: There is sufficient evidence to suggest that the mean score is not 75.
Example 5
A beverage company claims that its soda cans contain an average of 355 ml of soda. A random sample of 36 cans shows a mean of 352 ml with a standard deviation of 3 ml. Test the company's claim at the 0.05 significance level.
H₀: μ=355
H₁: μ<355
Significance Level: α=0.05
Test Statistic:
p-value: The p-value is very small, less than 0.001.
Decision: Reject H₀.
Conclusion: There is sufficient evidence to suggest that the average content is less than 355 ml.
Multiple Choice Questions
Question 1
A researcher claims that the average height of a certain species of tree is 20 meters. A sample of 25 trees has a mean height of 19.5 meters with a standard deviation of 1 meter. Test this claim at the 0.05 significance level. What is the correct conclusion?
A) Reject the null hypothesis; there is sufficient evidence to conclude the average height is 20 meters.
B) Fail to reject the null hypothesis; there is not enough evidence to conclude the average height is different from 20 meters.
C) Reject the null hypothesis; there is sufficient evidence to conclude the average height is different from 20 meters.
D) Fail to reject the null hypothesis; there is sufficient evidence to conclude the average height is 19.5 meters.
Answer: C) Reject the null hypothesis; there is sufficient evidence to conclude the average height is different from 20 meters.
Explanation: The test statistic is . The p-value is approximately 0.02, which is less than 0.05. Hence, reject H0H₀H0 and conclude that the average height is different from 20 meters.
Question 2
If a two-tailed hypothesis test for a population mean results in a p-value of 0.04, what should be the conclusion if the significance level α is 0.05?
A) Reject H0H₀H0; there is sufficient evidence to conclude that the population mean is not equal to the hypothesized value.
B) Fail to reject H0H₀H0; there is not enough evidence to conclude that the population mean is not equal to the hypothesized value.
C) Reject H0H₀H0; there is sufficient evidence to conclude that the population mean is equal to the hypothesized value.
D) Fail to reject H0H₀H0; there is enough evidence to conclude that the population mean is not equal to the hypothesized value.
Answer: A) Reject H0H₀H0; there is sufficient evidence to conclude that the population mean is not equal to the hypothesized value.
Explanation: Since the p-value (0.04) is less than the significance level (0.05), we reject the null hypothesis.
Question 3
Which of the following conditions is not necessary for conducting a t-test for a population mean?
A) The sample data must be from a random sample or randomized experiment.
B) The sample size must be at least 30.
C) The population distribution should be approximately normal if the sample size is small.
D) The sample observations must be independent.
Answer: B) The sample size must be at least 30.
Explanation: While a larger sample size (typically is ideal for the Central Limit Theorem to apply, it is not a strict requirement. A t-test can still be conducted with a smaller sample size, especially if the population distribution is approximately normal.