
While being in the academe, you often hear discussions about the parts of speech. And you get confused about the different roles each of those play in sentence construction and overall grammar. It can get confusing as one is closely related to each other; you might mistake one for another. Therefore, it is really important to get to know and understand the function of each parts of speech.
As you advance further in the academe, you may also have encountered a discussion about clauses, and those are the independent and dependent clauses. With this is mind, one type of a dependent clause or subordinate clause is an adverb or adverbial clause. This guide will discuss all about an adverbial clause along with informative examples you can use as guide and reference.
What is an Adverb Clause? – Definition
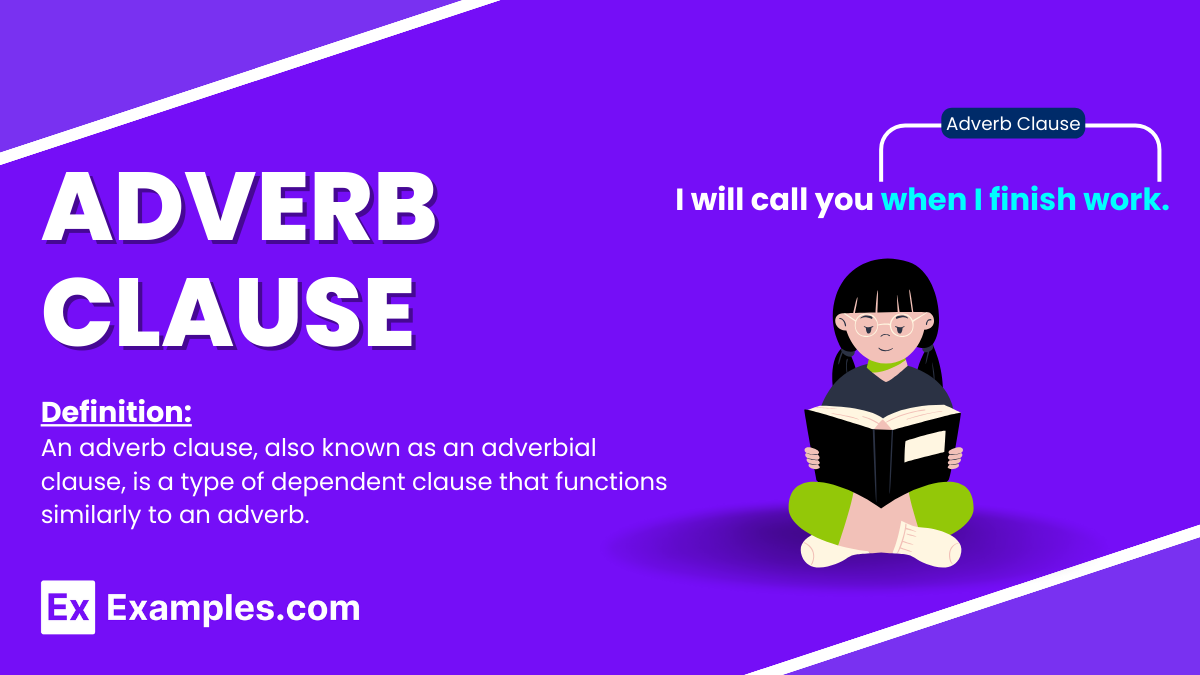
An adverb clause, also known as an adverbial clause, is a type of dependent clause that functions similarly to an adverb. This means it modifies verbs, adjectives, or other adverbs within the main clause of a sentence to provide more details about the action or state. Specifically, adverb clauses give information on aspects such as time, cause, condition, contrast, and manner. They begin with subordinating conjunctions like “because,” “if,” “when,” “although,” and “since,” which not only introduce the clause but also indicate the kind of relationship it has with the independent clause it modifies.
Types of Adverbial Clauses
1. Time: These clauses indicate when something happens. They are introduced by conjunctions like “when,” “whenever,” “before,” “after,” “as soon as,” and “until.”
- Example: “She calls me whenever she arrives in New York.”
2. Place: Place clauses specify where an action occurs and are introduced by conjunctions such as “where” and “wherever.”
- Example: “You will find him where the books are.”
3. Reason: Reason clauses explain why something happens. They are introduced by conjunctions like “because,” “since,” and “as.”
- Example: “He was late because the traffic was heavy.”
4. Condition: These clauses specify a condition for the main clause’s action to occur and are introduced by “if,” “unless,” “provided that,” and “as long as.”
- Example: “If it rains, we will stay indoors.”
5. Purpose: Purpose clauses express the aim or goal of the action in the main clause, often introduced by “so that” and “in order that.”
- Example: “He saved money so that he could buy a new car.”
6. Manner: Manner clauses describe how an action is performed and are usually introduced by “as,” “as if,” and “as though.”
- Example: “She speaks as if she knows everything.”
7. Concession: Concession clauses acknowledge a contrasting situation, despite which the main clause’s action occurs. They are introduced by “although,” “even though,” “though,” and “whereas.”
- Example: “Although he was tired, he continued to work.”
8. Comparison: Comparison clauses compare one action to another and are introduced by “as … as,” “than,” and other comparative structures.
- Example: “He runs faster than I do.”
9. Result: Result clauses describe the outcome or result of the action in the main clause, often introduced by “so … that” and “such … that.”
- Example: “It was so cold that the water froze.”
How to Use Adverb Clauses?
1. Identify the Function:
First, determine what you want the adverb clause to convey. Do you want to show time, reason, condition, contrast, or manner? This will help you choose the right subordinating conjunction (like “when,” “because,” “if,” “although,” “as if”) to introduce your clause.
2. Choose the Right Subordinating Conjunction:
The conjunction you choose to introduce the adverb clause will signal the relationship it has with the main clause. Each type of adverb clause has its specific conjunctions that best express its function:
- Time: when, before, after, as soon as, until
- Reason: because, since, as
- Condition: if, unless
- Contrast: although, even though, whereas
- Manner: as, as if, as though
- Place: where, wherever
3. Positioning the Adverb Clause:
- Beginning of the Sentence: When the adverb clause comes at the beginning of the sentence, it’s usually followed by a comma. Example: “Because it was raining, we stayed home.”
- Middle or End of the Sentence: If the adverb clause is positioned in the middle or at the end of the sentence, it typically does not need a comma if it directly follows the clause it modifies. Example: “We stayed home because it was raining.”
4. Ensure the Clause is Dependent:
Remember that an adverb clause cannot stand alone as a complete sentence. It needs to be connected to an independent clause to provide additional information without forming a sentence fragment.
5. Maintain Clear Reference:
Make sure it’s clear which part of the sentence the adverb clause is modifying. The closer the adverb clause is to the word or phrase it modifies, the clearer your sentence will be.
6. Vary Your Sentence Structure:
Using a variety of sentence structures, including different types of adverb clauses, can make your writing more interesting and dynamic. Don’t shy away from experimenting with different placements and types of adverb clauses to see how they affect the rhythm and meaning of your sentences.
Tips for Understanding Adverbial Clauses
- Learn Subordinating Conjunctions: Identify and familiarize yourself with subordinating conjunctions like “because,” “if,” “when,” “although,” and “since.” These words often signal the start of an adverbial clause and indicate the relationship it has with the main clause.
- Recognize Their Function: Understand that adverbial clauses modify verbs, adjectives, or other adverbs in the main clause, providing additional information about time, reason, condition, manner, or place.
- Identify the Question Answered: Each adverbial clause answers specific questions such as “When?”, “Why?”, “How?”, or “Under what conditions?” Identifying these can help you grasp the clause’s purpose.
- Practice Identification: Regularly practice identifying adverbial clauses in sentences from books, articles, or conversations. This will help reinforce your understanding of their structure and function.
- Use Them to Add Detail: When writing or speaking, try using adverbial clauses to add detail and depth to your sentences, making your communication richer and more informative.
- Mind the Punctuation: Remember, when an adverbial clause comes before the main clause, it’s usually separated by a comma. But when it follows the main clause, a comma is typically not needed unless the clause provides additional, non-essential information.
- Combine Simple Sentences: Practice combining simple sentences into more complex ones using adverbial clauses. This exercise can help you see how adverbial clauses enhance sentence structure and meaning.
- Differentiate Between Clauses and Phrases: Be able to distinguish adverbial clauses (which contain a subject and a verb) from adverbial phrases (which do not contain both a subject and a verb).
- Experiment with Placement: Try placing adverbial clauses at the beginning, middle, or end of sentences to see how the placement affects the sentence’s rhythm and emphasis.
- Seek Feedback: When writing, seek feedback on your use of adverbial clauses. Constructive criticism can help you refine your usage and understanding.
Difference Between an Adverbial Clause and an Adverbial Phrase
| Feature | Adverbial Clause | Adverbial Phrase |
|---|---|---|
| Definition | A dependent clause that functions as an adverb, modifying a verb, an adjective, or another adverb in a sentence. It provides information about when, where, why, how, or under what conditions something happens. | A group of words that functions as an adverb, modifying a verb, an adjective, or another adverb without containing a subject and verb combination. |
| Structure | Contains a subject and a verb. It begins with a subordinating conjunction (e.g., because, if, when). | Does not contain a subject and verb combination. It may start with a preposition (e.g., in, on, by) or an infinitive (to + verb). |
| Example | “We will eat when you arrive.” (When you arrive is the adverbial clause, indicating the time of eating.) | “We will eat by 6 PM.” (By 6 PM is the adverbial phrase, indicating the time of eating.) |
| Punctuation | Often separated from the main clause by a comma when it precedes the main clause. No comma is needed when it follows the main clause unless it is non-essential information. | Punctuation is not typically used to separate adverbial phrases from the rest of the sentence unless for clarity or emphasis. |
| Function | Can express a wide range of details including time, reason, condition, manner, place, etc., providing a clear relationship with the main clause. | Provides similar information as adverbial clauses (time, manner, place, etc.) but in a more concise form without showing a clear relationship through a subordinating conjunction. |
| Flexibility | Due to its structure, it’s less flexible in terms of placement within a sentence. The meaning can change with the placement. | More flexible in terms of placement within a sentence without significantly altering the meaning. |
10+ Example of Adverbial Clauses
- Time: “I will call you when I finish work.”
- Reason: “She was late because the traffic was heavy.”
- Condition: “You can go out to play if you finish your homework.”
- Place: “Put the keys where you will remember to find them.”
- Purpose: “He saved his money so that he could buy a new bike.”
- Manner: “She sings as if she were a professional.”
- Concession (Contrast): “Although it was raining, we decided to go for a walk.”
- Comparison: “He can run faster than I can.”
- Result: “The movie was so scary that I couldn’t sleep at night.”
- Frequency: “Whenever I visit New York, I make sure to see a Broadway show.”

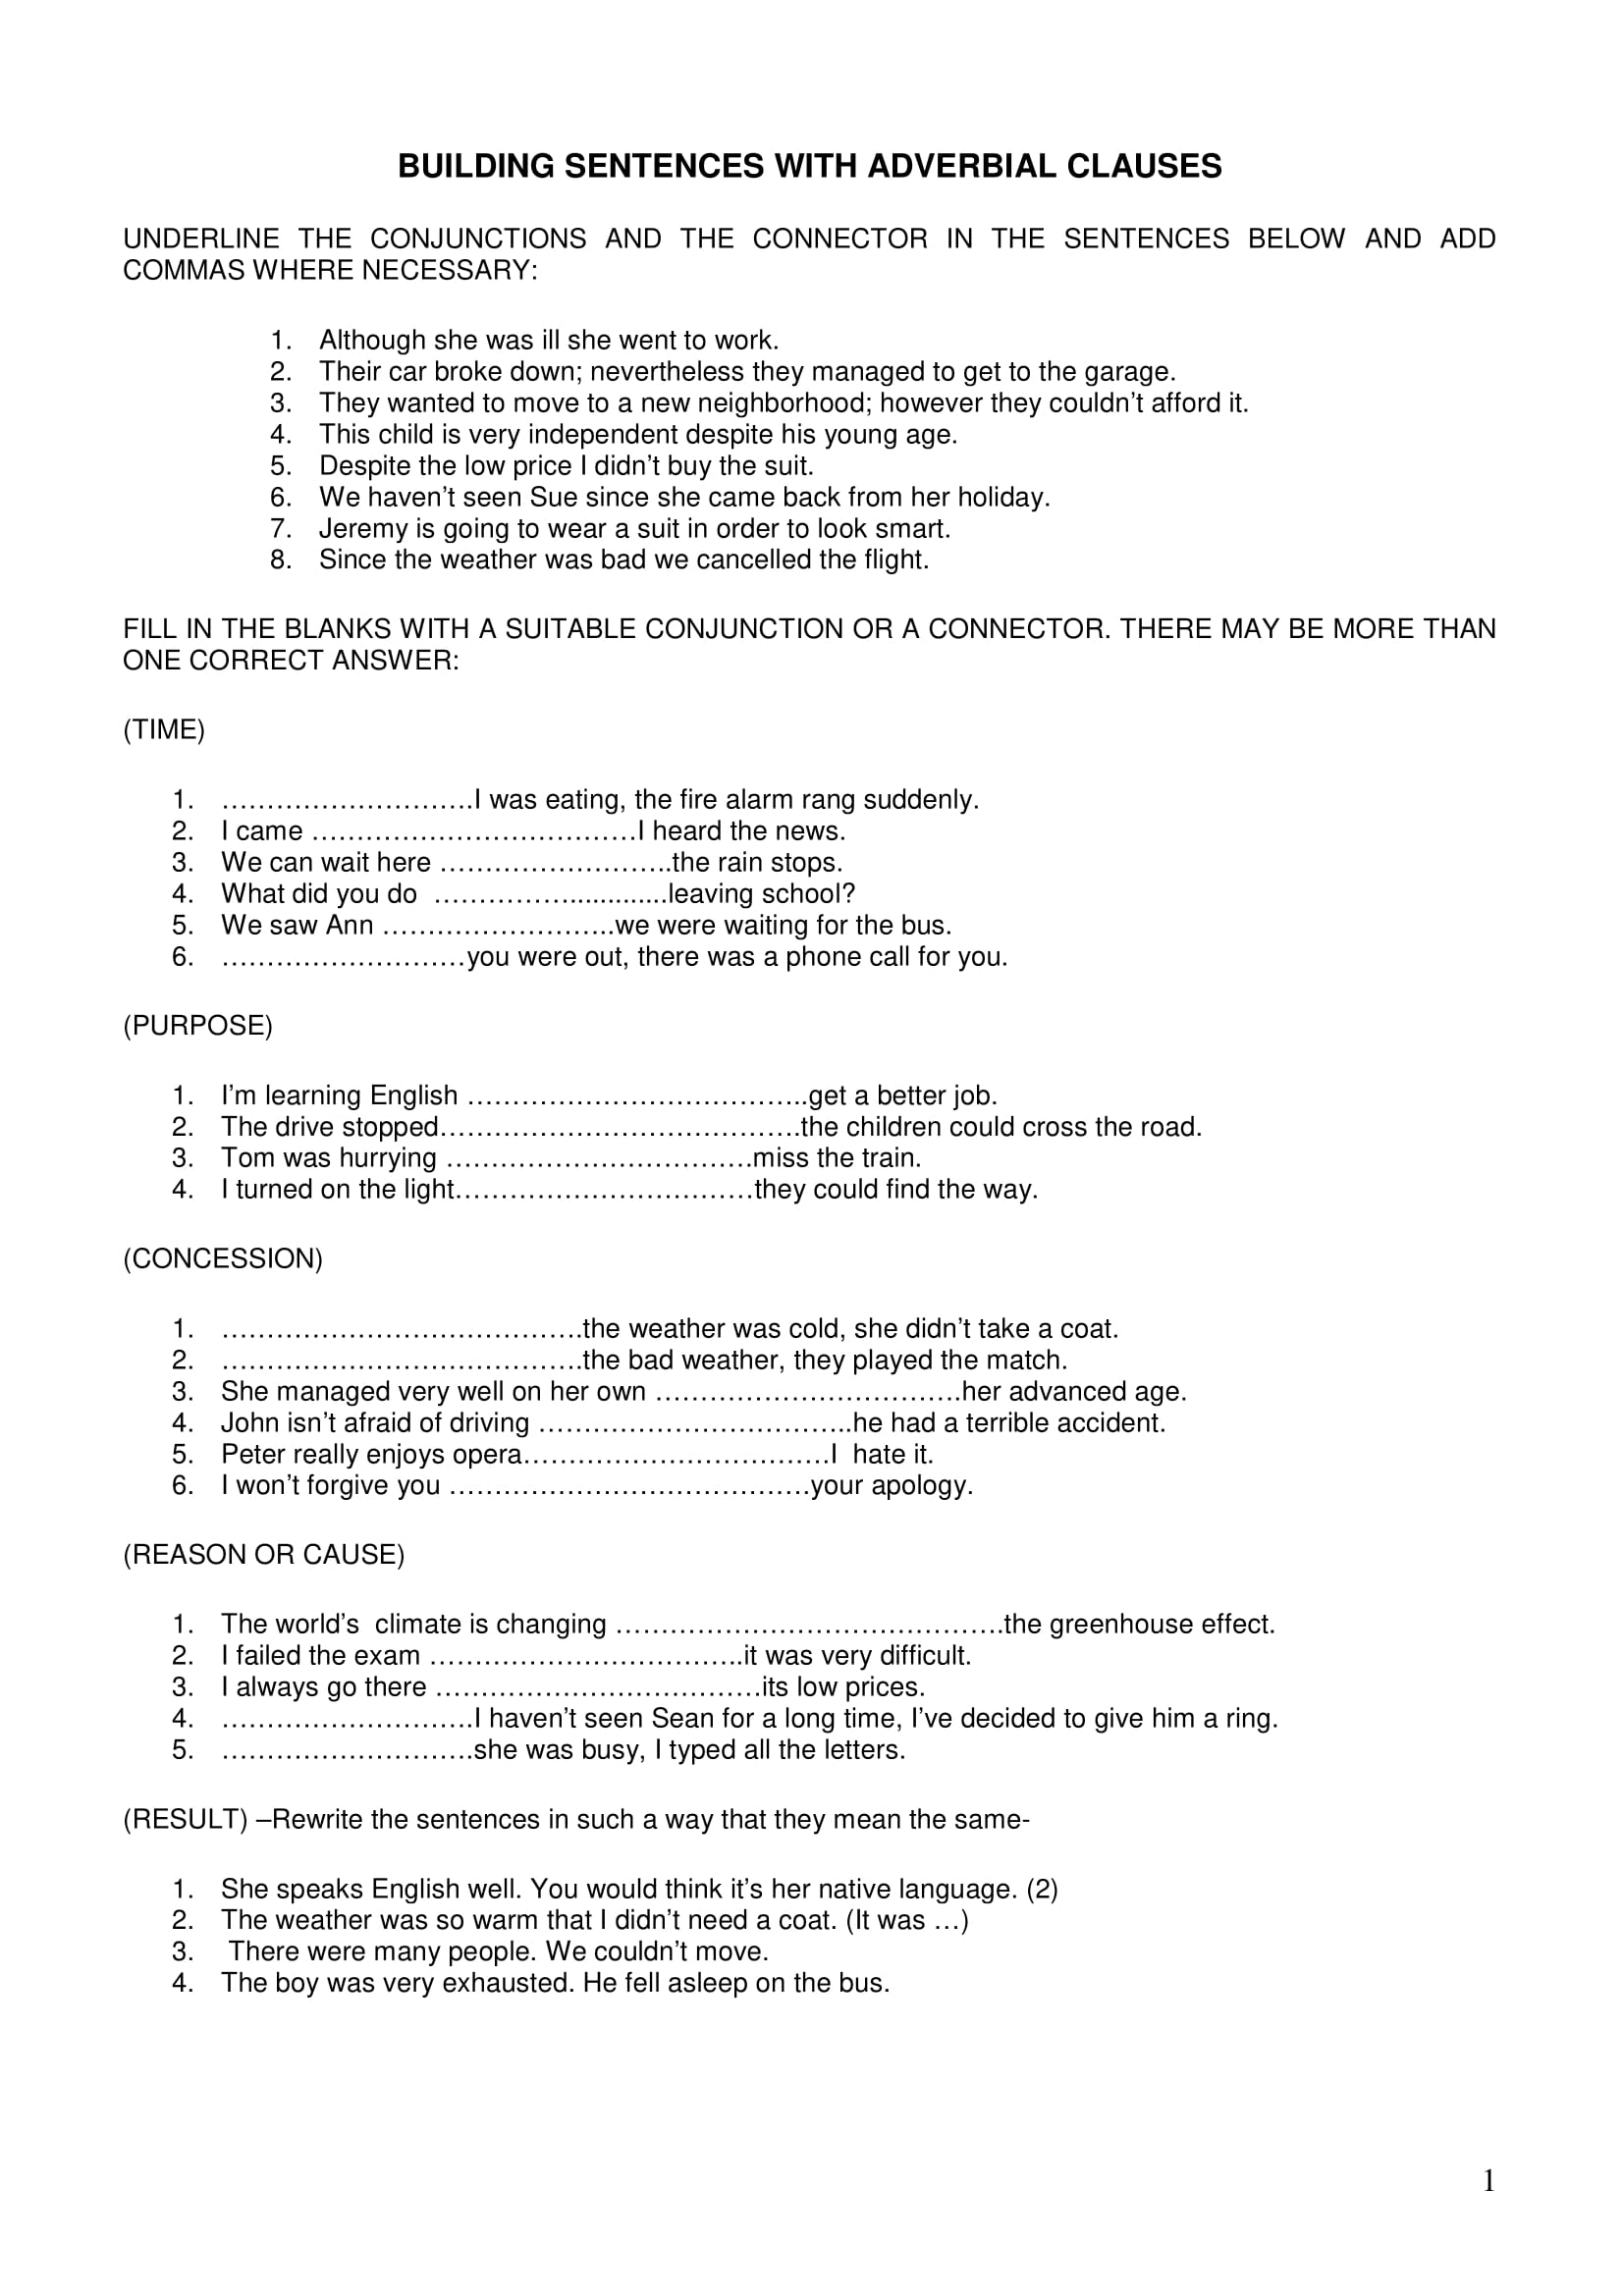
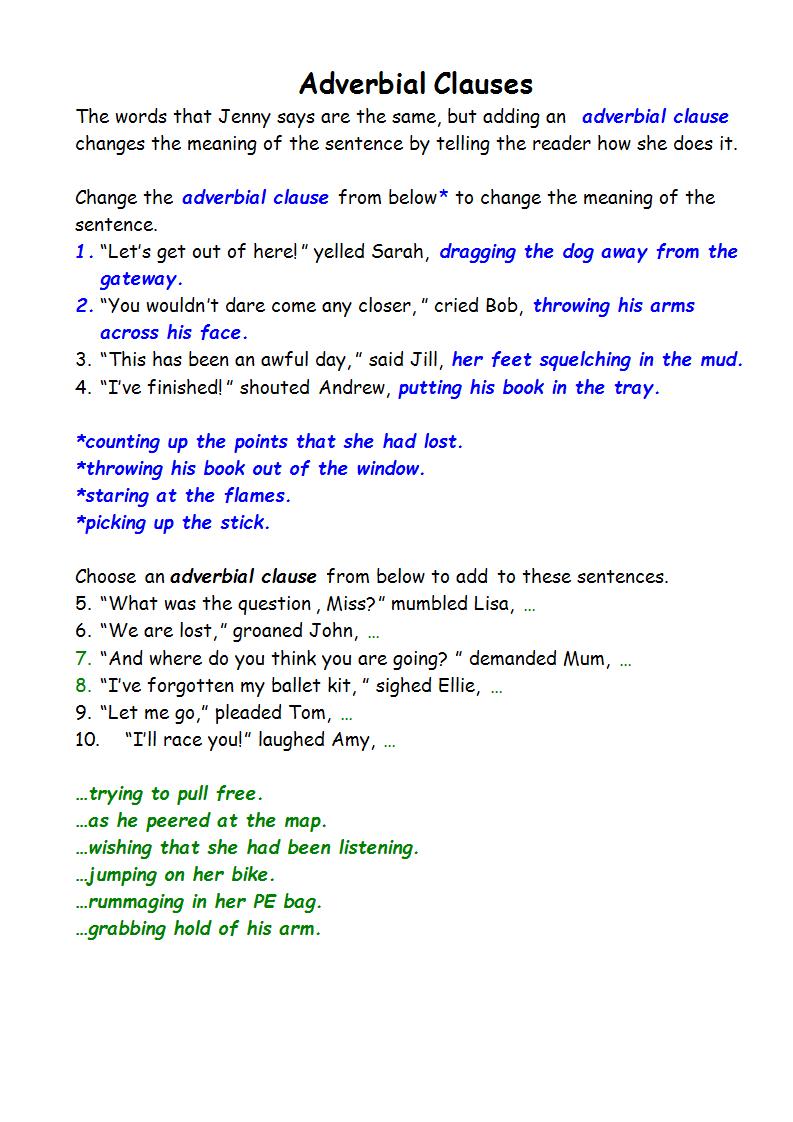
Sentence Construction with Adverbial Clauses Example
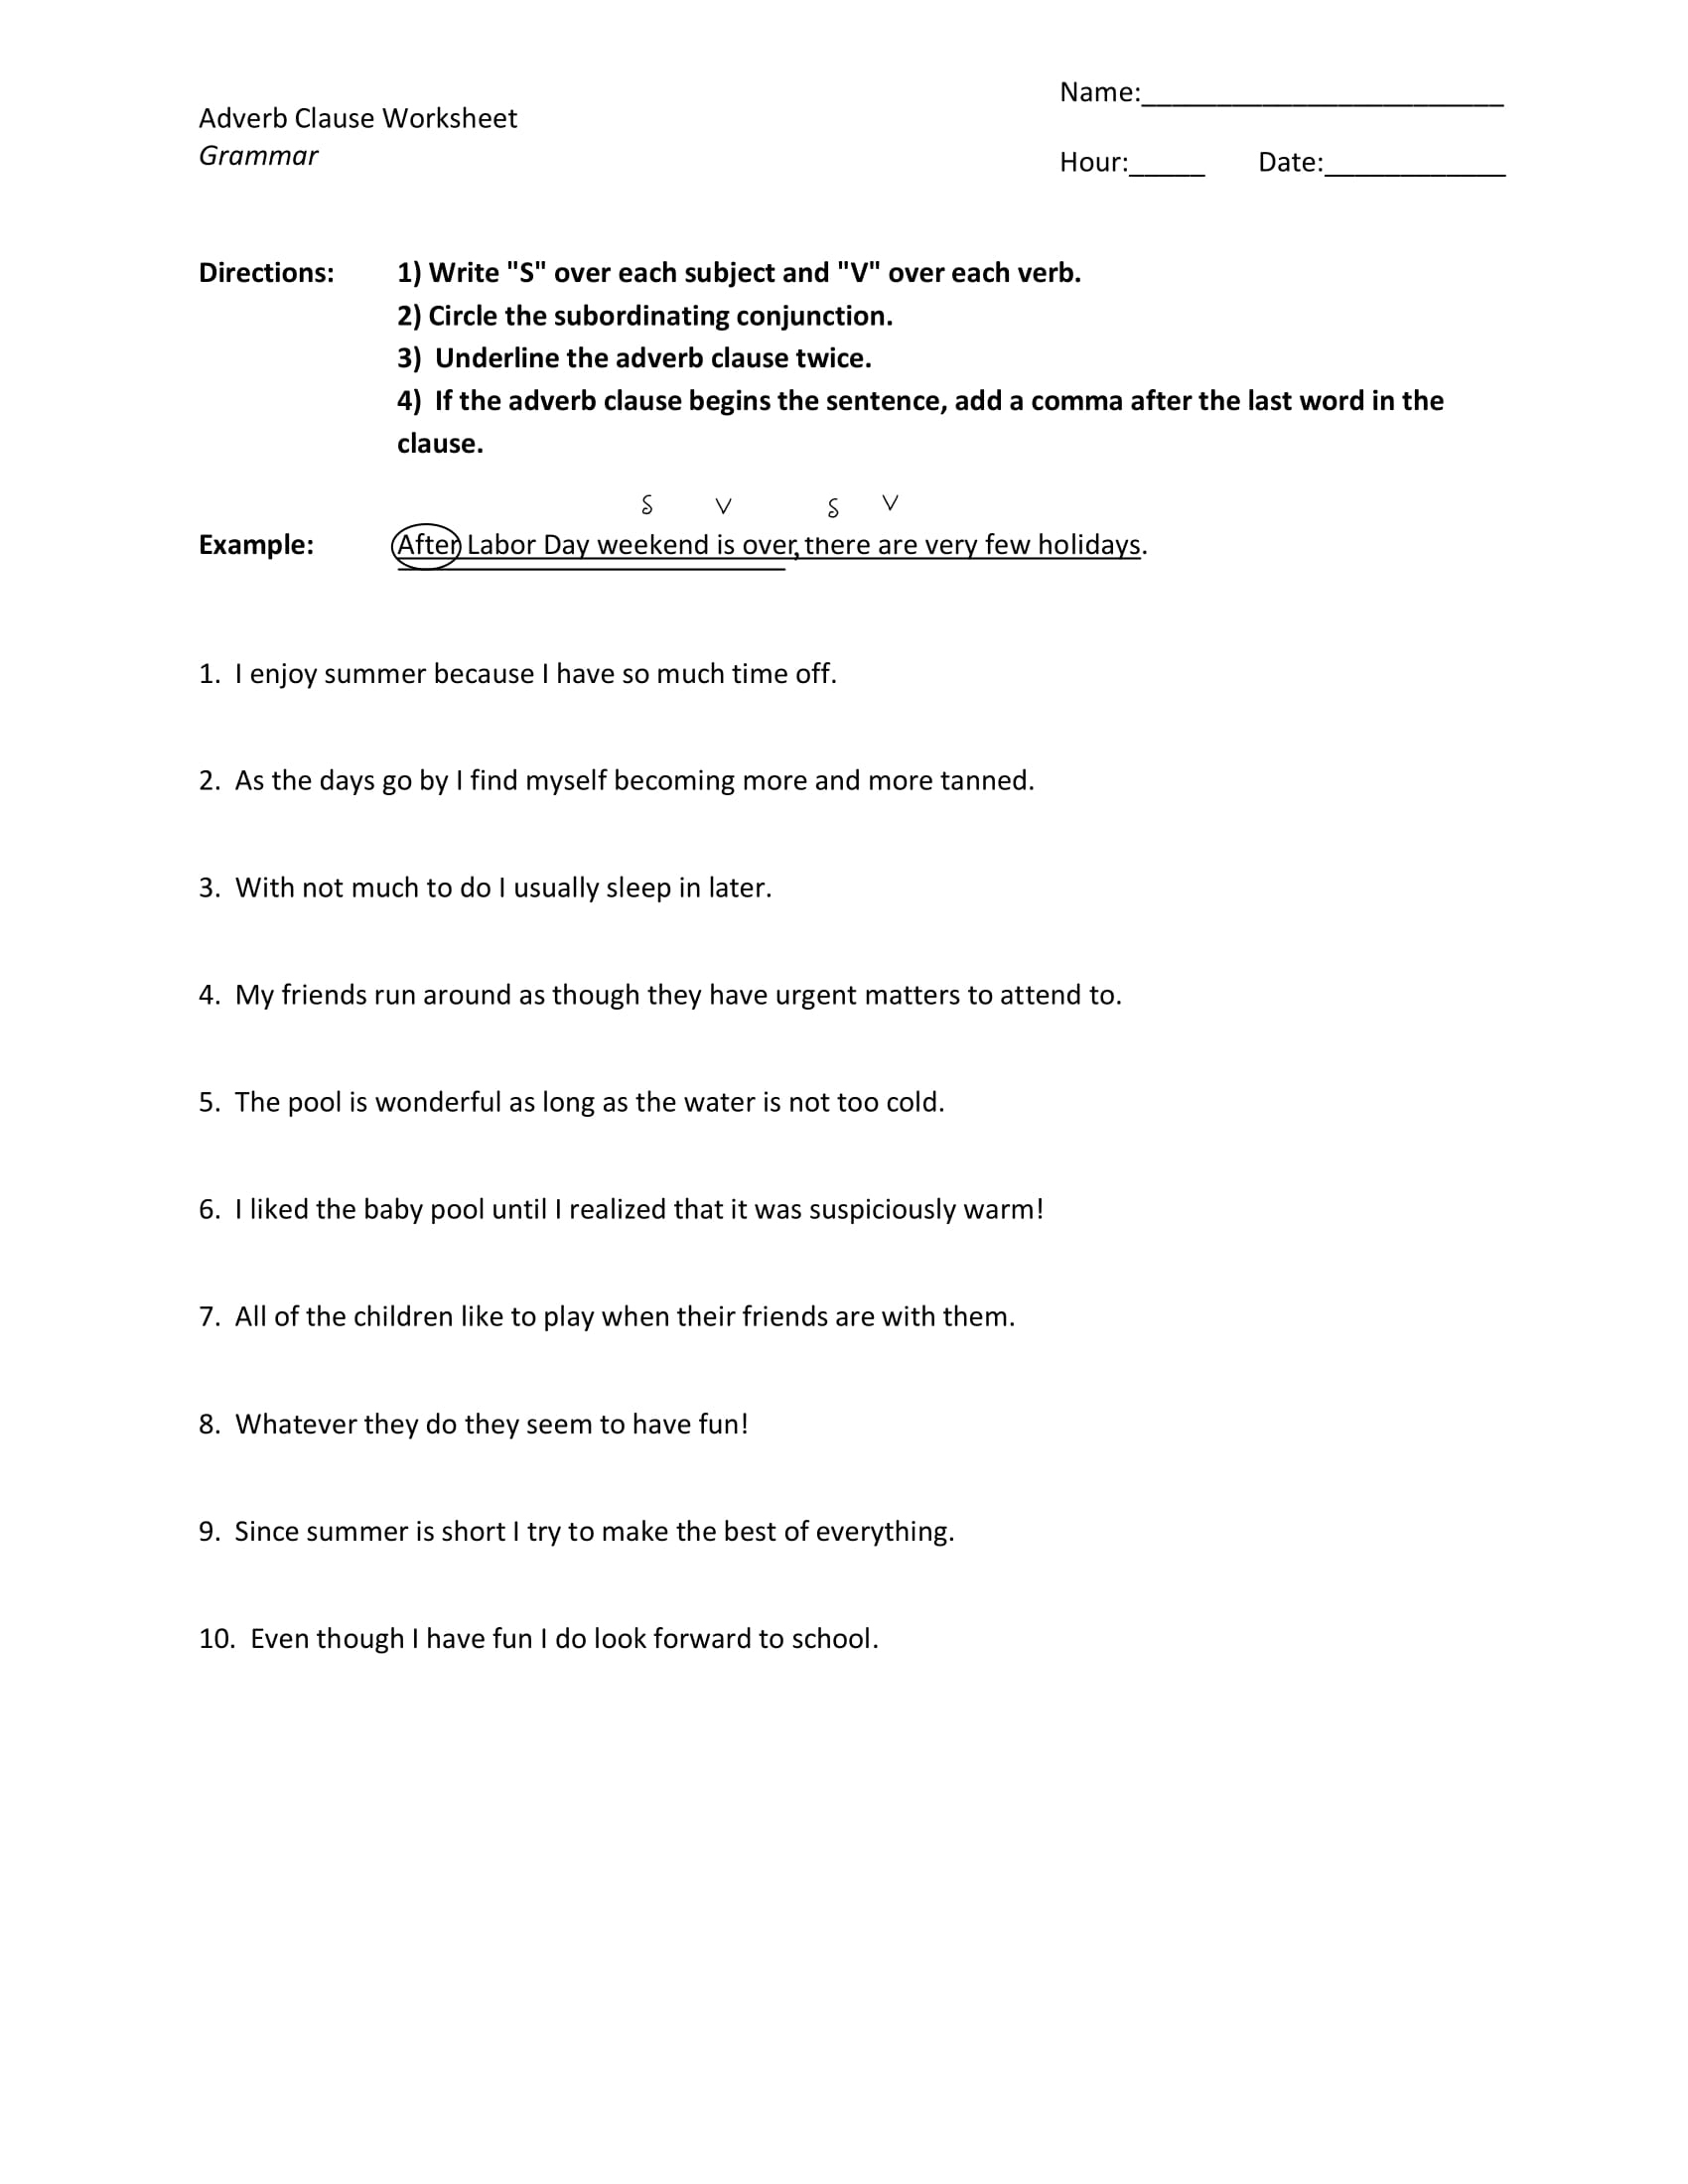
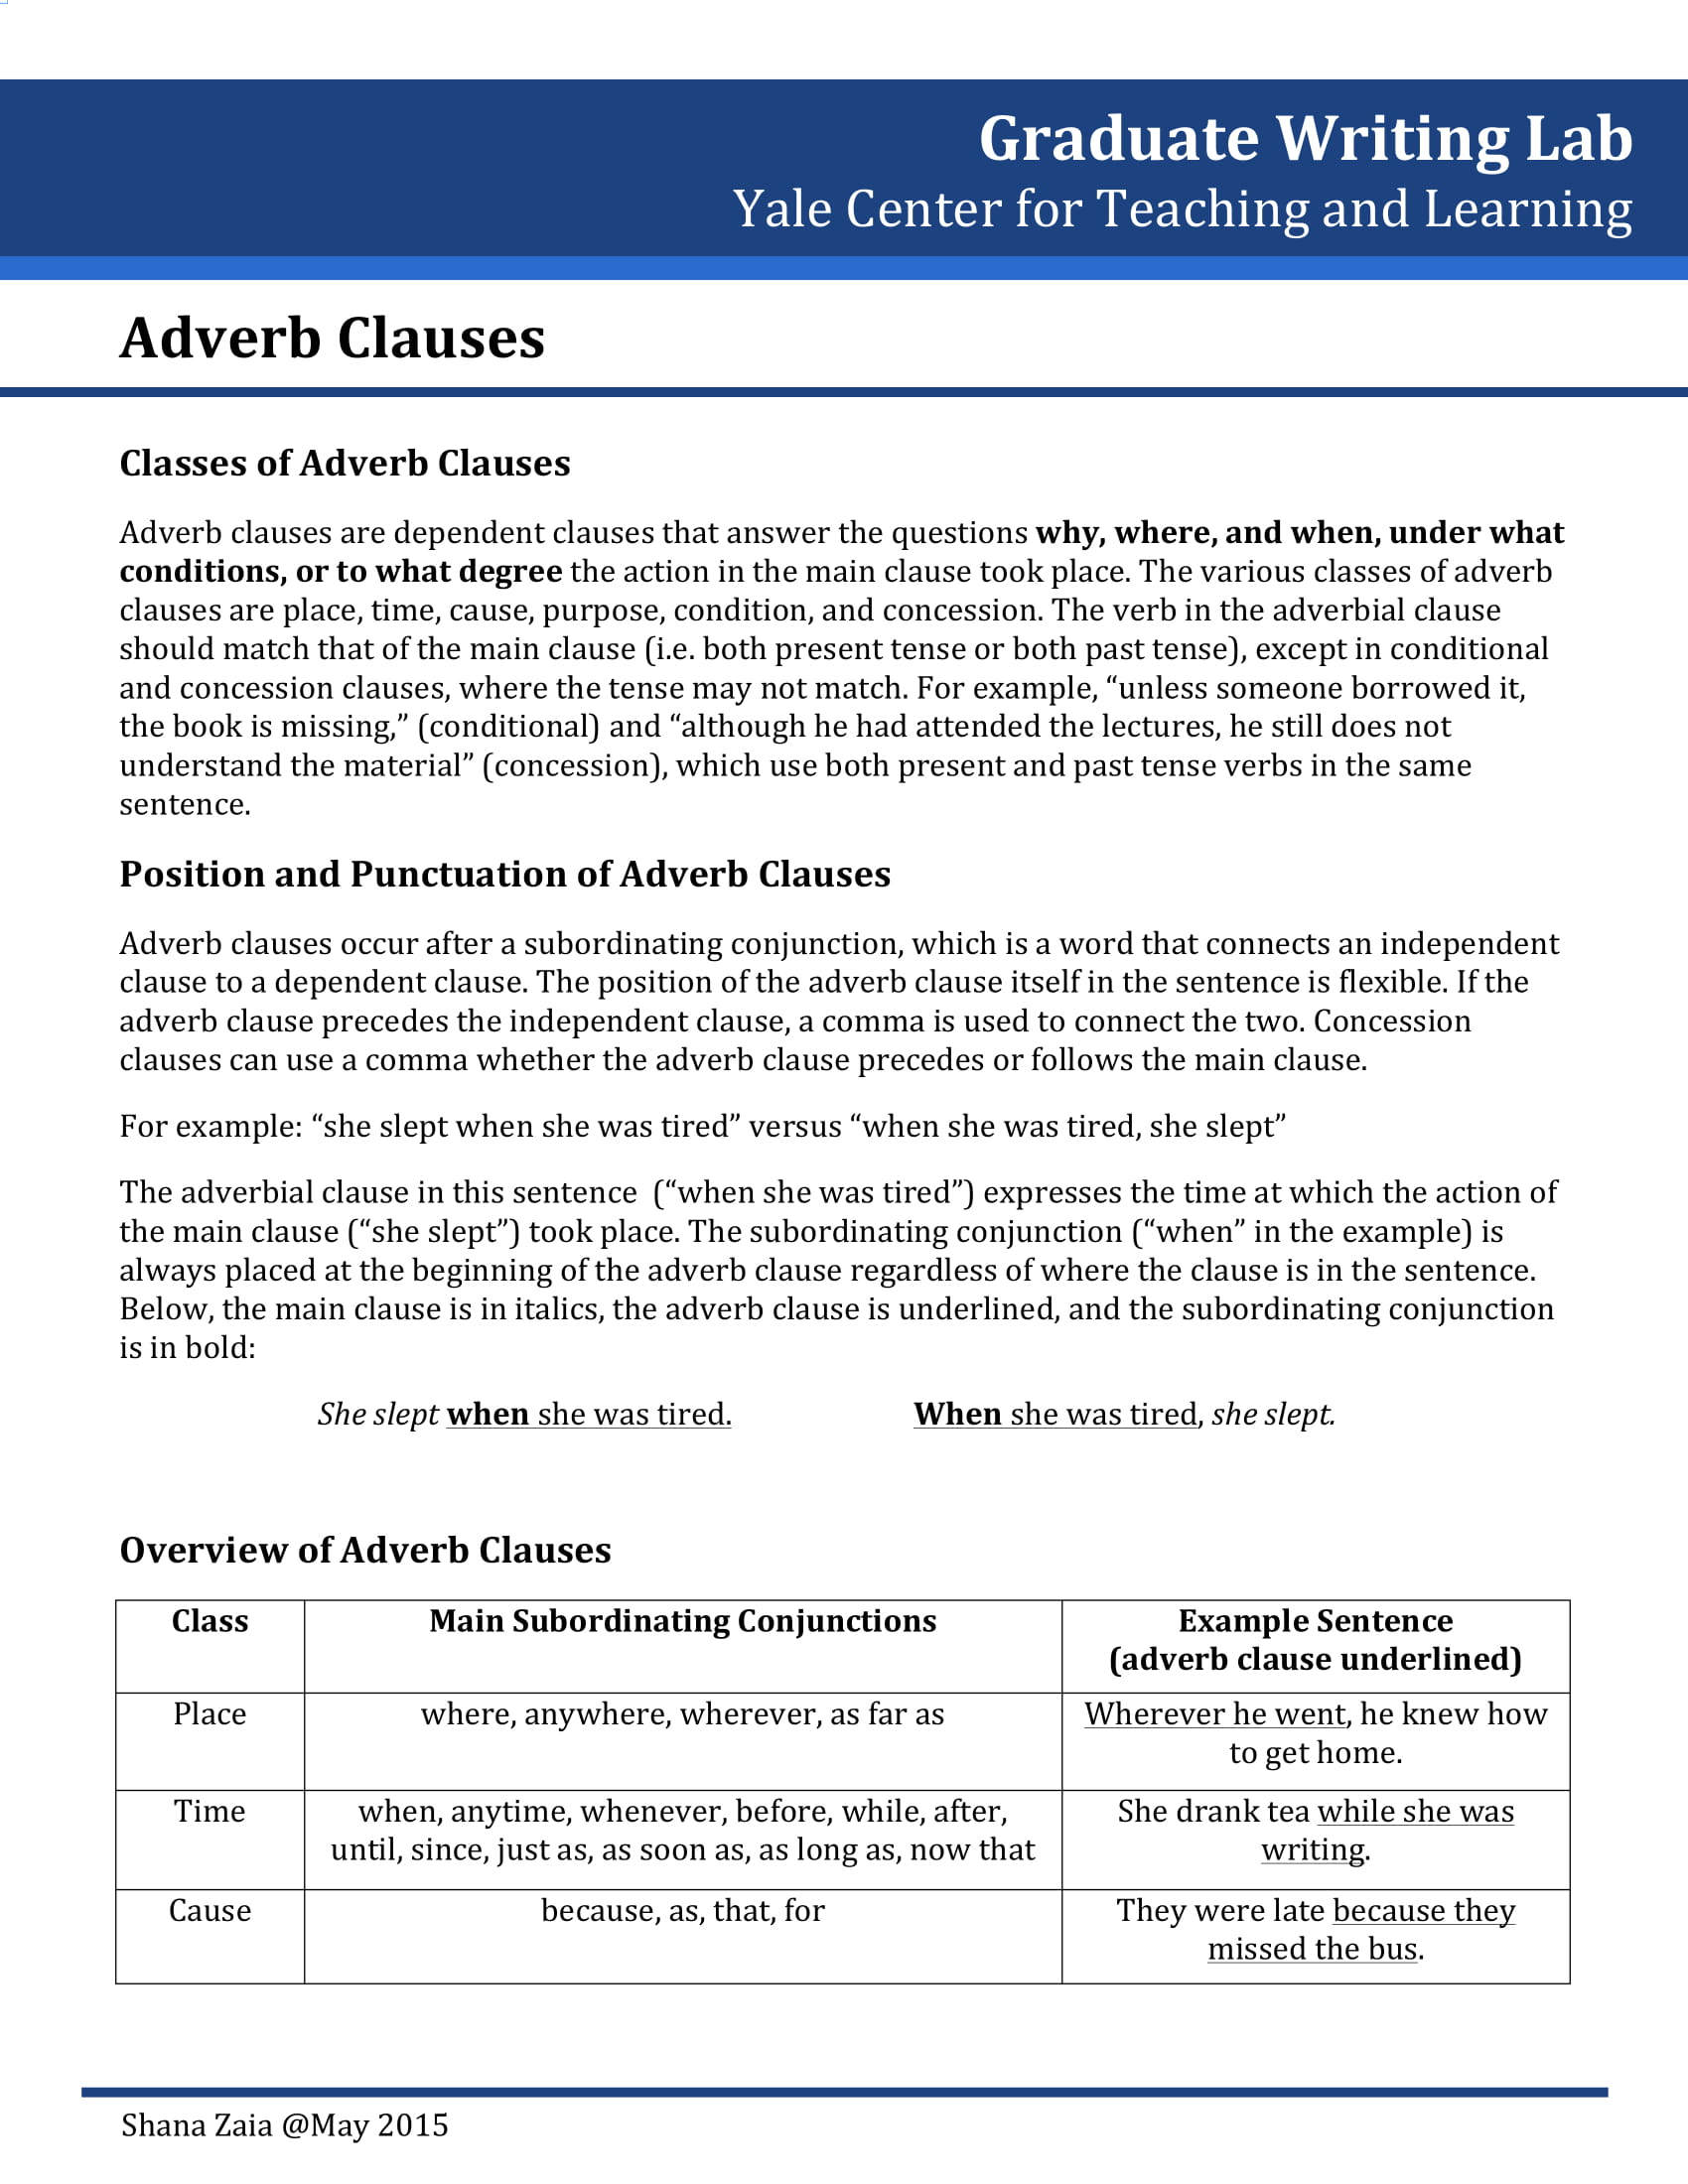
Adverb Clause Worksheet Example
Adverb Clause Guide Example
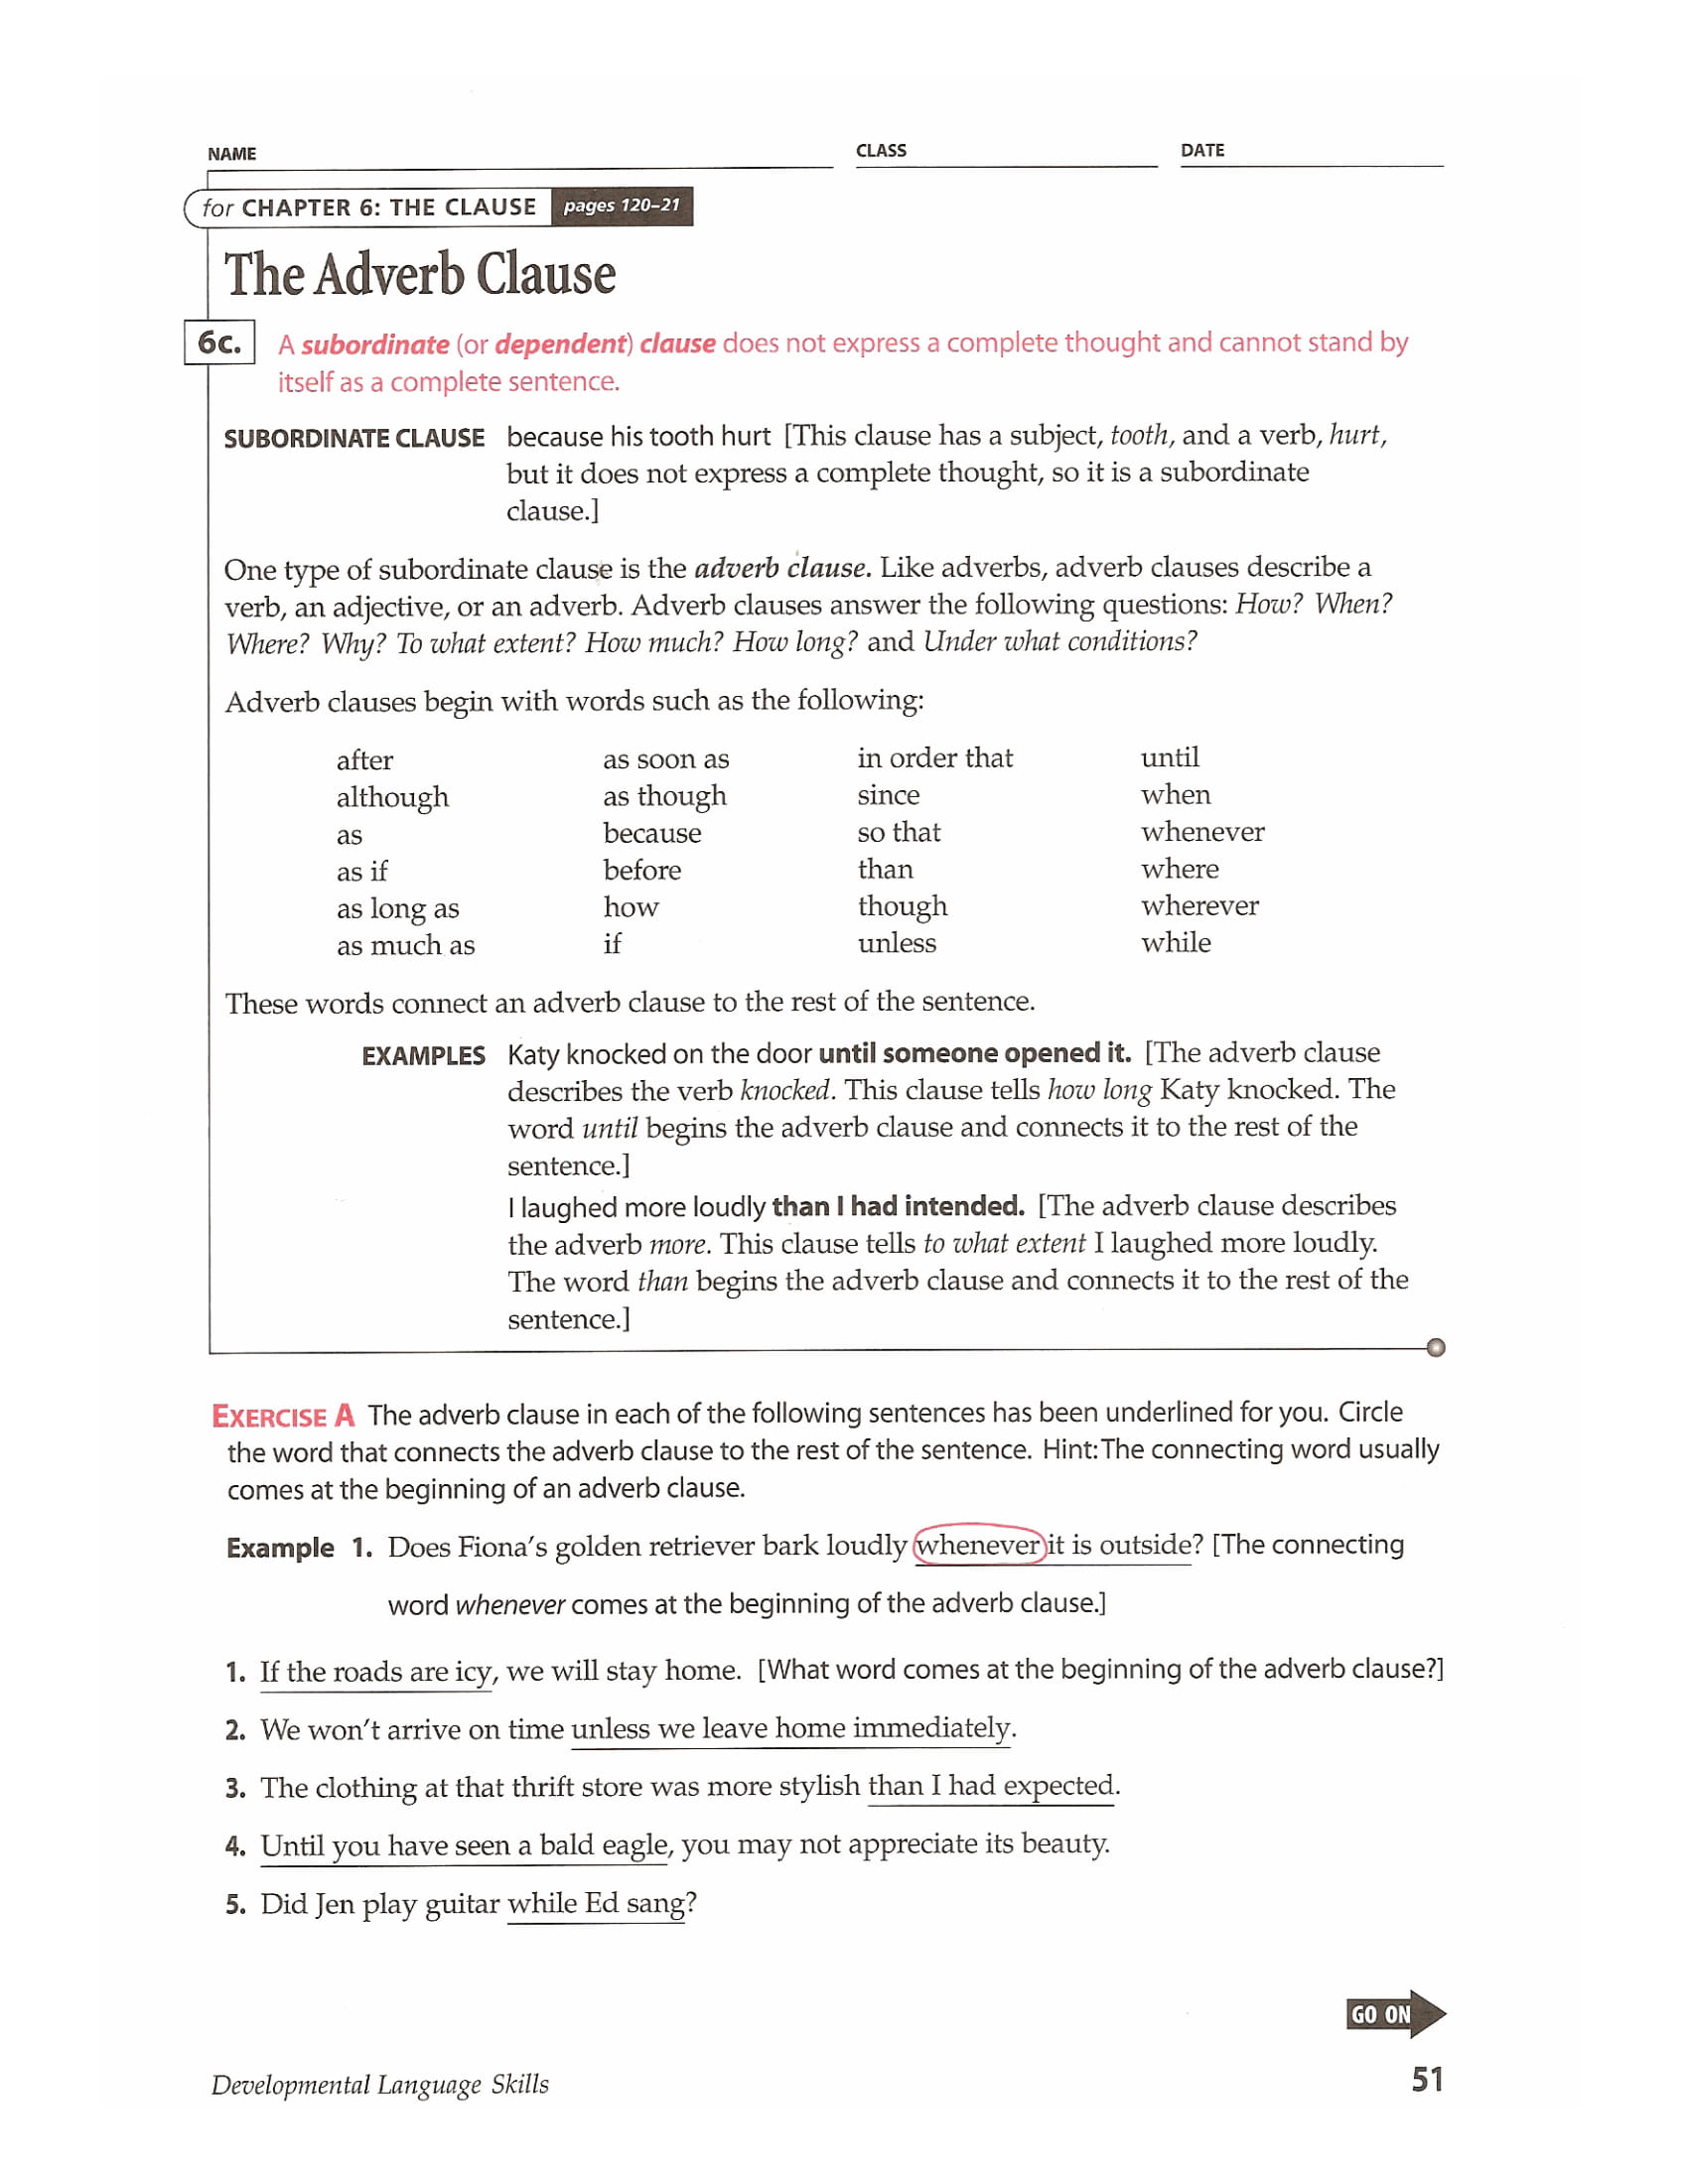
Adverb Clause Discussion and Worksheet Example
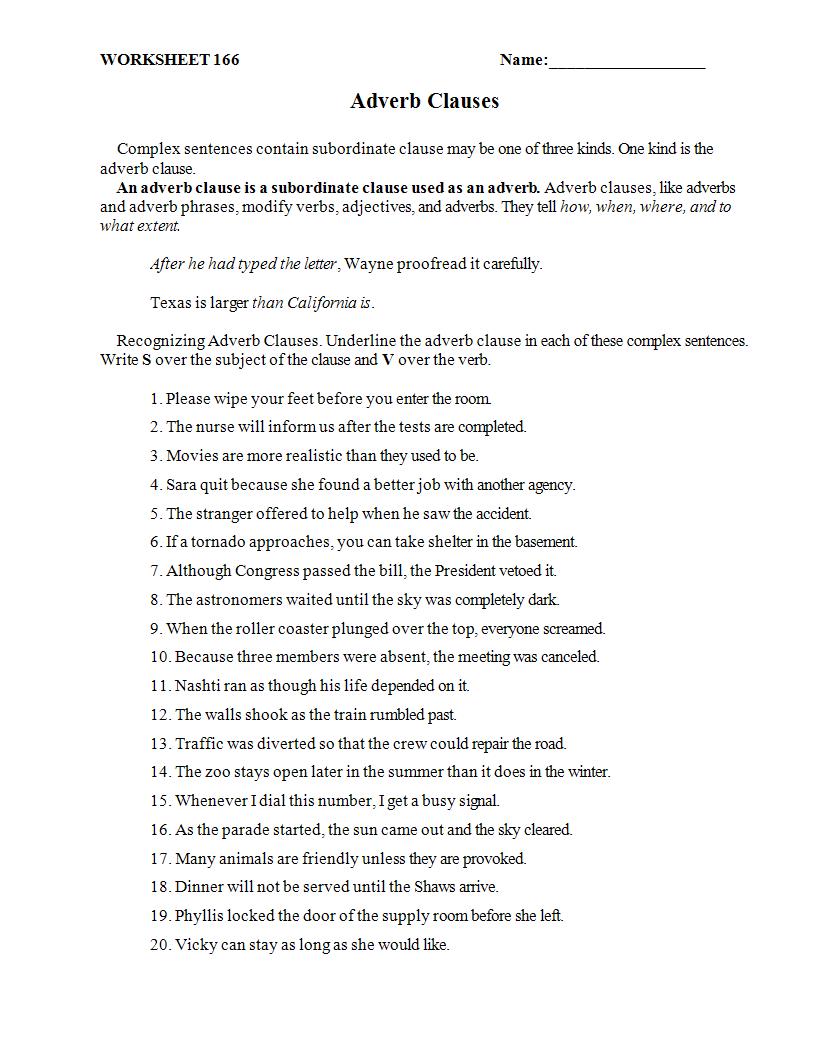
Printable Adverb Clause Worksheet Example
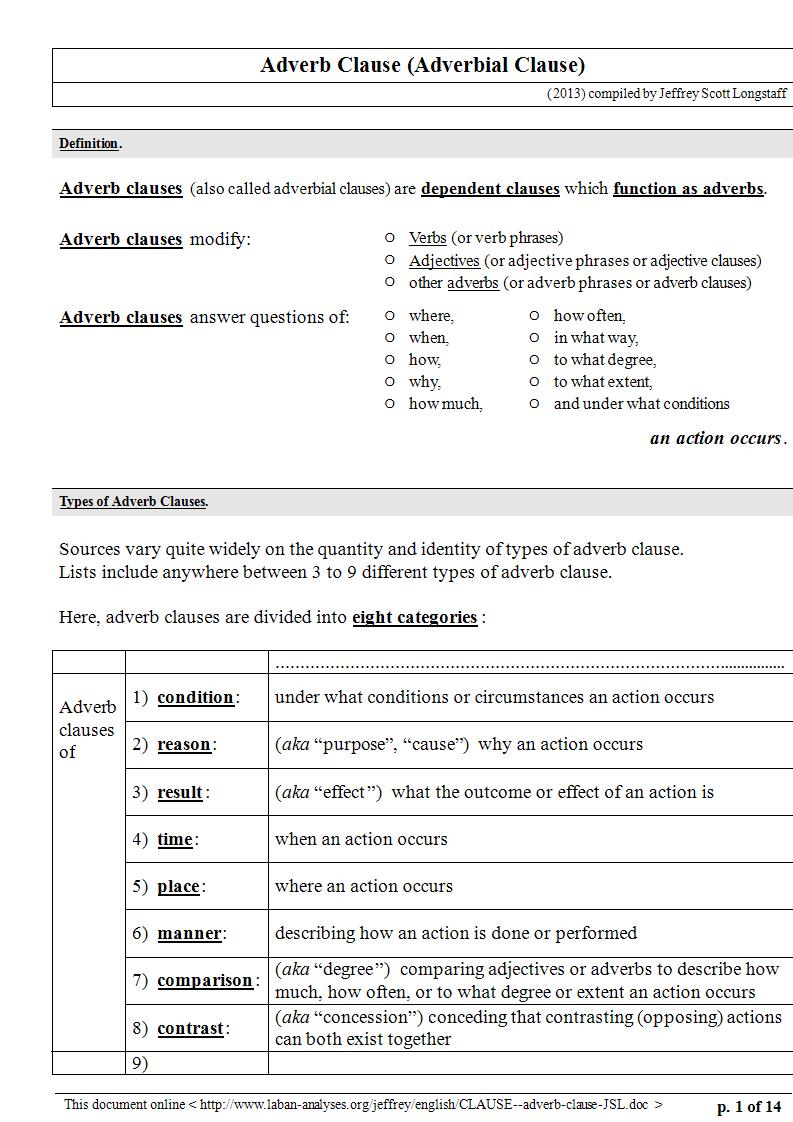
Adverb Clause Reference Sheet Example
Examples of an Adverb Clause
To help you better understand an adverb clause, here are various examples you can study and refer on:
- Tommy scrubbed the bathroom tile until his arms ached.
- Josephine’s three cats bolted from the driveway once they saw her car turn the corner.
- The missing eyeglasses are in the refrigerator, where Damien absentmindedly set them down while eating his roommate’s leftover fried rice.
- After her appointment at the orthodontist, Danielle cooked eggs for dinner because she could easily chew an omelet.
- Before she completed the cooking, the visitors had left.
- The thief froze as soon as he heard the sirens.
- She fell where the makeshift wooden bridge was weak.
- I will go wherever you go.
- The choir sang as though the heavens would fall.
- She performed so excellently that she got a scholarship.
- Because he has money, he believes he can get away with the crime.
- Set out on time lest you miss the bus.
- He was denied entrance as he could not pay the required fees.
- Whether she likes it or not, she must complete her education in Nigeria.
- There will be no need to go to court provided you sign the papers.
- They eat out every weekend though they have a cook.
- Though the kids are poor, they are very lively and happy.
- You need to shed off some weight lest you become obese.
- The ceremony was rounded off in order that attendees might get to their destinations on time.
- We work that we may earn and have to give.
Adverbial Clauses Notes Example
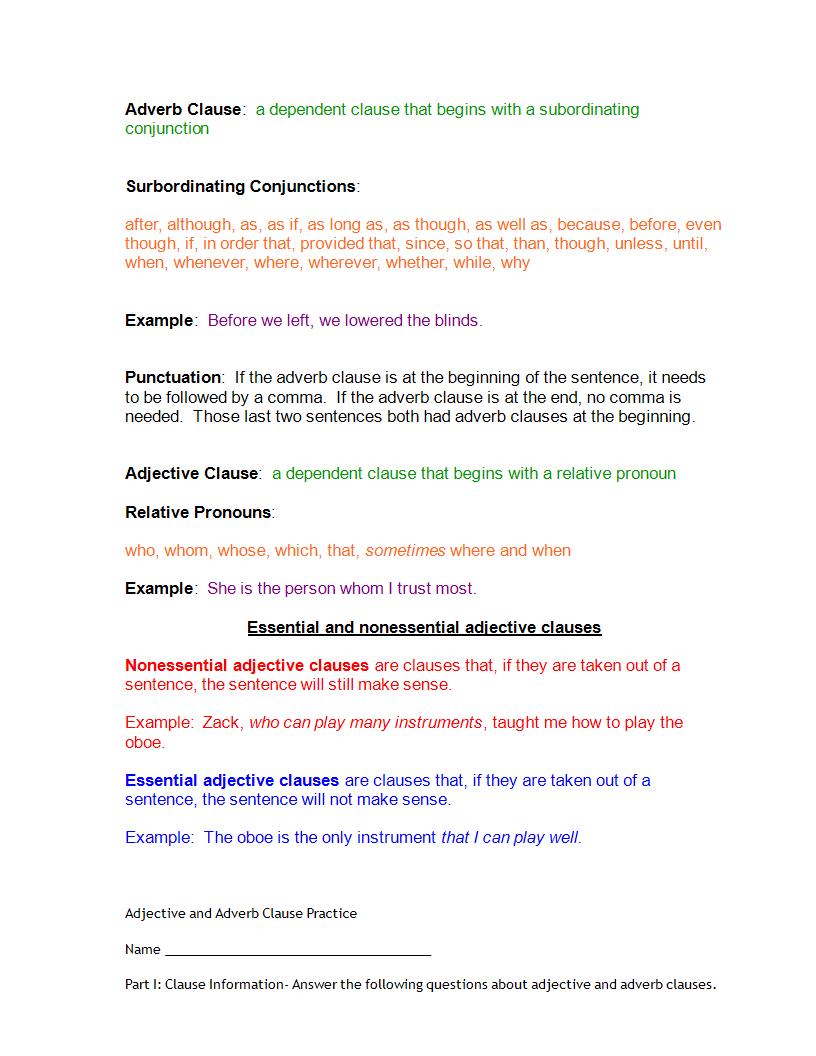
Adjective and Adverb Clause Notes and Worksheet Example
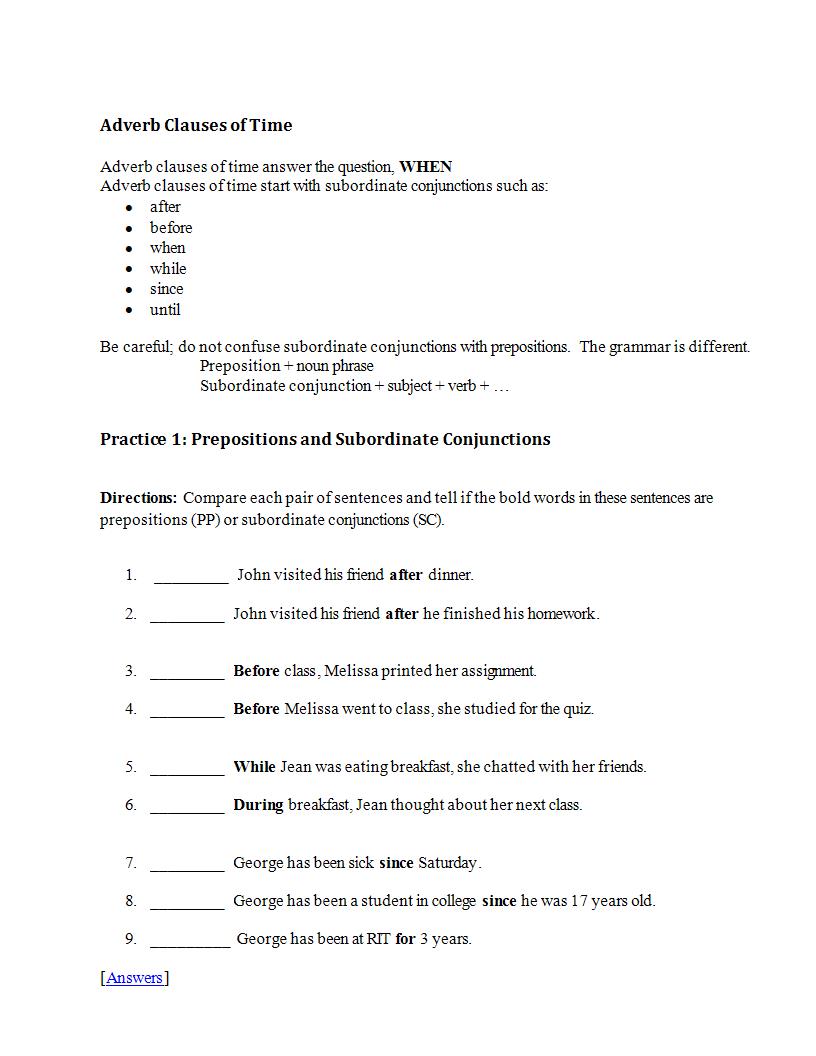
Adverb Clauses of Time Worksheet Example
How do you identify a Adverb clause in a sentence?
- Look for a Subordinating Conjunction: Adverb clauses typically begin with subordinating conjunctions like “because,” “if,” “when,” “although,” “since,” “as long as,” etc. These words introduce the clause and hint at the type of adverbial information it provides.
- Check for a Subject and Verb: Unlike phrases, clauses contain both a subject and a verb. Ensure the group of words you’re examining includes a subject (who or what the clause is about) and a predicate (what the subject is doing or what condition the subject is in).
- Identify the Clause’s Function: Adverb clauses function as adverbs, meaning they modify verbs, adjectives, or other adverbs. They provide information about time, place, reason, condition, manner, etc. Ask yourself what question the clause is answering about the main clause: When? Where? Why? How?
- Determine Dependency: Adverb clauses cannot stand alone as complete sentences; they are dependent clauses. If the group of words can’t make sense on its own and is providing additional information to another clause, it’s likely an adverb clause.
- Observe the Relationship: Adverb clauses show a relationship between the action in the main clause and the information in the adverb clause. This relationship is often one of time, reason, condition, or manner. Recognizing this relationship can help confirm you’ve identified an adverb clause.
- Check for Comma Usage: Often, adverb clauses are separated from the rest of the sentence by a comma, especially when they precede the main clause. While not a definitive identifier on its own, this punctuation can be a helpful hint.
- Examine the Placement in the Sentence: Adverb clauses can appear at the beginning, middle, or end of a sentence. The placement might change the emphasis but not the basic function of the clause. Seeing how the clause fits into the sentence structure can aid in identification.
FAQs
Example of an Adverb Clause for Kids
An adverb clause for kids could be: “After the bell rings, we go home.” This clause describes when we go home, providing a time context for the action.
Example of an Adjective Clause
An example of an adjective clause is: “The book that you lent me is fascinating.” This clause describes the book, specifying which one by mentioning it was lent by you.
10 Examples of Clauses with Answers
- “When it rains, the ground gets wet.” – Adverb clause of time
- “The man who lives next door is a doctor.” – Adjective clause
- “Because she was ill, she stayed home.” – Adverb clause of reason
- “I’ll see you where we met last time.” – Adverb clause of place
- “If you study hard, you will pass.” – Adverb clause of condition
- “The cake that she baked was delicious.” – Adjective clause
- “Although he was tired, he continued working.” – Adverb clause of concession
- “I work so that I can travel.” – Adverb clause of purpose
- “She speaks as if she knows everything.” – Adverb clause of manner
- “He ran faster than I could.” – Adverb clause of comparison
8 Types of Adverb Clause
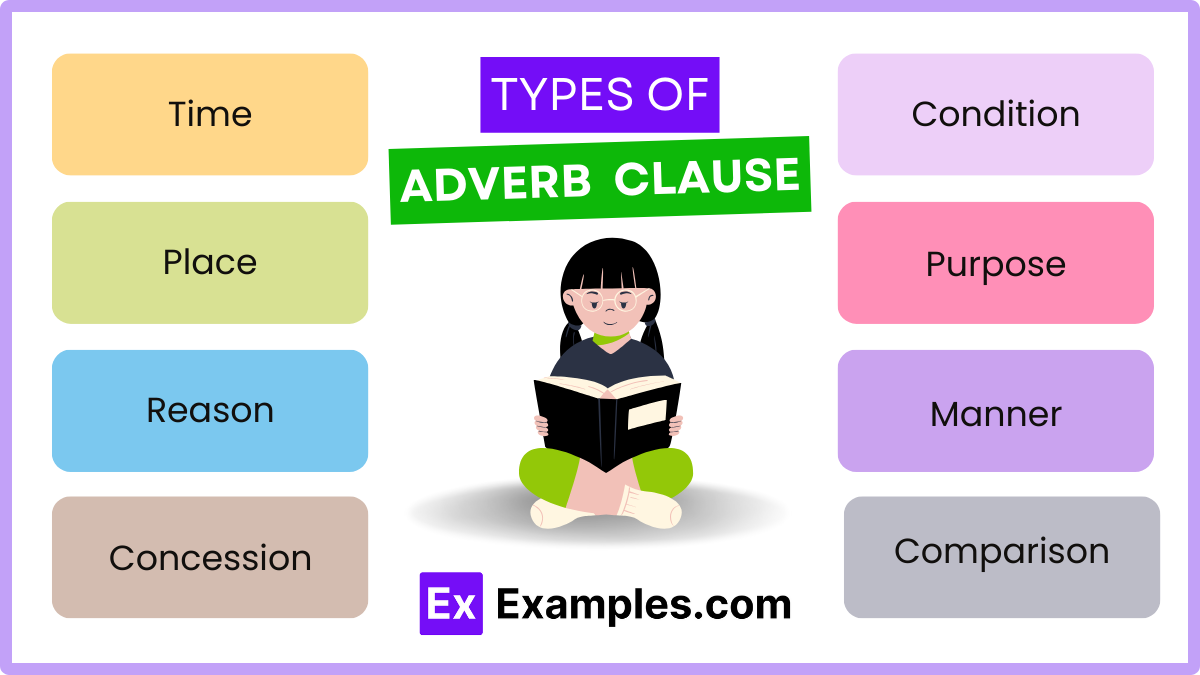
The 8 types of adverb clauses are:
- Time – Indicates when something happens.
- Place – Shows where something happens.
- Reason – Explains why something happens.
- Condition – Sets a condition for the main clause.
- Purpose – Indicates the purpose of an action.
- Manner – Describes how something is done.
- Concession – Expresses a contrast to the main idea.
- Comparison – Compares two actions or states.
7 Examples of Adverb of Time
- “Yesterday,” I went shopping.
- “Soon,” we will leave.
- “Later,” I will call you.
- “Initially,” he was reluctant.
- “Finally,” they arrived.
- “Occasionally,” we meet for coffee.
- “Frequently,” she visits the museum.
20 Examples of Adverbs of Place
- “Here” – Stay here.
- “There” – Look there.
- “Everywhere” – Snow was everywhere.
- “Anywhere” – You can sit anywhere.
- “Somewhere” – Let’s go somewhere quiet.
- “Inside” – They are inside.
- “Outside” – It’s cold outside.
- “Upstairs” – The office is upstairs.
- “Downstairs” – Meet me downstairs.
- “Nearby” – There’s a cafe nearby.
- “Far” – The station is far.
- “Away” – He walked away.
- “Back” – Come back soon.
- “Home” – She went home.
- “Abroad” – They love traveling abroad.
- “Out” – Let’s eat out.
- “In” – Come in, please.
- “Underneath” – It’s hidden underneath.
- “Above” – A bird flew above.
- “Behind” – The park is behind the building
In conclusion, learning about adverbial clauses is essential if you want to improve your overall communication skills. It will help you construct your sentences better that leads to you conveying and expressing your messages more clearly. Although you might get confused since it has a few similarities to other types of clauses, you need to remember that in the end it still functions as an adverb modifying an adjective, verb, or an adverb. It can also help you answer the 5 Ws and 1 H questions easily. We hope that this guide is of help to your learning process.