
The Chi-Square Test for Homogeneity

In AP Statistics, the Chi-Square Test for Homogeneity is a vital method used to compare the distribution of a categorical variable across multiple populations or groups. This test helps determine whether different populations share the same distribution for a particular categorical variable, such as preferences, opinions, or behaviors. By analyzing the differences between observed and expected frequencies in a contingency table, the test assesses whether any observed variation is due to random chance or a significant difference in distribution across the groups. It plays a crucial role in making informed conclusions about population similarities or differences in categorical data.
Learning Objectives
In learning about the Chi-Square Test for Homogeneity, you will be introduced to its purpose of comparing categorical distributions across different populations. You will be guided through the steps to conduct the test, including stating hypotheses, calculating expected frequencies, and determining the chi-square statistic. The assumptions and conditions required for the test will be examined, and you will gain the ability to interpret results to determine if population distributions differ significantly from one another.
Key Concepts
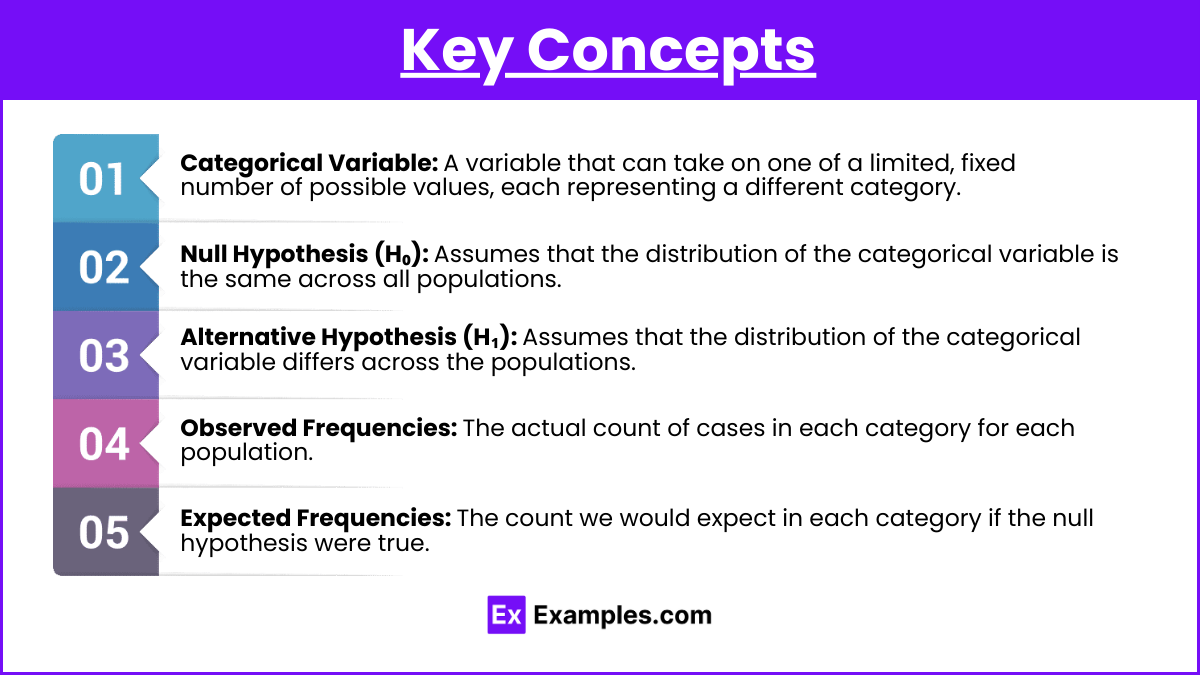
- Categorical Variable: A variable that can take on one of a limited, fixed number of possible values, each representing a different category.
- Null Hypothesis (H₀): Assumes that the distribution of the categorical variable is the same across all populations.
- Alternative Hypothesis (H₁): Assumes that the distribution of the categorical variable differs across the populations.
- Observed Frequencies: The actual count of cases in each category for each population.
- Expected Frequencies: The count we would expect in each category if the null hypothesis were true.
Steps to Perform the Chi-Square Test for Homogeneity
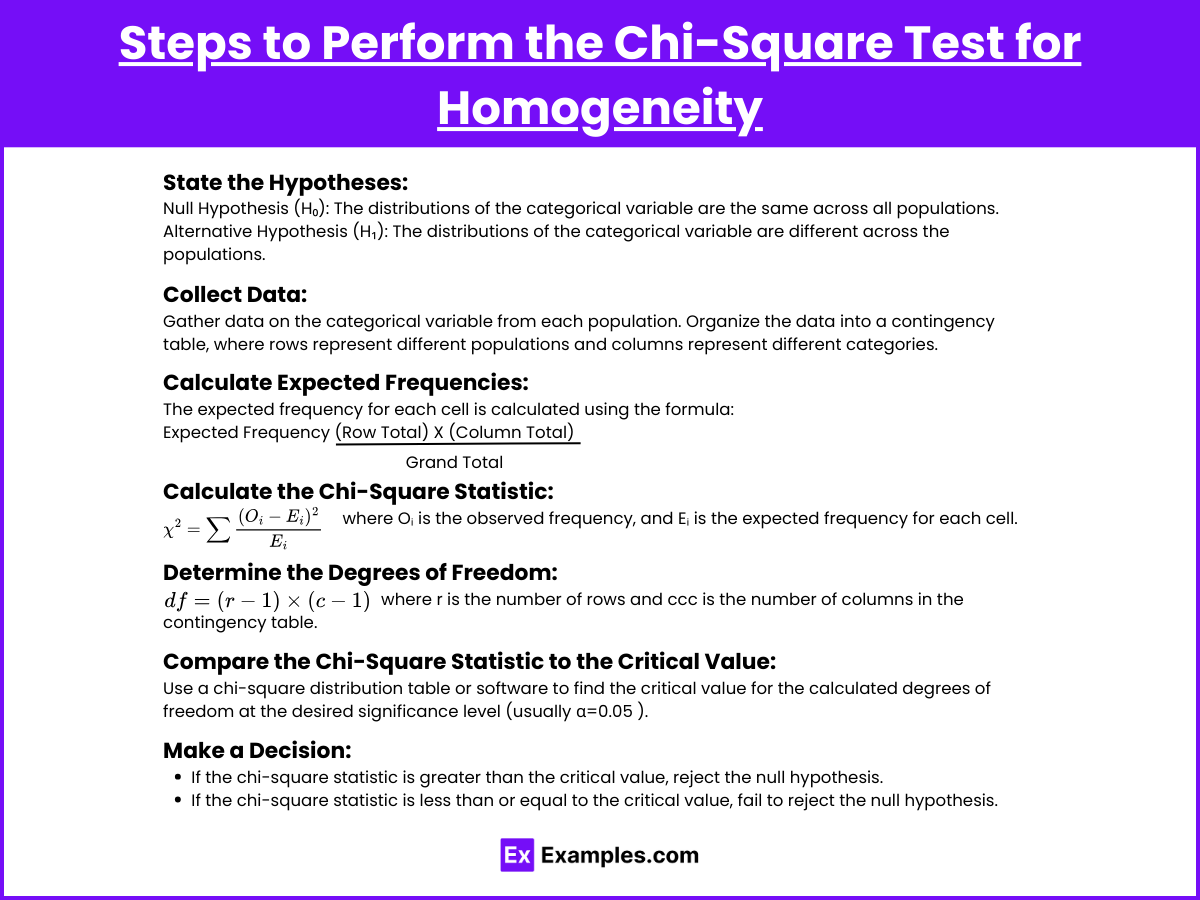
- State the Hypotheses:
- Null Hypothesis (H₀): The distributions of the categorical variable are the same across all populations.
- Alternative Hypothesis (H₁): The distributions of the categorical variable are different across the populations.
- Collect Data: Gather data on the categorical variable from each population. Organize the data into a contingency table, where rows represent different populations and columns represent different categories.
- Calculate Expected Frequencies:
- The expected frequency for each cell is calculated using the formula:

- Calculate the Chi-Square Statistic:
- Use the formula:
 where Oᵢ is the observed frequency, and Eᵢ is the expected frequency for each cell.
 - Determine the Degrees of Freedom:
- Degrees of freedom (df) for the test is calculated as:
 where r is the number of rows and ccc is the number of columns in the contingency table.
 - Compare the Chi-Square Statistic to the Critical Value:
- Use a chi-square distribution table or software to find the critical value for the calculated degrees of freedom at the desired significance level (usually α=0.05 ).
- Make a Decision:
- If the chi-square statistic is greater than the critical value, reject the null hypothesis.
- If the chi-square statistic is less than or equal to the critical value, fail to reject the null hypothesis.
Assumptions of the Chi-Square Test for Homogeneity
- The data are from independent random samples.
- The variable under study is categorical.
- The expected frequency for each cell should be at least 5.
Examples
Here are five examples that illustrate the application of the Chi-Square Test for Homogeneity:
Example 1: Comparing Favorite Sports Across Schools
Three high schools were surveyed to determine students’ favorite sports (Soccer, Basketball, and Baseball). The survey results are:
| Favorite Sport | School A | School B | School C |
|---|---|---|---|
| Soccer | 30 | 25 | 20 |
| Basketball | 40 | 35 | 30 |
| Baseball | 50 | 40 | 35 |
To determine whether the distribution of favorite sports is the same across all three schools, we use the Chi-Square Test for Homogeneity.
Example 2: Political Affiliation in Different Regions
A survey was conducted to compare political affiliations (Democrat, Republican, Independent) across three regions (North, South, West). The data are:
| Affiliation | North | South | West |
|---|---|---|---|
| Democrat | 150 | 130 | 110 |
| Republican | 140 | 120 | 130 |
| Independent | 110 | 150 | 160 |
We want to test if the distribution of political affiliation is homogeneous across the regions.
Example 3: Preference for Social Media Platforms Among Age Groups
A study was conducted to compare the preferences for social media platforms (Facebook, Twitter, Instagram) among three age groups (Teens, Adults, Seniors). The results are:
| Social Media Platform | Teens | Adults | Seniors |
|---|---|---|---|
| 50 | 60 | 70 | |
| 40 | 50 | 30 | |
| 60 | 40 | 20 |
We will use the Chi-Square Test for Homogeneity to see if social media platform preference is the same across different age groups.
Example 4: Customer Satisfaction Across Branches
A retail company wants to compare customer satisfaction (Satisfied, Neutral, Dissatisfied) across four different branches. The data collected are:
| Satisfaction Level | Branch 1 | Branch 2 | Branch 3 | Branch 4 |
|---|---|---|---|---|
| Satisfied | 80 | 75 | 90 | 85 |
| Neutral | 30 | 25 | 20 | 15 |
| Dissatisfied | 10 | 15 | 10 | 20 |
The Chi-Square Test for Homogeneity will help determine if customer satisfaction levels are consistent across all branches.
Example 5: Dietary Preference Among Different Groups
A nutrition survey was conducted to compare dietary preferences (Vegetarian, Non-Vegetarian, Vegan) among different groups (Athletes, Office Workers, Students). The results are:
| Dietary Preference | Athletes | Office Workers | Students |
|---|---|---|---|
| Vegetarian | 45 | 55 | 60 |
| Non-Vegetarian | 70 | 65 | 55 |
| Vegan | 35 | 30 | 25 |
The Chi-Square Test for Homogeneity will be used to check if dietary preferences are homogeneous across the groups.
Multiple Choice Questions (MCQs)
Question 1
A Chi-Square Test for Homogeneity is appropriate when you want to compare:
A) The relationship between two categorical variables in a single population.
B) The distribution of a single categorical variable across multiple populations.
C) The means of a continuous variable across multiple populations.
D) The proportion of a categorical variable within a single population.
Answer: B
Explanation: The Chi-Square Test for Homogeneity is used to compare the distribution of a categorical variable across different populations or groups.
Question 2
Which of the following is NOT an assumption of the Chi-Square Test for Homogeneity?
A) The data are from independent random samples.
B) The variable under study is continuous.
C) The expected frequency in each cell should be at least 5.
D) The populations being compared are independent.
Answer: B
Explanation: The Chi-Square Test for Homogeneity is used for categorical variables, not continuous variables.
Question 3
In a Chi-Square Test for Homogeneity, if the calculated Chi-Square statistic is less than the critical value from the Chi-Square distribution table, you should:
A) Reject the null hypothesis.
B) Fail to reject the null hypothesis.
C) Conclude that the distributions are different.
D) Increase the sample size.
Answer: B
Explanation: If the calculated Chi-Square statistic is less than the critical value, you fail to reject the null hypothesis, indicating that there is not enough evidence to conclude that the distributions are different.