In AP Statistics, the Chi-Square Test for Independence is a crucial tool used to determine whether there is a significant association between two categorical variables within a dataset. This non-parametric test helps students analyze and interpret data to assess if the distribution of one variable is independent of another, providing insights into potential relationships or associations. By comparing observed frequencies in a contingency table to expected frequencies, the Chi-Square Test allows for the evaluation of the null hypothesis that the variables are independent, offering a deeper understanding of data behavior in various real-world contexts.
Learning Objectives
In learning about the Chi-Square Test for Independence, you will be equipped with the ability to assess the association between two categorical variables. You will be guided through the process of setting up hypotheses, calculating expected frequencies, and computing the Chi-Square statistic. You will also be instructed on how to interpret the results to determine whether variables are independent. The importance of meeting the assumptions for this test will be emphasized to ensure accurate and meaningful conclusions.
What is the Chi-Square Test for Independence?
The Chi-Square Test for Independence evaluates whether two categorical variables are independent of each other. The null hypothesis (H₀) in this test states that the variables are independent, meaning that the distribution of one variable does not affect the distribution of the other. The alternative hypothesis (Hₐ) posits that the variables are not independent, indicating a relationship between them.
When to Use the Chi-Square Test for Independence

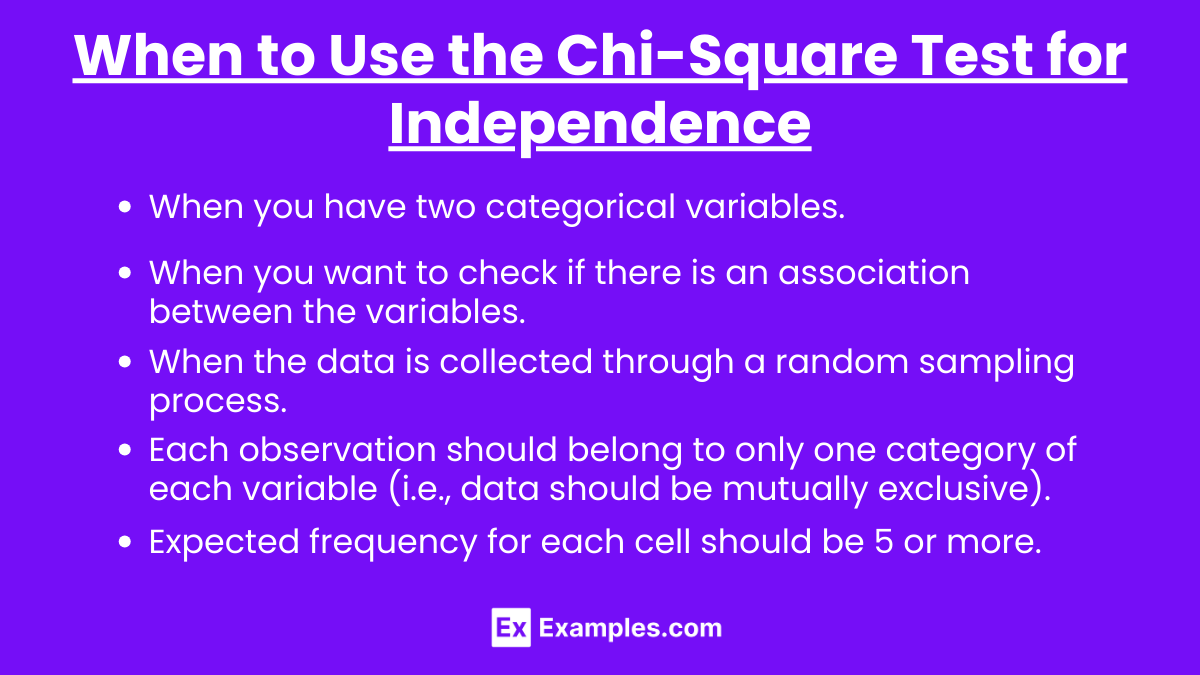
When you have two categorical variables.
When you want to check if there is an association between the variables.
When the data is collected through a random sampling process.
Each observation should belong to only one category of each variable (i.e., data should be mutually exclusive).
Expected frequency for each cell should be 5 or more.
Hypotheses in the Chi-Square Test for Independence
Null Hypothesis (H₀): The two variables are independent (no association between them).
Alternative Hypothesis (Hₐ): The two variables are not independent (an association exists between them).
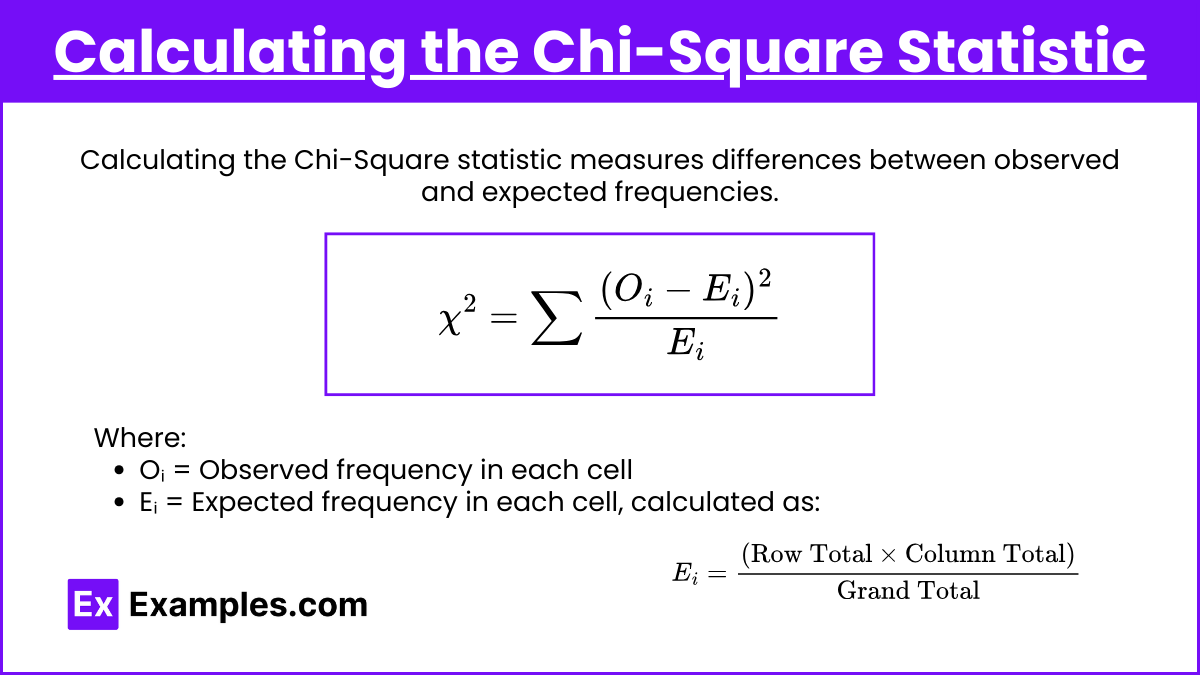
Calculating the Chi-Square Statistic

The Chi-Square statistic is calculated using the formula:
Where:
Oᵢ = Observed frequency in each cell
Eᵢ = Expected frequency in each cell, calculated as:
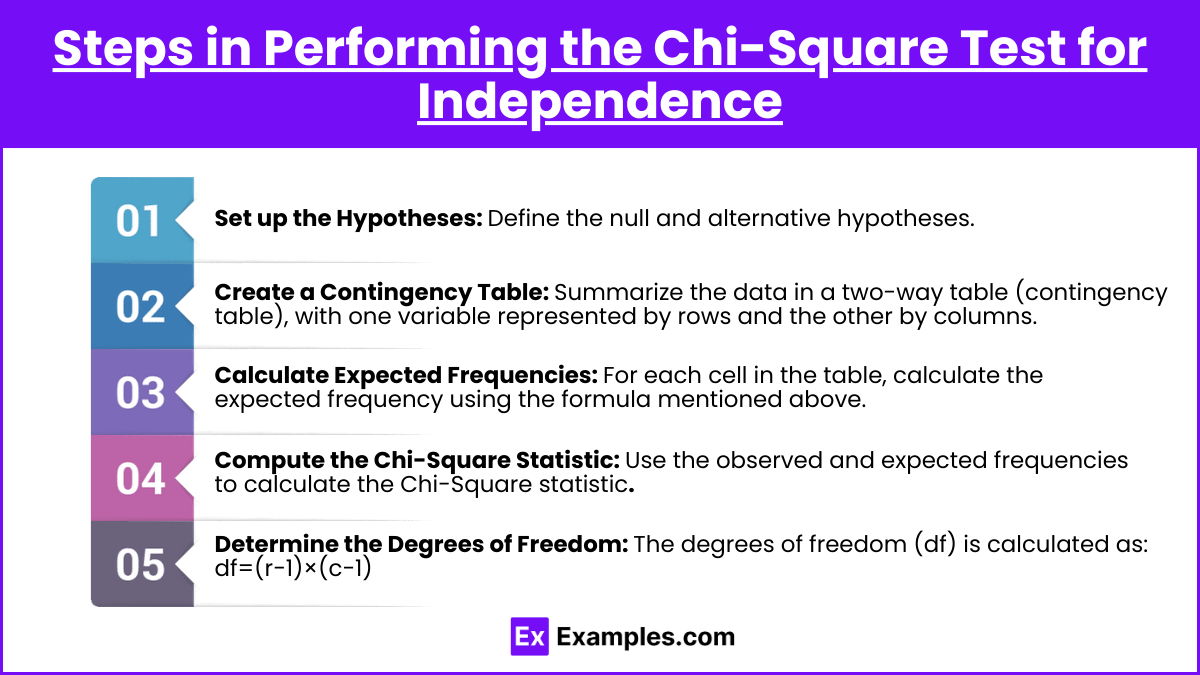
Steps in Performing the Chi-Square Test for Independence

Set up the Hypotheses: Define the null and alternative hypotheses.
Create a Contingency Table: Summarize the data in a two-way table (contingency table), with one variable represented by rows and the other by columns.
Calculate Expected Frequencies: For each cell in the table, calculate the expected frequency using the formula mentioned above.
Compute the Chi-Square Statistic: Use the observed and expected frequencies to calculate the Chi-Square statistic.
Determine the Degrees of Freedom: The degrees of freedom (df) is calculated as:
df=(r−1)×(c−1)
Where r is the number of rows and ccc is the number of columns.
Find the Critical Value or P-value: Compare the Chi-Square statistic to the critical value from the Chi-Square distribution table or calculate the p-value.
Make a Decision: If the Chi-Square statistic is greater than the critical value or if the p-value is less than the significance level (α), reject the null hypothesis.
Assumptions of the Chi-Square Test for Independence
Independence: Observations should be independent of each other.
Size of Expected Frequencies: Expected frequencies in each cell should be at least 5.
Random Sampling: Data should be collected randomly.
Examples
Example 1: Gender and Preferred Beverage
A survey is conducted to find out if there is an association between gender and preferred beverage choice among a group of people.
Preferred Beverage | Male | Female | Total |
|---|---|---|---|
Coffee | 20 | 30 | 50 |
Tea | 15 | 35 | 50 |
Juice | 25 | 20 | 45 |
Total | 60 | 85 | 145 |
Solution:
Hypotheses:
H₀: Gender and preferred beverage choice are independent.
Hₐ: Gender and preferred beverage choice are not independent.
Expected Frequency Calculation:
For example, expected frequency for Male choosing Coffee:
Chi-Square Calculation:
For each cell, calculate and sum them up.
Conclusion:
Compare the value with the critical value at a 0.05 significance level with df=2.
Example 2: Education Level and Voting Preference
A study examines the relationship between education level and voting preference in a recent election.
Voting Preference | High School | Bachelor's | Master's | Total |
|---|---|---|---|---|
Candidate A | 40 | 50 | 30 | 120 |
Candidate B | 30 | 70 | 50 | 150 |
Candidate C | 20 | 40 | 30 | 90 |
Total | 90 | 160 | 110 | 360 |
Solution: Follow the same steps as in Example 1 to determine if there is an association between education level and voting preference.
Example 3: Age Group and Online Shopping Preference
An online retailer wants to know if age group is associated with a preference for shopping online or in-store.
Shopping Preference | 18-25 | 26-35 | 36-45 | Total |
|---|---|---|---|---|
Online | 50 | 60 | 30 | 140 |
In-Store | 20 | 40 | 50 | 110 |
Total | 70 | 100 | 80 | 250 |
Solution: Perform the Chi-Square Test to check for independence between age group and shopping preference.
Example 4: Smoking and Lung Disease
A health survey checks if there is an association between smoking habits and the occurrence of lung disease.
Lung Disease | Smoker | Non-Smoker | Total |
|---|---|---|---|
Yes | 30 | 10 | 40 |
No | 20 | 40 | 60 |
Total | 50 | 50 | 100 |
Solution: Apply the Chi-Square Test to assess the relationship between smoking and lung disease.
Example 5: Marital Status and Pet Ownership
A study is conducted to find out if marital status affects the likelihood of owning a pet.
Pet Ownership | Married | Single | Divorced | Total |
|---|---|---|---|---|
Yes | 60 | 30 | 10 | 100 |
No | 40 | 20 | 10 | 70 |
Total | 100 | 50 | 20 | 170 |
Solution: Use the Chi-Square Test for Independence to determine if there is a significant association between marital status and pet ownership.
Multiple-Choice Questions (MCQs)
1. The Chi-Square Test for Independence is used to determine:
a) The difference between the means of two populations
b) The association between two categorical variables
c) The variance of a population
d) The correlation between two continuous variables
Answer: b) The association between two categorical variables
Explanation: The Chi-Square Test for Independence specifically tests whether there is a significant association between two categorical variables.
2. Which of the following is NOT an assumption of the Chi-Square Test for Independence?
a) The sample data must be randomly selected.
b) The expected frequency in each cell should be at least 5.
c) The variables must be measured on an interval or ratio scale.
d) Observations must be independent of each other.
Answer: c) The variables must be measured on an interval or ratio scale.
Explanation: The Chi-Square Test for Independence is used for categorical variables, not for interval or ratio scales.
3. If the Chi-Square statistic is greater than the critical value, you should:
a) Accept the null hypothesis
b) Reject the null hypothesis
c) Accept the alternative hypothesis
d) Increase the sample size
Answer: b) Reject the null hypothesis
Explanation: If the Chi-Square statistic exceeds the critical value, it indicates that the observed data significantly differ from the expected data, leading to the rejection of the null hypothesis.


