
The Normal Distribution

In AP Statistics, the normal distribution is a crucial concept, often referred to as the “bell curve” due to its symmetrical shape. It is essential for understanding many statistical methods and theories. This topic covers the properties of the normal distribution, the standard normal distribution, and the use of Z-scores. Mastering the normal distribution helps in calculating probabilities, describing data distributions, and making inferences about populations, which are key skills for success in the AP Statistics exam.
Learning Objectives
By studying the normal distribution, you will learn to understand its properties, including its symmetrical shape and the Empirical Rule. You will master calculating and interpreting Z-scores, using Z-tables to find probabilities, and converting between Z-scores and data points. These skills will enable you to describe data distributions accurately and make informed inferences about populations, which are essential for success in the AP Statistics exam.
Definition and Properties
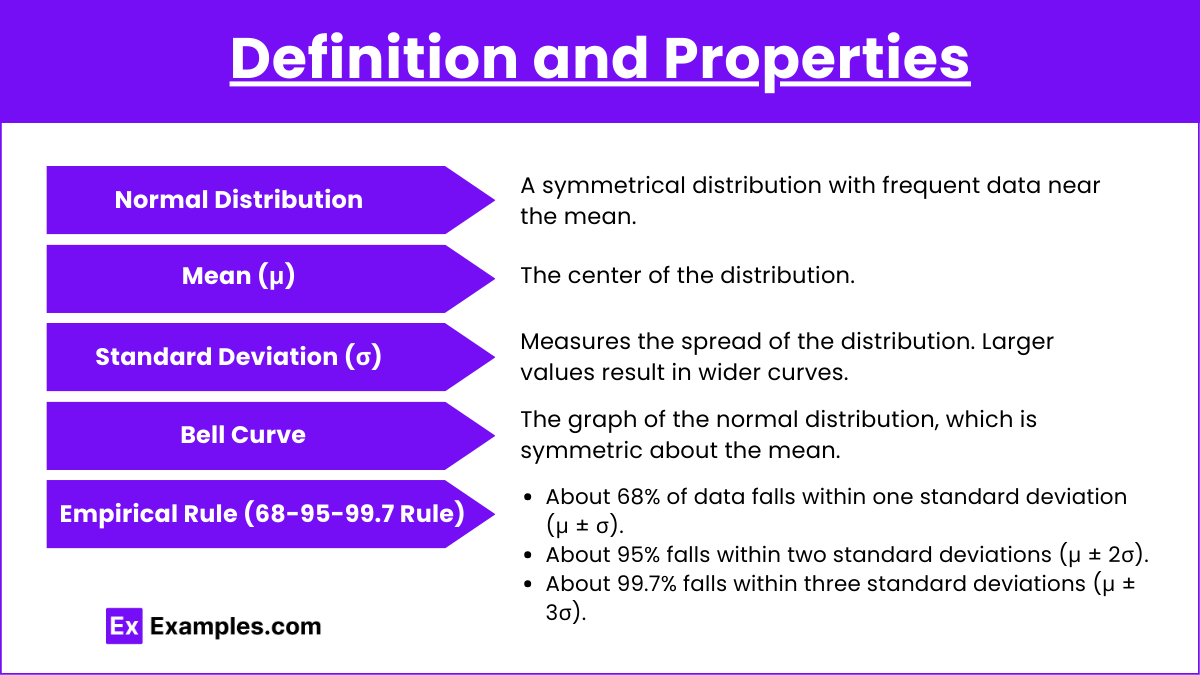
- Normal Distribution: A continuous probability distribution that is symmetrical around its mean, with data near the mean more frequent in occurrence than data far from the mean.
- Mean (μ): The center of the distribution.
- Standard Deviation (σ): Measures the spread of the distribution. Larger values result in wider curves.
- Bell Curve: The graph of the normal distribution, which is symmetric about the mean.
- Empirical Rule (68-95-99.7 Rule):
- About 68% of data falls within one standard deviation (μ ± σ).
- About 95% falls within two standard deviations (μ ± 2σ).
- About 99.7% falls within three standard deviations (μ ± 3σ).
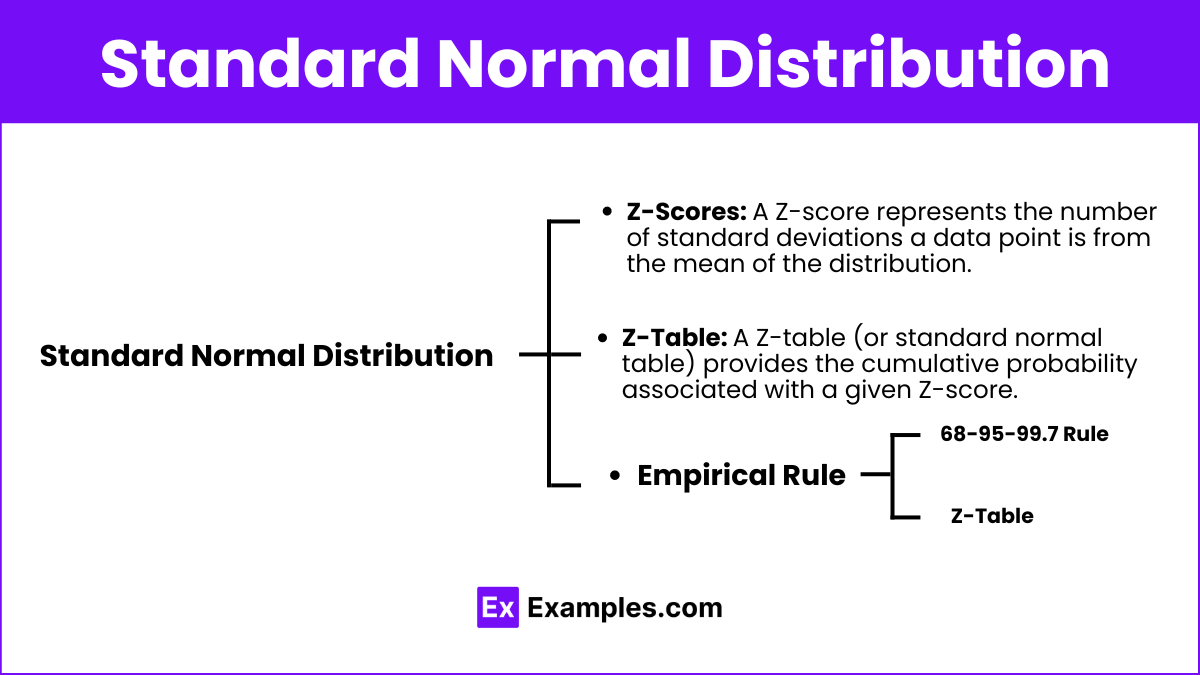
Standard Normal Distribution
Z-Scores
- Definition: A Z-score represents the number of standard deviations a data point is from the mean of the distribution.
- Formula:Z=X−μσZ = \frac{X – \mu}{\sigma}Z=σX−μSince the mean (μ) is 0 and the standard deviation (σ) is 1 in a standard normal distribution, the formula simplifies to:Z=XZ = XZ=X
- Usage: Z-scores are used to standardize individual data points and compare them across different distributions.
Z-Table
- Purpose: A Z-table (or standard normal table) provides the cumulative probability associated with a given Z-score.
- Interpretation: The table shows the area (probability) to the left of a specified Z-score on the standard normal distribution curve.
Empirical Rule
- 68-95-99.7 Rule: In the standard normal distribution:
- Approximately 68% of data falls within 1 standard deviation of the mean (between Z = -1 and Z = 1).
- Approximately 95% of data falls within 2 standard deviations of the mean (between Z = -2 and Z = 2).
- Approximately 99.7% of data falls within 3 standard deviations of the mean (between Z = -3 and Z = 3)
- Z-Table: A table that provides the area (probability) to the left of a given Z-score in the standard normal distribution.
Properties and Uses
- Symmetry: The normal distribution is symmetric about the mean.
- Asymptotic: The tails of the curve approach the x-axis but never touch it.
- Area Under the Curve: The total area under the normal distribution curve is 1, representing the total probability.
Examples
Example 1: Calculating Z-Score
- Data: X = 85, μ = 80, σ = 5
- Calculation: Z =
![\[\frac{85 - 80}{5} = 1\]](https://www.examples.com/wp-content/ql-cache/quicklatex.com-41a1126f8760b07f1f81542d0c22fd84_l3.png "Rendered by QuickLaTeX.com")
- The Z-score is 1, meaning the data point is one standard deviation above the mean.
Example 2: Using the Empirical Rule
- Data: Mean (μ) = 100, Standard Deviation (σ) = 15
- Analysis:
- 68% of the data falls between 85 and 115 (100 ± 15).
- 95% falls between 70 and 130 (100 ± 30).
- 99.7% falls between 55 and 145 (100 ± 45).
Example 3: Finding Probability Using Z-Table
- Data: Z = 1.25
- Analysis: Look up Z = 1.25 in the Z-table.
- The table value is 0.8944.
- This means 89.44% of the data is to the left of Z = 1.25.
Example 4: Converting a Z-Score to a Data Point
- Data: Z = 2, μ = 50, σ = 10
- Calculation: X=μ+Zσ=50+2(10)=70X = μ + Zσ = 50 + 2(10) = 70X=μ+Zσ=50+2(10)=70
- The data point corresponding to Z = 2 is 70.
Example 5: Determining Percentiles
- Data: Mean (μ) = 200, Standard Deviation (σ) = 20
- Analysis: Find the 90th percentile.
- The Z-score for the 90th percentile is approximately 1.28 (from Z-table).
- Convert Z-score to a data point: X=μ+Zσ=200+1.28(20)=225.6X = μ + Zσ = 200 + 1.28(20) = 225.6X=μ+Zσ=200+1.28(20)=225.6
- The 90th percentile is 225.6.
Multiple Choice Questions
Question 1: What percentage of data falls within two standard deviations of the mean in a normal distribution?
A. 68%
B. 95%
C. 99.7%
D. 100%
Answer: B. 95%
Explanation: According to the Empirical Rule, about 95% of data falls within two standard deviations of the mean in a normal distribution.
Question 2: If a data point has a Z-score of -2, what does this mean?
A. The data point is two standard deviations above the mean.
B. The data point is two standard deviations below the mean.
C. The data point is at the mean.
D. The data point is two units below the mean.
Answer: B. The data point is two standard deviations below the mean.
Explanation: A Z-score of -2 indicates that the data point is two standard deviations below the mean.
Question 3: In a standard normal distribution, what is the area to the left of a Z-score of 0?
A. 0
B. 0.25
C. 0.5
D. 1
Answer: C. 0.5
Explanation: In a standard normal distribution, the Z-score of 0 corresponds to the mean, and the area to the left of the mean is 0.5 (or 50%)