
Using Simulation to Estimate Probabilities

In AP Statistics, using simulation to estimate probabilities is an essential technique for understanding complex scenarios where theoretical methods may be impractical. Simulations model real-world processes by generating random outcomes, allowing students to approximate probabilities and analyze random behavior effectively. This approach is crucial for solving problems in various fields such as risk analysis, operational research, and everyday decision-making, enhancing students’ ability to interpret and utilize data accurately in diverse contexts.
Learning Objectives
By studying the use of simulation to estimate probabilities in AP Statistics, you will learn to model real-world processes using random numbers, approximate probabilities, and analyze complex scenarios effectively. You will gain the ability to define problems, develop models, generate random outcomes, and interpret results. This knowledge will enhance your understanding of random behavior and improve your decision-making skills in various fields, including risk analysis and operational research.
Definition of Simulation
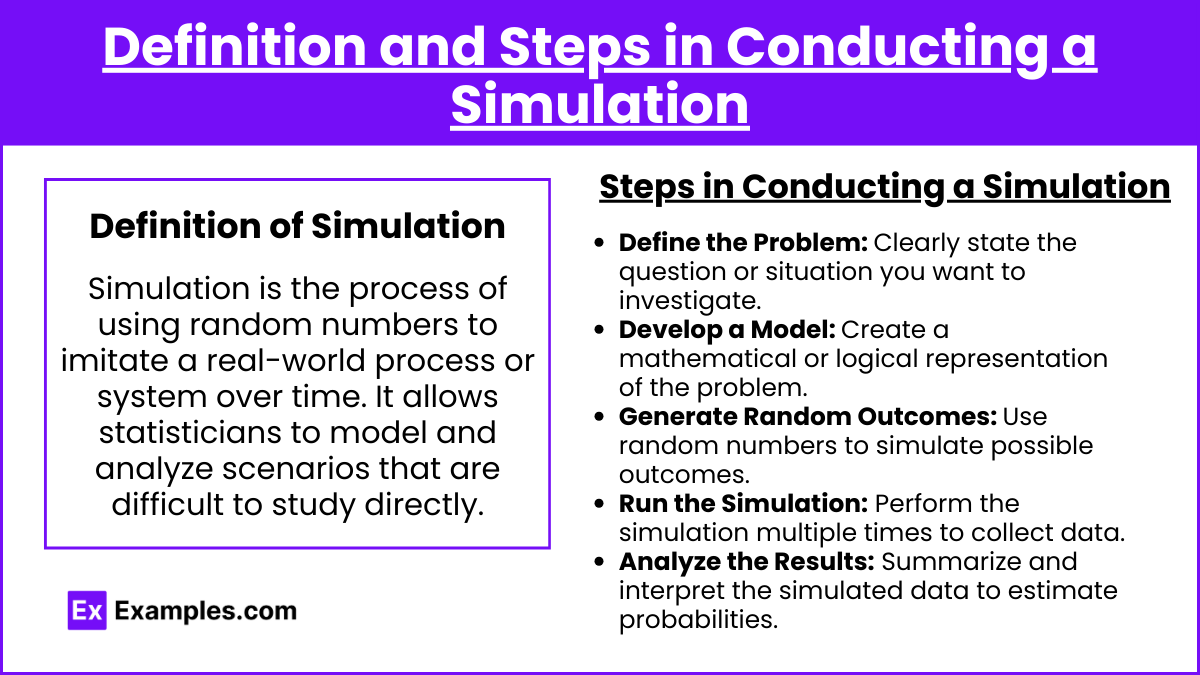
Simulation is the process of using random numbers to imitate a real-world process or system over time. It allows statisticians to model and analyze scenarios that are difficult to study directly.
Steps in Conducting a Simulation
- Define the Problem: Clearly state the question or situation you want to investigate.
- Develop a Model: Create a mathematical or logical representation of the problem.
- Generate Random Outcomes: Use random numbers to simulate possible outcomes.
- Run the Simulation: Perform the simulation multiple times to collect data.
- Analyze the Results: Summarize and interpret the simulated data to estimate probabilities.
Tools for Simulation
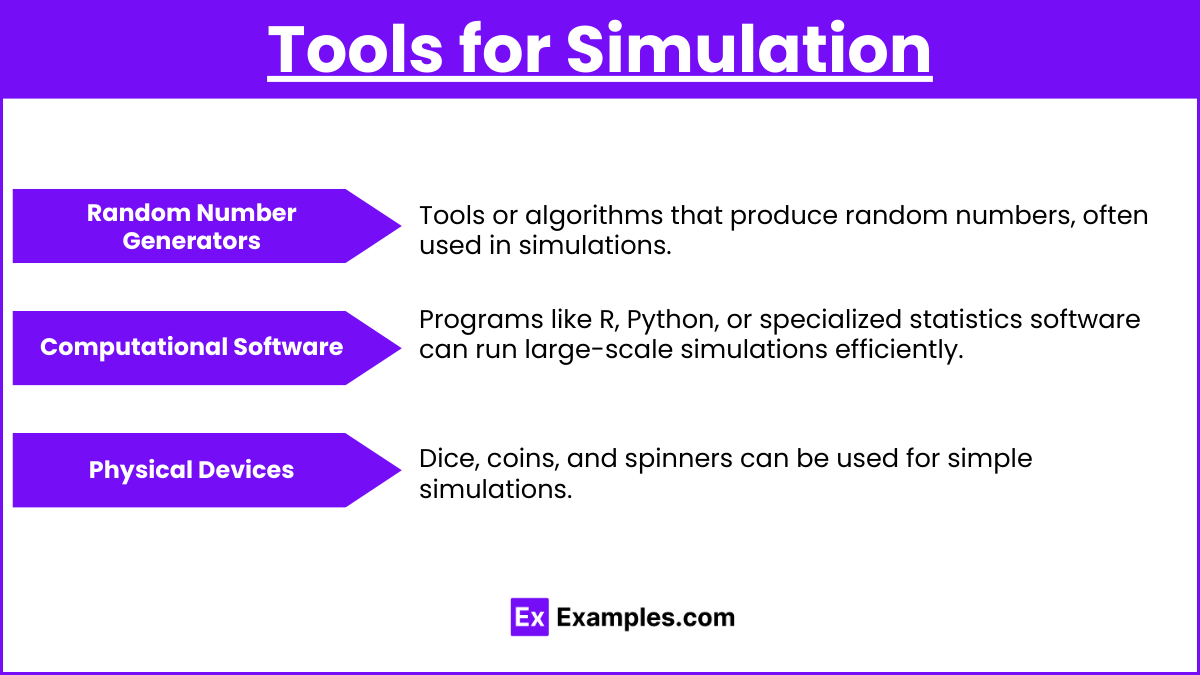
- Random Number Generators: Tools or algorithms that produce random numbers, often used in simulations.
- Computational Software: Programs like R, Python, or specialized statistics software can run large-scale simulations efficiently.
- Physical Devices: Dice, coins, and spinners can be used for simple simulations.
Applications of Simulation
- Estimating Probabilities: Approximate the likelihood of events in complex scenarios.
- Risk Analysis: Assess the probability of various risks in finance, engineering, and other fields.
- Operational Research: Optimize processes and decision-making in business and industry.
Detailed Steps for Running a Simulation
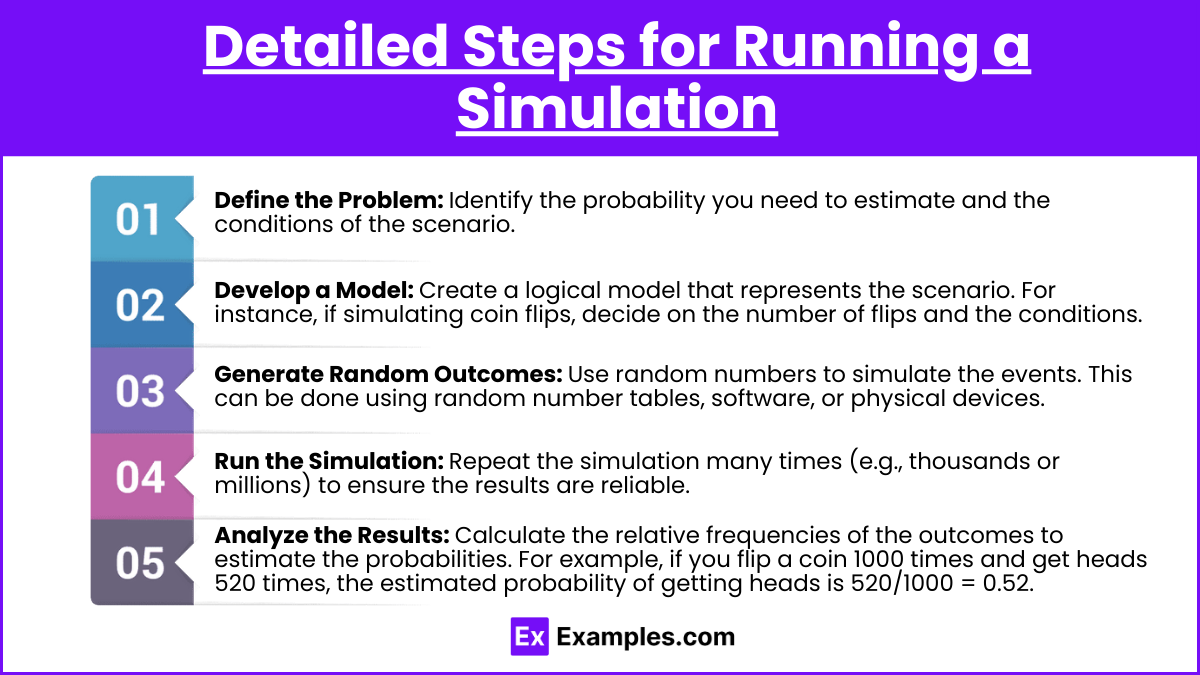
Step 1: Define the Problem
Identify the probability you need to estimate and the conditions of the scenario.
Step 2: Develop a Model
Create a logical model that represents the scenario. For instance, if simulating coin flips, decide on the number of flips and the conditions (e.g., heads or tails).
Step 3: Generate Random Outcomes
Use random numbers to simulate the events. This can be done using random number tables, software, or physical devices.
Step 4: Run the Simulation
Repeat the simulation many times (e.g., thousands or millions) to ensure the results are reliable.
Step 5: Analyze the Results
Calculate the relative frequencies of the outcomes to estimate the probabilities. For example, if you flip a coin 1000 times and get heads 520 times, the estimated probability of getting heads is 520/1000 = 0.52.
Examples
Example 1: Rolling Dice
- Scenario: Estimate the probability of rolling a sum of 7 with two dice.
- Simulation: Roll two virtual dice 10,000 times and count how often the sum is 7.
- Result: If the sum is 7 in 1,666 out of 10,000 trials, the estimated probability is 1,666/10,000 = 0.1666.
Example 2: Coin Tossing
- Scenario: Estimate the probability of getting exactly 3 heads in 5 coin tosses.
- Simulation: Toss 5 virtual coins 10,000 times and count the occurrences of exactly 3 heads.
- Result: If exactly 3 heads occur in 3,120 out of 10,000 trials, the estimated probability is 3,120/10,000 = 0.312.
Example 3: Monty Hall Problem
- Scenario: Estimate the probability of winning by switching doors in the Monty Hall problem.
- Simulation: Simulate the game 10,000 times where the contestant always switches doors.
- Result: If the contestant wins 6,666 out of 10,000 trials by switching, the estimated probability is 6,666/10,000 = 0.6666.
Example 4: Birthdays in a Group
- Scenario: Estimate the probability that at least two people share a birthday in a group of 23.
- Simulation: Randomly assign birthdays to 23 people 10,000 times and check for shared birthdays.
- Result: If shared birthdays occur in 7,056 out of 10,000 trials, the estimated probability is 7,056/10,000 = 0.7056.
Example 5: Defective Products
- Scenario: Estimate the probability that a sample of 10 products contains at least one defective product, given a 5% defect rate.
- Simulation: Simulate selecting 10 products from a batch with a 5% defect rate 10,000 times.
- Result: If at least one defective product is found in 4,254 out of 10,000 trials, the estimated probability is 4,254/10,000 = 0.4254.
Multiple Choice Questions (MCQs)
MCQ 1:
Which of the following best describes the purpose of using simulation in statistics?
A) To avoid using real-world data.
B) To generate exact probabilities for events.
C) To model and analyze complex scenarios where theoretical methods are difficult.
D) To create random numbers.
Answer: C) To model and analyze complex scenarios where theoretical methods are difficult.
Explanation: Simulations are used to approximate probabilities in complex scenarios where theoretical calculations are impractical or impossible.
MCQ 2:
When conducting a simulation, which of the following steps comes first?
A) Generate random outcomes.
B) Develop a model.
C) Define the problem.
D) Analyze the results.
Answer: C) Define the problem.
Explanation: The first step in any simulation is to clearly define the problem or the scenario you want to investigate.
MCQ 3:
In a simulation of rolling a die 1,000 times, you roll a six 167 times. What is the estimated probability of rolling a six?
A) 0.067
B) 0.167
C) 0.250
D) 0.333
Answer: B) 0.167
Explanation: The estimated probability is calculated as the number of successful outcomes (rolling a six) divided by the total number of trials: 167/1,000 = 0.167.