
Variation in Categorical and Quantitative Variables

In AP Statistics, understanding variation in categorical and quantitative variables is crucial for data analysis. This topic involves identifying and differentiating between categorical (nominal and ordinal) and quantitative (discrete and continuous) variables. It also includes measuring variation using frequency distributions, relative frequencies, and statistical measures such as mean, median, range, and standard deviation. Mastering these concepts helps in interpreting data accurately, making informed decisions, and effectively communicating statistical findings through visual representations like bar charts, histograms, and boxplots.
Learning Objectives
By studying variation in categorical and quantitative variables, you will learn to identify and differentiate between nominal, ordinal, discrete, and continuous variables. You will master measuring variation using frequency distributions, relative frequencies, and statistical measures such as mean, median, range, and standard deviation. You will also understand how to interpret data accurately and communicate your findings effectively through visual representations like bar charts, histograms, and boxplots, enhancing your analytical skills in AP Statistics.
Categorical Variables
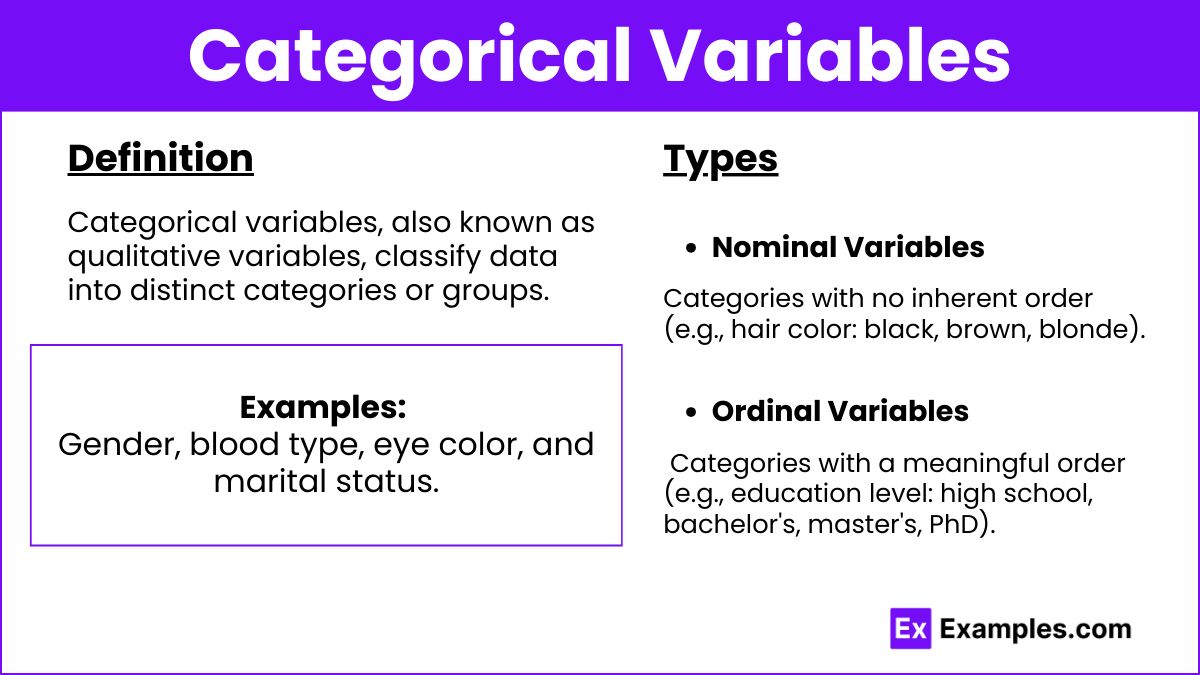
- Definition: Categorical variables, also known as qualitative variables, classify data into distinct categories or groups.
- Examples: Gender, blood type, eye color, and marital status.
- Types:
- Nominal Variables: Categories with no inherent order (e.g., hair color: black, brown, blonde).
- Ordinal Variables: Categories with a meaningful order (e.g., education level: high school, bachelor’s, master’s, PhD).
Quantitative Variables
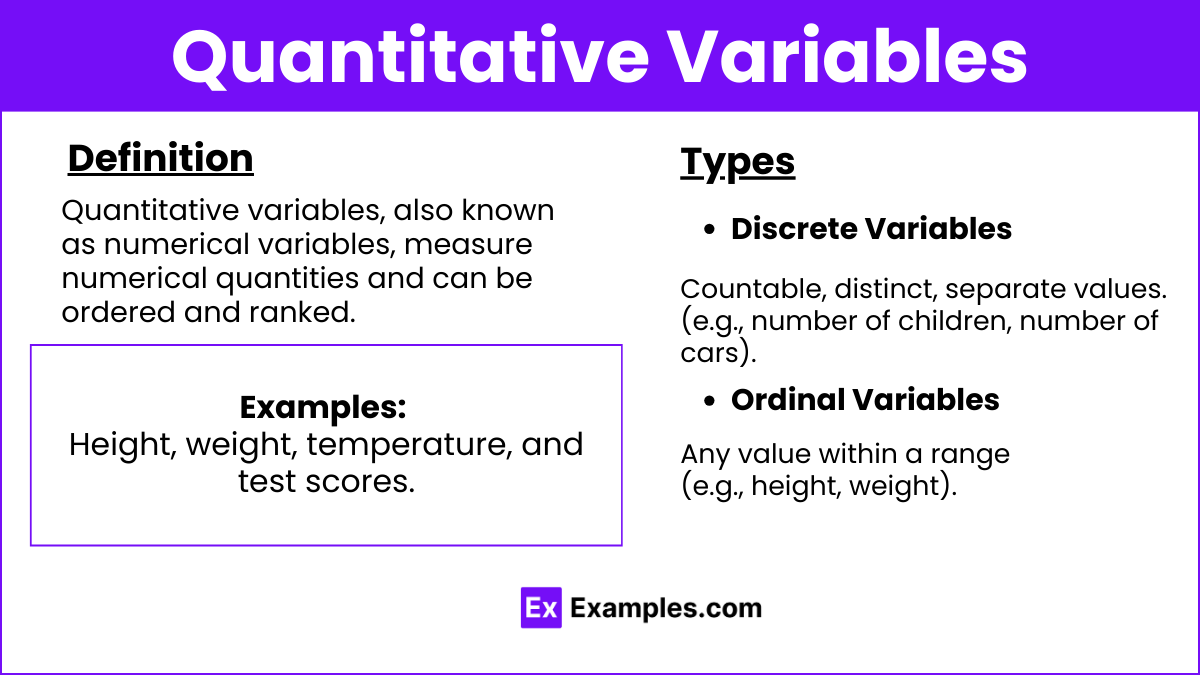
- Definition: Quantitative variables, also known as numerical variables, measure numerical quantities and can be ordered and ranked.
- Examples: Height, weight, temperature, and test scores.
- Types:
- Discrete Variables: Countable values (e.g., number of children, number of cars).
- Continuous Variables: Any value within a range (e.g., height, weight).
Measuring Variation
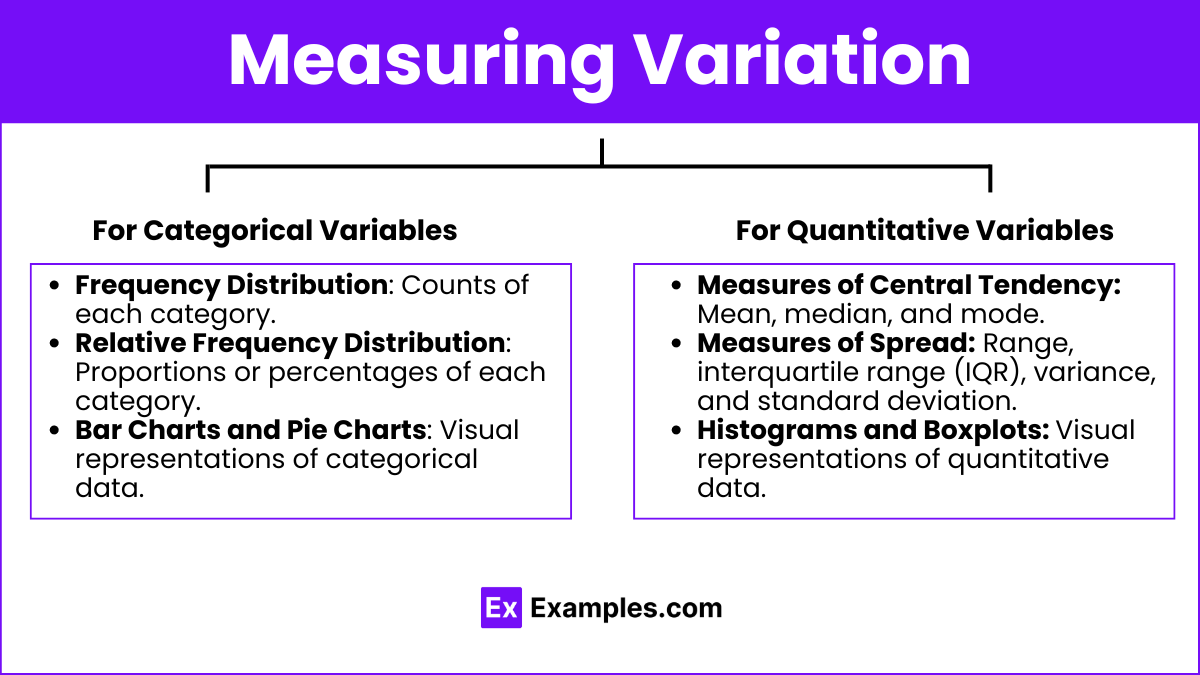
- For Categorical Variables:
- Frequency Distribution: Counts of each category.
- Relative Frequency Distribution: Proportions or percentages of each category.
- Bar Charts and Pie Charts: Visual representations of categorical data.
- For Quantitative Variables:
- Measures of Central Tendency: Mean, median, and mode.
- Measures of Spread: Range, interquartile range (IQR), variance, and standard deviation.
- Histograms and Boxplots: Visual representations of quantitative data.
Analyzing Variation
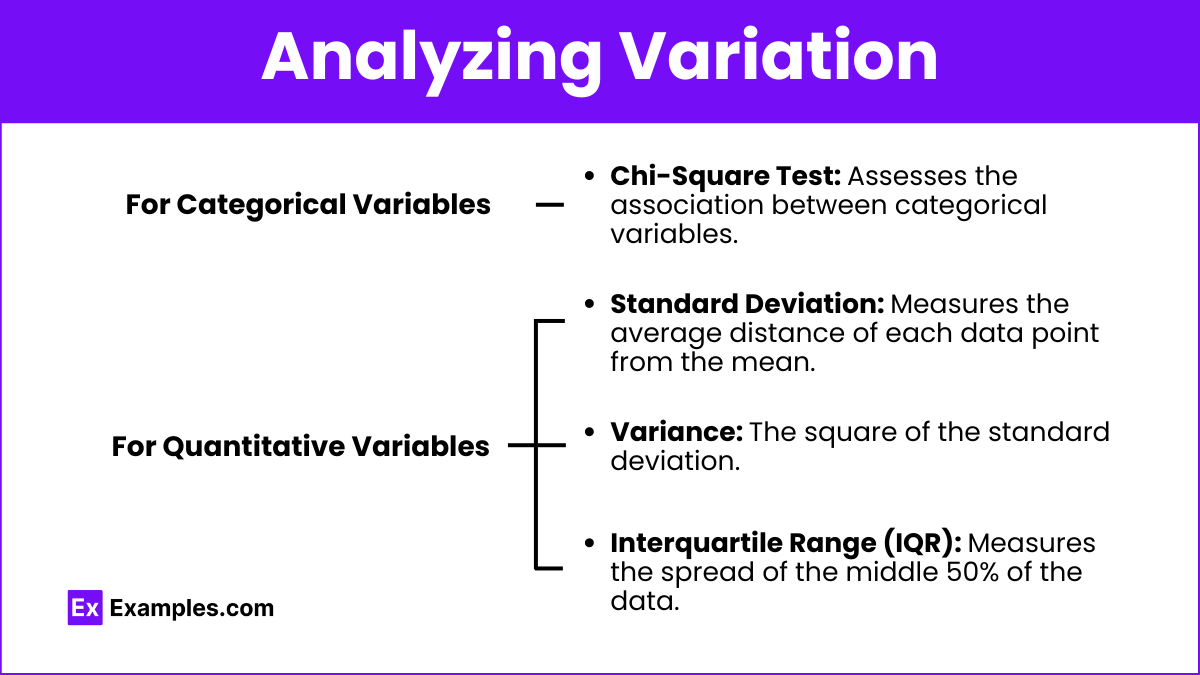
- For Categorical Variables:
- Chi-Square Test: Assesses the association between categorical variables.
- For Quantitative Variables:
- Standard Deviation: Measures the average distance of each data point from the mean.
- Variance: The square of the standard deviation.
- Interquartile Range (IQR): Measures the spread of the middle 50% of the data.
Examples
Example 1: Categorical Variable – Eye Color
- Data: Eye colors of students (blue, brown, green, hazel).
- Analysis: Frequency distribution shows how many students have each eye color. A bar chart can visualize the distribution.
Example 2: Categorical Variable – Marital Status
- Data: Marital status of survey respondents (single, married, divorced, widowed).
- Analysis: Relative frequency distribution shows the proportion of each marital status. A pie chart can illustrate the proportions.
Example 3: Quantitative Variable – Height
- Data: Heights of basketball players.
- Analysis: Calculate mean, median, range, variance, and standard deviation. A histogram can show the distribution of heights.
Example 4: Quantitative Variable – Test Scores
- Data: Scores of students on a math test.
- Analysis: Calculate measures of central tendency and spread. A boxplot can highlight the spread and identify outliers.
Example 5: Quantitative Variable – Temperature
- Data: Daily temperatures over a month.
- Analysis: Determine mean, median, and standard deviation. A line graph can show the trend over time.
Multiple Choice Questions
Question 1: Which type of variable is eye color?
A. Quantitative discrete
B. Quantitative continuous
C. Categorical nominal
D. Categorical ordinal
Answer: C. Categorical nominal
Explanation: Eye color is a categorical nominal variable because it classifies individuals into distinct categories without any inherent order.
Question 2: Which measure of spread is used to describe the variability of a quantitative variable?
A. Frequency
B. Mean
C. Standard deviation
D. Relative frequency
Answer: C. Standard deviation
Explanation: The standard deviation measures the average distance of each data point from the mean, describing the variability of a quantitative variable.
Question 3: What type of chart is best for displaying the distribution of a categorical variable?
A. Histogram
B. Bar chart
C. Boxplot
D. Line graph
Answer: B. Bar chart
Explanation: A bar chart is best for displaying the distribution of a categorical variable, as it shows the frequency or proportion of each category.