
Variation In Statistics for Samples Collected From the Same Population

In AP Statistics, understanding variation in statistics for samples collected from the same population is crucial. Variation refers to how data points differ within and between samples. By studying this concept, you will learn how to measure and interpret differences in data, assess the reliability of sample estimates, and make informed predictions about the population. Mastery of variation helps in analyzing real-world scenarios, enhancing your ability to draw accurate conclusions from statistical data.
Learning Objectives
By studying variation in statistics for samples collected from the same population in AP Statistics, you will learn how to measure and interpret differences within and between samples. You will understand concepts such as range, variance, standard deviation, and the Central Limit Theorem. This knowledge will help you assess the reliability of sample estimates, make accurate predictions about populations, and draw informed conclusions from data. Mastering these concepts is essential for effective statistical analysis and decision-making.
Population vs. Sample
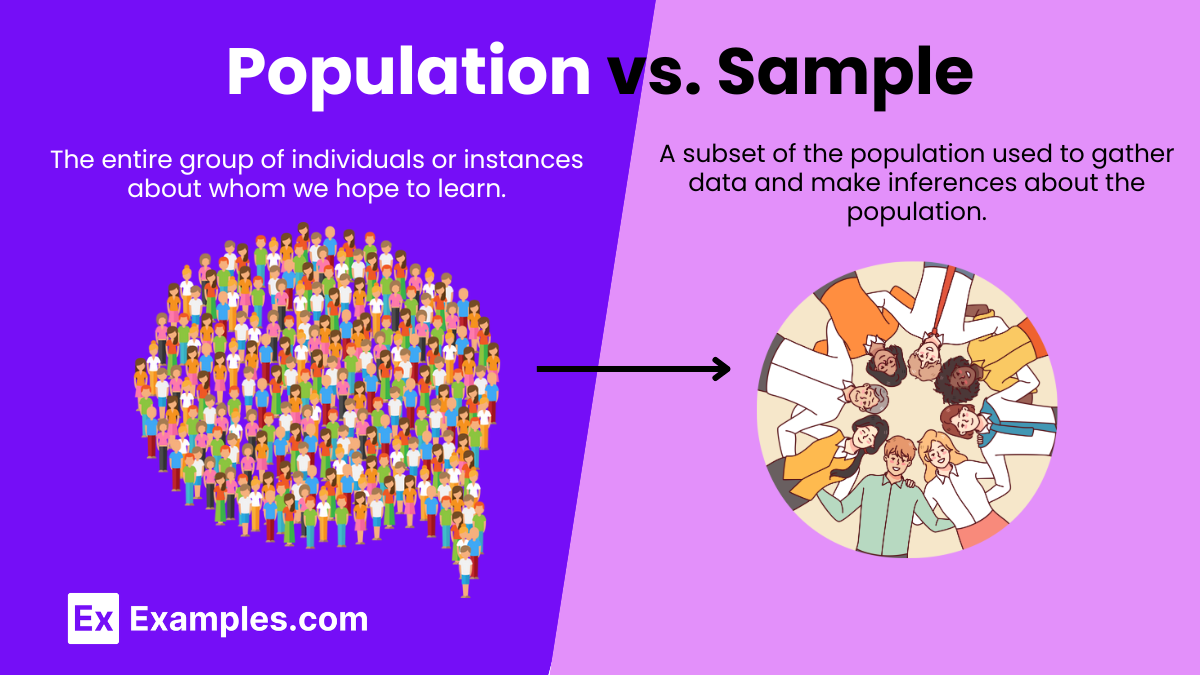
Population: The entire group of individuals or instances about whom we hope to learn.
Sample: A subset of the population used to gather data and make inferences about the population.
Types of Variation
Within-Sample Variation: Differences among data points within a single sample.
Between-Sample Variation: Differences between different samples taken from the same population.
Measures of Variation
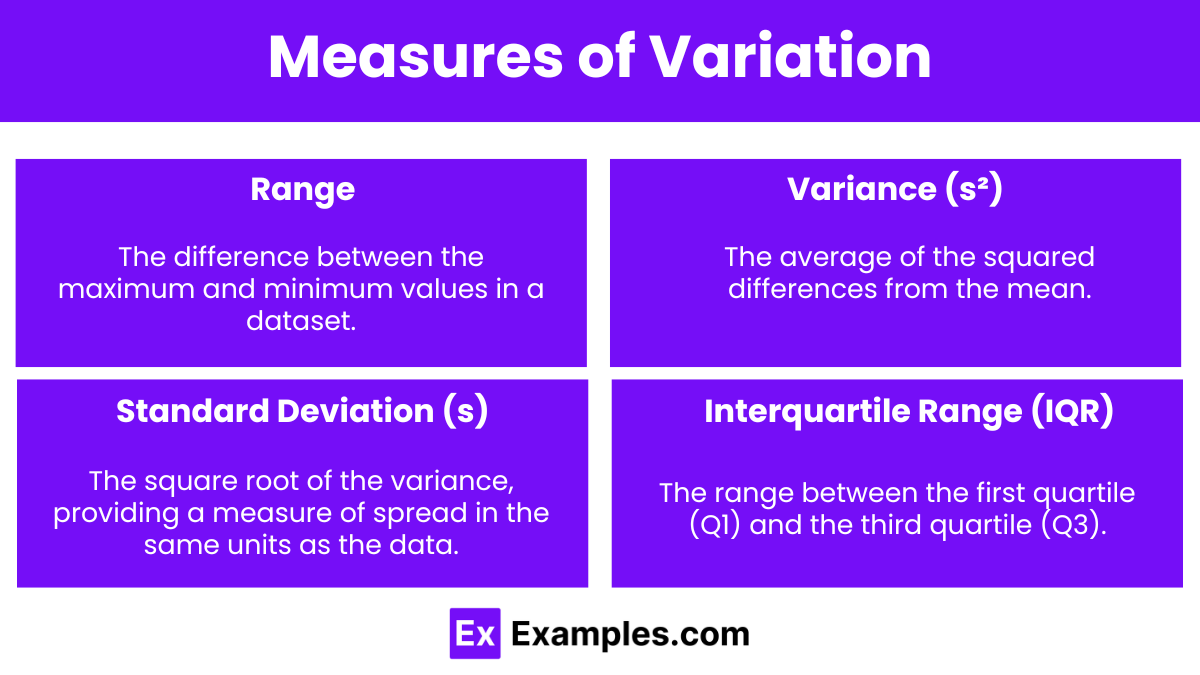
Range: The difference between the maximum and minimum values in a dataset.
Variance (s²): The average of the squared differences from the mean.
Standard Deviation (s): The square root of the variance, providing a measure of spread in the same units as the data.
Interquartile Range (IQR): The range between the first quartile (Q1) and the third quartile (Q3).
Sampling Methods
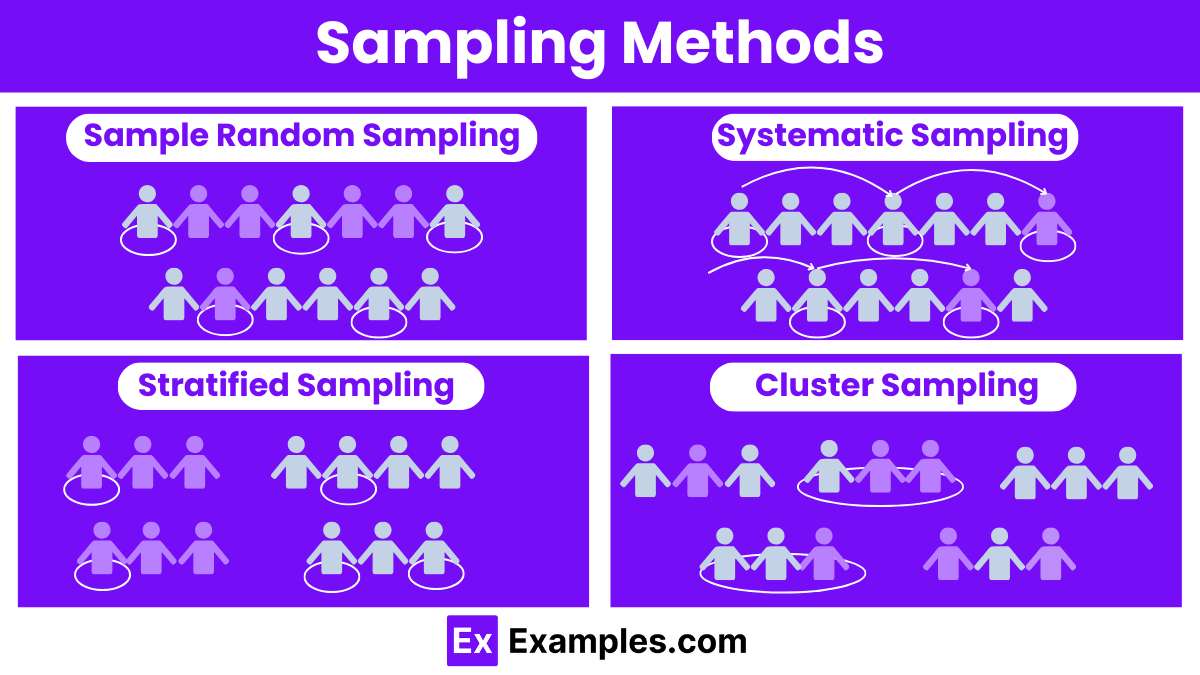
Sample Random Sampling: Each member of the population has an equal chance of being selected.
Systematic Sampling: A sample is drawn by selecting every nth member from a list of the population, ensuring a regular interval between each selection.
Stratified Sampling: The population is divided into subgroups (strata), and random samples are taken from each stratum.
Cluster Sampling: The population is divided into clusters, and a random sample of clusters is selected, then all members of the chosen clusters are sampled.
Sampling Distribution
The distribution of a statistic (e.g., mean) over many samples drawn from the same population.
Central Limit Theorem: States that the sampling distribution of the sample mean approaches a normal distribution as the sample size increases, regardless of the population’s distribution.
Examples
Example 1: Heights of Students
Consider measuring the heights of students in a school. If you take multiple samples of 30 students each from the same school, the mean heights and the variation in heights will differ between samples.
Example 2: Exam Scores
A teacher wants to estimate the average exam score of all students in a large class. By taking several random samples of 20 students each, the teacher will notice variation in the average scores and standard deviations of the samples.
Example 3: Quality Control
In a factory, quality control inspectors check the length of bolts. Inspectors take several random samples of 50 bolts each to ensure they meet specifications. The lengths will show variation both within and between samples.
Example 4: Customer Satisfaction
A company surveys customers to gauge satisfaction. By surveying different groups of 100 customers each, the company observes variations in the satisfaction scores and uses these to estimate the overall satisfaction level.
Example 5: Medical Trials
Researchers conduct a medical trial to test a new drug. They take several samples of 50 patients each to measure the drug’s effectiveness. The results will show variation in effectiveness between different samples.
Multiple Choice Questions (MCQs)
MCQ 1
A researcher takes two random samples of 40 students each from the same university to measure average study time. Which of the following is true about the samples?
A. The sample means will always be identical.
B. There will be some variation between the sample means.
C. The sample variances will be identical.
D. The sample means will always equal the population mean.
Answer: B
Explanation: There will be some variation between the sample means due to random sampling differences.
MCQ 2
Which measure of variation is the square root of the average squared differences from the mean?
A. Range
B. Variance
C. Standard Deviation
D. Interquartile Range
Answer: C
Explanation: The standard deviation is the square root of the variance, which is the average of the squared differences from the mean.
MCQ 3
According to the Central Limit Theorem, what happens to the sampling distribution of the sample mean as the sample size increases?
A. It becomes skewed to the right.
B. It becomes skewed to the left.
C. It approaches a normal distribution.
D. It remains the same regardless of sample size.
Answer: C
Explanation: The Central Limit Theorem states that the sampling distribution of the sample mean approaches a normal distribution as the sample size increases, regardless of the population’s distribution.