What does an ecological pyramid represent?
The hierarchical structure of a society
The feeding relationships in an ecosystem
The genetic diversity of a species
The geographical distribution of organisms
of 10
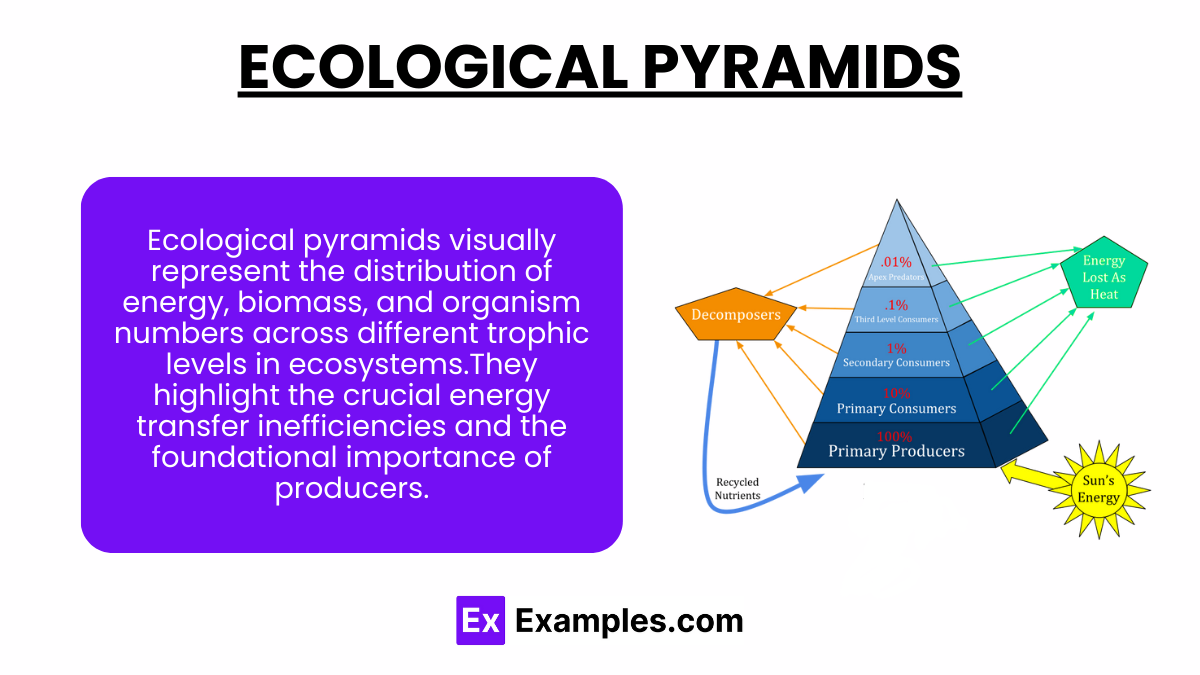
Ecological pyramids, also known as trophic or energy pyramids, offer a visual representation of the relationships between different trophic levels within an ecosystem. These structured models illustrate the flow of energy, biomass, or numbers of organisms from the base (producers) to the top (apex predators) of the food chain. By highlighting the efficiency of energy transfer, the impact of species interactions, and the overall health of ecosystems, ecological pyramids provide crucial insights into the balance of natural environments. Understanding these pyramids is key to grasping the fundamental concepts of ecology, biodiversity, and conservation efforts.
Ecological pyramids are graphical representations that show the relationship between different trophic levels in an ecosystem. They illustrate the distribution of energy, biomass, or the number of organisms at each trophic level, ranging from producers at the base to apex predators at the top. There are three main types of ecological pyramids: the pyramid of numbers, which displays the number of organisms at each level; the pyramid of biomass, which shows the total mass of organisms at each level; and the pyramid of energy, which represents the flow of energy through the food chain, demonstrating how energy decreases as it moves from producers to consumers. These pyramids help in understanding the functioning of ecosystems, highlighting the efficiency of energy transfer, and indicating the health and productivity of different ecosystems.
Ecological pyramids, also known as trophic pyramids, are graphical representations that show the relationship between different organisms in an ecosystem. They are used to illustrate the energy flow or the number of organisms at each trophic level. There are three main types of ecological pyramids:
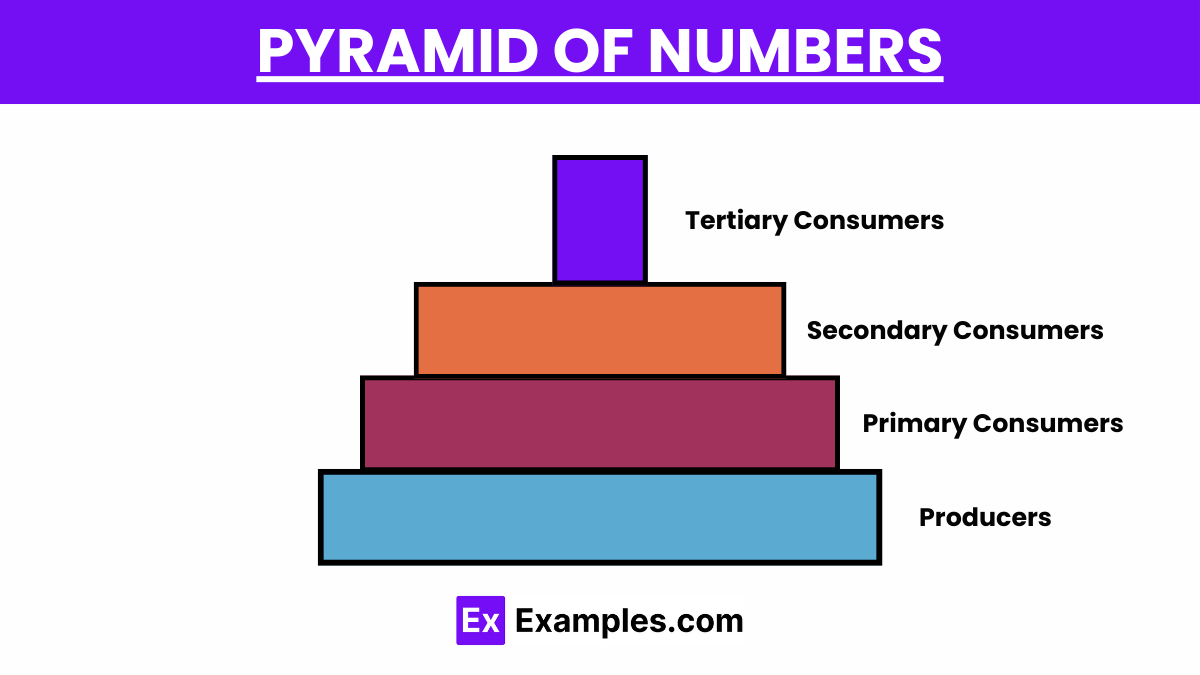
This pyramid shows the number of organisms at each trophic level in an ecosystem. It typically displays a large number of producers (plants) at the bottom, followed by fewer primary consumers (herbivores), and even fewer secondary and tertiary consumers (carnivores and omnivores) as you move up. However, in some ecosystems, like those dominated by parasitic relationships, the pyramid of numbers can appear inverted, with more parasites (secondary consumers) than hosts (primary consumers or producers).
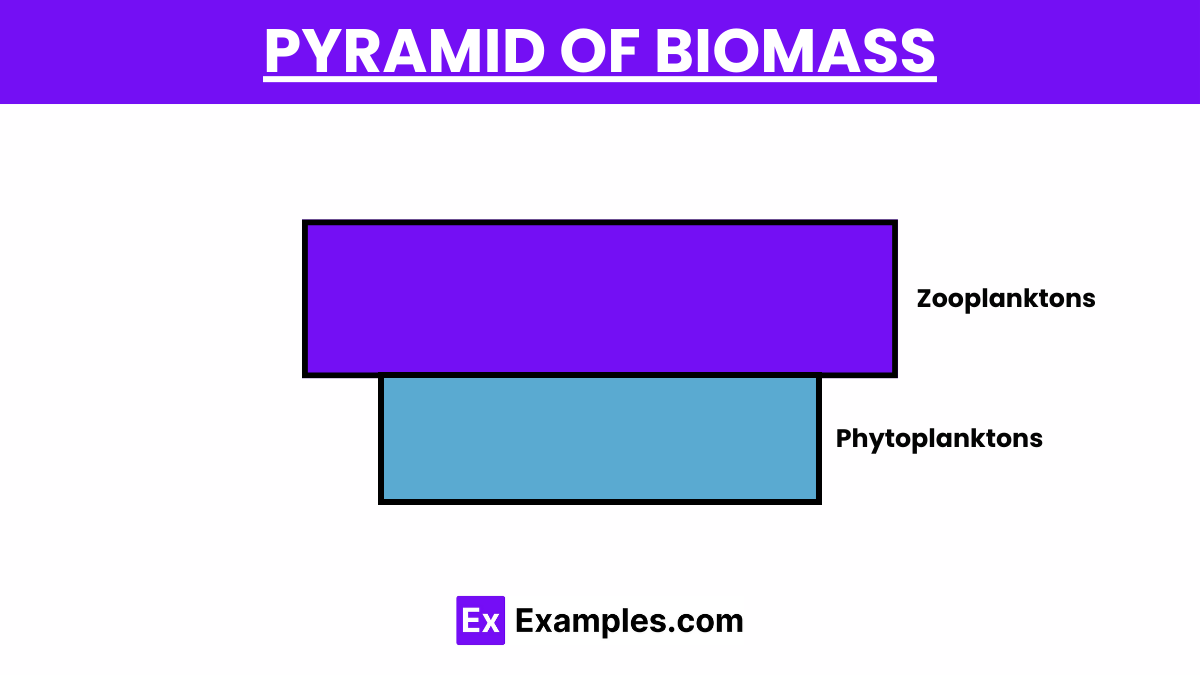
This pyramid represents the total mass of living or organic matter at each trophic level. It is usually expressed in terms of dry weight per unit area. Similar to the pyramid of numbers, the biomass pyramid generally shows a decrease in biomass from producers to apex predators. This pyramid provides insight into the efficiency of energy transfer across the different trophic levels. Exceptions can occur, such as in aquatic ecosystems, where the biomass of primary consumers (zooplankton) can exceed that of producers (phytoplankton) due to the rapid turnover rate of phytoplankton.
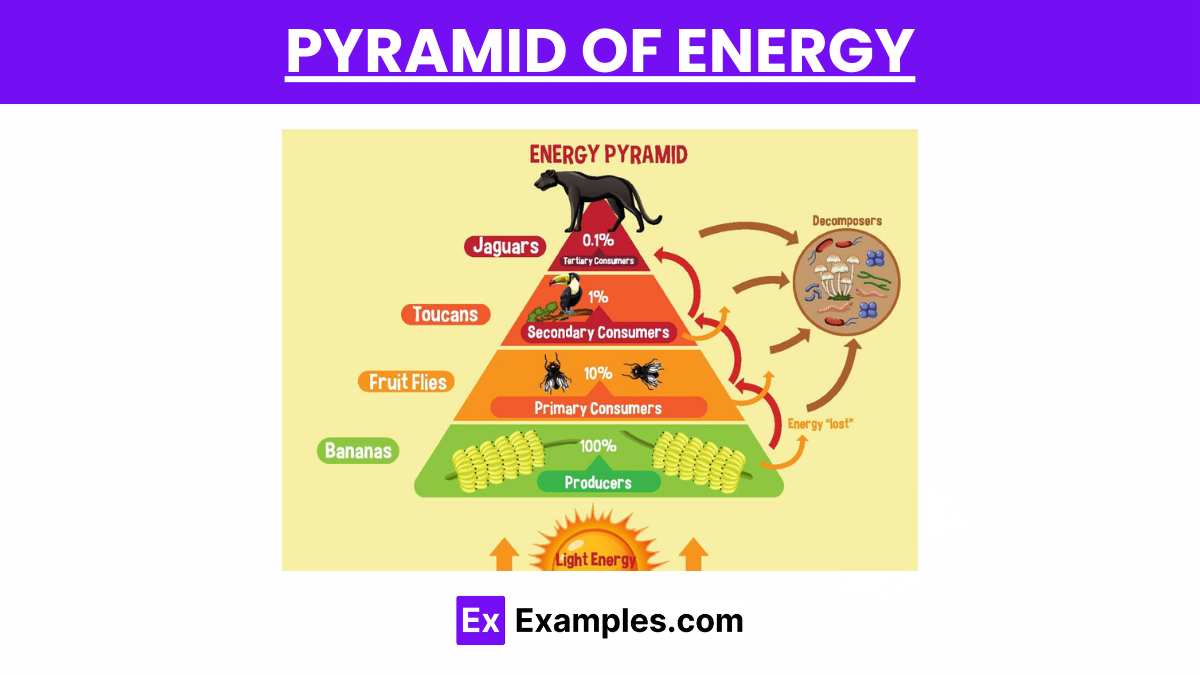
This is considered the most accurate representation of energy flow within an ecosystem. It illustrates the amount of energy (usually measured in joules or calories) that is present at each trophic level and transferred from one level to the next. Energy pyramids always show a decrease in energy as one moves from the base to the top. This decrease is due to the laws of thermodynamics, where energy is lost as heat at each trophic level, typically around 90%, making only about 10% of the energy available for transfer to the next level.
The ecological pyramid, also known as a trophic pyramid, is a graphical representation that illustrates the relationship between different levels in a food chain or food web, from producers at the bottom to apex predators at the top. It serves several important purposes in understanding ecosystem dynamics and conservation efforts:
While ecological pyramids serve as fundamental tools in understanding ecosystem dynamics, they come with several limitations that can impact their interpretation and the insights they provide:
The ecological pyramid powerfully illustrates the flow of energy, distribution of biomass, and population numbers across trophic levels within ecosystems. Highlighting the inefficiency of energy transfer, it underscores the foundational role of producers and the limited energy available to higher trophic levels. This concept not only aids in understanding ecosystem dynamics but also emphasizes the importance of conserving biodiversity and ecological balance.
Ecological pyramids represent the distribution of energy or biomass across different trophic levels in an ecosystem, typically featuring five levels: Primary Producers (autotrophs like plants), Primary Consumers (herbivores), Secondary Consumers (small carnivores), Tertiary Consumers (larger carnivores), and Quaternary Consumers (apex predators). Each level signifies a step in the food chain, from the foundation of photosynthetic organisms converting sunlight into energy, up to the apex predators at the top with no natural enemies. These pyramids illustrate the flow of energy, showing how it decreases with each ascending trophic level due to energy lost as heat during metabolic processes.
The concept of the ecological pyramid was proposed by the British ecologist Charles Elton in 1927. Elton introduced this concept to describe the structure and function of ecological communities, focusing on the flow of energy and the relationship between different trophic levels within an ecosystem. His work laid the foundation for understanding how energy is transferred from producers to consumers through the food chain, and how this affects ecosystem dynamics. Elton’s ecological pyramids remain a fundamental concept in ecology, illustrating the energy flow, biomass distribution, and number of organisms at each trophic level.
The pyramid of energy is always upright because it reflects the law of conservation of energy and the second law of thermodynamics, which together dictate that energy flows from the sun through various trophic levels in an ecosystem, decreasing at each step. In simple terms, when energy is transferred from one trophic level to the next, a significant portion (usually about 90%) is lost as heat due to metabolic processes, leaving only about 10% available to be passed on to the next level. This loss of energy at each trophic level results in a smaller energy base for each successive level, creating a pyramid that is always upright. This means that there is always more energy available at the base of the pyramid (among producers) than at the top (among top predators). This structure highlights the inefficiency of energy transfer between trophic levels and explains why ecosystems cannot support a large number of trophic levels.

What does an ecological pyramid represent?
The hierarchical structure of a society
The feeding relationships in an ecosystem
The genetic diversity of a species
The geographical distribution of organisms
Which type of ecological pyramid shows the total mass of living matter at each trophic level?
Pyramid of Numbers
Pyramid of Biomass
Pyramid of Energy
Pyramid of Productivity
In an energy pyramid, where is the highest amount of energy found?
At the top of the pyramid
At the base of the pyramid
In the middle of the pyramid
Equally distributed throughout the pyramid
Which ecological pyramid can never be inverted?
Pyramid of Numbers
Pyramid of Biomass
Pyramid of Energy
Pyramid of Productivity
In a typical pyramid of numbers, which level would you expect to have the fewest individuals?
Primary producers
Primary consumers
Secondary consumers
Tertiary consumers
Why are pyramids of biomass often inverted in aquatic ecosystems?
Because primary producers are large in size
Because primary consumers are small
Because phytoplankton have a high turnover rate
Because there are more predators than prey
What does a pyramid of energy show?
The number of organisms at each trophic level
The biomass at each trophic level
The energy flow through each trophic level
The reproductive rates at each trophic level
In a terrestrial ecosystem, which level of a biomass pyramid typically has the greatest biomass?
Producers
Primary consumers
Secondary consumers
Tertiary consumers
How does a pyramid of numbers differ from a pyramid of biomass?
It measures energy instead of numbers
It counts the number of organisms at each level
It shows the weight of organisms at each level
It is always inverted
What typically happens to energy as it moves up an ecological pyramid?
It increases
It remains the same
It decreases
It fluctuates randomly