40+ BCG Matrix Examples to Download
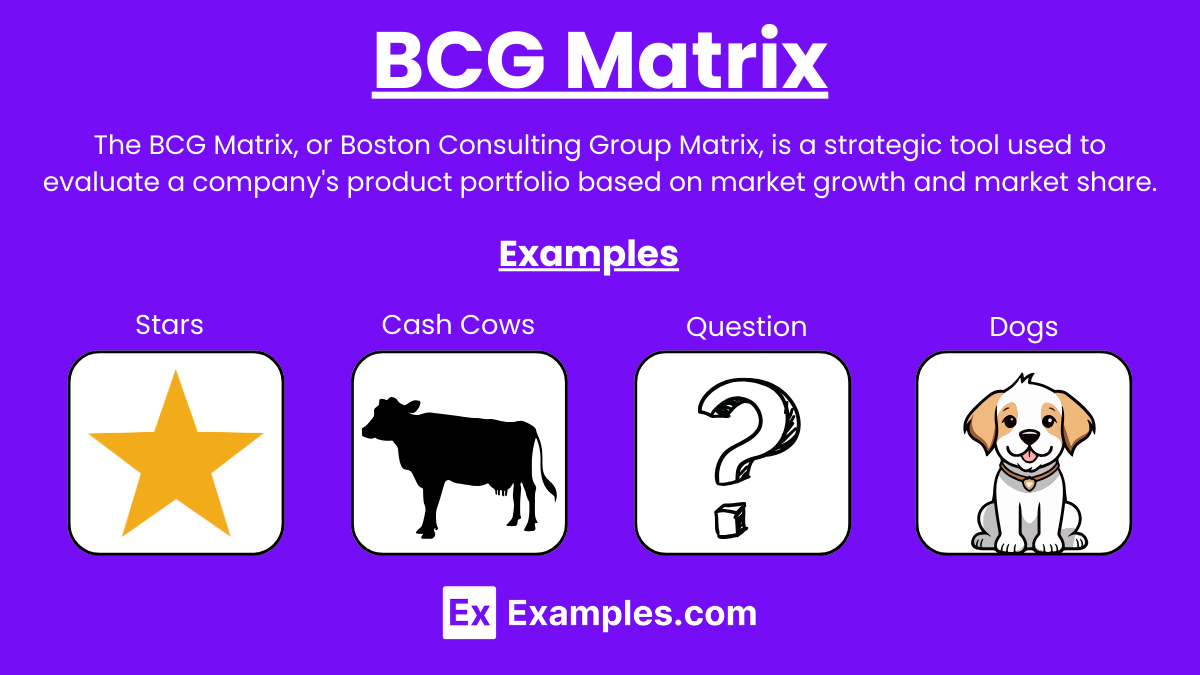
The BCG Matrix, also known as the Boston Consulting Group Matrix, is a strategic tool used by businesses to evaluate their product portfolio and make informed marketing decisions. It categorizes products into four quadrants based on market growth and market share: Stars, Cash Cows, Question Marks, and Dogs. Through a Research Survey, companies can gather valuable data to position their products accurately within the matrix. Incorporating insights from the Mission Statement for Marketing, the BCG Matrix helps in aligning marketing strategies with organizational goals. Additionally, a well-prepared Marketing Media Kit can support the promotion of products identified as Stars and Cash Cows, ensuring they receive the necessary attention and resources.
What is Bcg Matrix?
The BCG Matrix is a strategic tool used to analyze a company’s product portfolio by categorizing products based on their market growth and market share. It helps businesses identify which products to invest in, develop, or discontinue.
Examples of Bcg Matrix
- Apple Inc.: Stars: iPhone; Cash Cows: MacBook; Question Marks: Apple Watch; Dogs: iPod
- Coca-Cola: Stars: Coke Zero; Cash Cows: Classic Coke; Question Marks: Smartwater; Dogs: Tab
- Google (Alphabet Inc.): Stars: Google Search; Cash Cows: YouTube; Question Marks: Google Glass; Dogs: Google+
- Samsung: Stars: Galaxy Smartphones; Cash Cows: Home Appliances; Question Marks: Smartwatches; Dogs: MP3 Players
- Microsoft: Stars: Microsoft Azure; Cash Cows: Microsoft Office; Question Marks: Surface Devices; Dogs: Windows Phone
- Nike: Stars: Air Jordans; Cash Cows: Running Shoes; Question Marks: Sportswear; Dogs: Golf Equipment
- Amazon: Stars: Amazon Web Services (AWS); Cash Cows: E-commerce; Question Marks: Kindle; Dogs: Amazon Fire Phone
- Procter & Gamble: Stars: Tide; Cash Cows: Gillette; Question Marks: Old Spice; Dogs: Duracell
- Disney: Stars: Disney+; Cash Cows: Theme Parks; Question Marks: ABC Network; Dogs: Disney Store
- PepsiCo: Stars: Gatorade; Cash Cows: Pepsi; Question Marks: Quaker Oats; Dogs: Tropicana
- Tesla: Stars: Model 3; Cash Cows: Model S; Question Marks: Solar Roof; Dogs: Roadster
- Facebook (Meta): Stars: Instagram; Cash Cows: Facebook; Question Marks: Oculus VR; Dogs: Facebook Watch
- General Motors: Stars: Chevrolet Bolt EV; Cash Cows: GMC Sierra; Question Marks: Cadillac; Dogs: Saturn
- IBM: Stars: Cloud Computing; Cash Cows: Mainframes; Question Marks: Watson AI; Dogs: PCs
- Sony: Stars: PlayStation; Cash Cows: Television; Question Marks: Xperia Smartphones; Dogs: MP3 Players
- Johnson & Johnson: Stars: Band-Aid; Cash Cows: Baby Products; Question Marks: Acuvue; Dogs: Nizoral
- Ford: Stars: F-Series Trucks; Cash Cows: Mustang; Question Marks: Electric Vehicles; Dogs: Fiesta
- Unilever: Stars: Dove; Cash Cows: Lipton; Question Marks: Ben & Jerry’s; Dogs: Slim-Fast
- Nestlé: Stars: Nespresso; Cash Cows: Nescafé; Question Marks: Purina; Dogs: Hot Pockets
- McDonald’s: Stars: McCafe; Cash Cows: Big Mac; Question Marks: Salads; Dogs: McPizza
- Intel: Stars: Core Processors; Cash Cows: Xeon Processors; Question Marks: AI Chips; Dogs: Itanium
- Adidas: Stars: Ultraboost; Cash Cows: Classic Sneakers; Question Marks: Fitness Wearables; Dogs: Golf Gear
- Volkswagen: Stars: Electric Vehicles; Cash Cows: Golf; Question Marks: Audi; Dogs: Beetle
- HP (Hewlett-Packard): Stars: Laptops; Cash Cows: Printers; Question Marks: 3D Printing; Dogs: Tablets
- L’Oréal: Stars: Lancôme; Cash Cows: L’Oréal Paris; Question Marks: Garnier; Dogs: SoftSheen-Carson
- Starbucks: Stars: Mobile Orders; Cash Cows: Coffee; Question Marks: Teavana; Dogs: CDs
- BMW: Stars: Electric Vehicles (i Series); Cash Cows: 3 Series; Question Marks: Motorcycles; Dogs: Compact Cars
- Kellogg’s: Stars: Special K; Cash Cows: Corn Flakes; Question Marks: Pringles; Dogs: Kashi
- Heinz: Stars: Ketchup; Cash Cows: Baked Beans; Question Marks: Organic Products; Dogs: Weight Watchers Meals
- Uber: Stars: Uber Eats; Cash Cows: Ride-sharing; Question Marks: Autonomous Vehicles; Dogs: Uber Freight
- Airbnb: Stars: Luxury Rentals; Cash Cows: Standard Rentals; Question Marks: Experiences; Dogs: HotelTonight
- Ford: Stars: F-Series Trucks; Cash Cows: Mustang; Question Marks: Electric Vehicles; Dogs: Taurus
- Sony: Stars: PlayStation; Cash Cows: Televisions; Question Marks: Smart Home Devices; Dogs: VAIO
- Netflix: Stars: Original Content; Cash Cows: Subscription Service; Question Marks: Interactive Content; Dogs: DVD Rentals
- IBM: Stars: Cloud Services; Cash Cows: IT Services; Question Marks: Quantum Computing; Dogs: Software Solutions
- Twitter: Stars: Ads; Cash Cows: Promoted Tweets; Question Marks: Subscriptions; Dogs: Vine
- Red Bull: Stars: Energy Drinks; Cash Cows: Sponsorships; Question Marks: Organic Drinks; Dogs: Cola
- Canon: Stars: DSLR Cameras; Cash Cows: Printers; Question Marks: Mirrorless Cameras; Dogs: Compact Cameras
- Pfizer: Stars: Vaccines; Cash Cows: Prescription Drugs; Question Marks: Over-the-counter Products; Dogs: Generic Drugs
- Visa: Stars: Digital Payments; Cash Cows: Credit Card Processing; Question Marks: Crypto Solutions; Dogs: Prepaid Cards
Bcg Matrix Examples for Students
- Tech Company (e.g., Apple Inc.): Stars: iPhone; Cash Cows: MacBook; Question Marks: Apple Watch; Dogs: iPod
- Beverage Company (e.g., Coca-Cola): Stars: Coke Zero; Cash Cows: Classic Coke; Question Marks: Smartwater; Dogs: Tab
- Search Engine Company (e.g., Google): Stars: Google Search; Cash Cows: YouTube; Question Marks: Google Glass; Dogs: Google+
- Consumer Electronics Company (e.g., Samsung): Stars: Galaxy Smartphones; Cash Cows: Home Appliances; Question Marks: Smartwatches; Dogs: MP3 Players
- Software Company (e.g., Microsoft): Stars: Microsoft Azure; Cash Cows: Microsoft Office; Question Marks: Surface Devices; Dogs: Windows Phone
- Sports Apparel Company (e.g., Nike): Stars: Air Jordans; Cash Cows: Running Shoes; Question Marks: Sportswear; Dogs: Golf Equipment
- E-commerce Company (e.g., Amazon): Stars: Amazon Web Services (AWS); Cash Cows: E-commerce; Question Marks: Kindle; Dogs: Amazon Fire Phone
- Consumer Goods Company (e.g., Procter & Gamble): Stars: Tide; Cash Cows: Gillette; Question Marks: Old Spice; Dogs: Duracell
- Entertainment Company (e.g., Disney): Stars: Disney+; Cash Cows: Theme Parks; Question Marks: ABC Network; Dogs: Disney Store
- Automobile Company (e.g., Tesla): Stars: Model 3; Cash Cows: Model S; Question Marks: Solar Roof; Dogs: Roadster
-
Examples of Question Marks
Financial Services: A new digital banking platform in a rapidly growing fintech market but with low market share. - Pre-Construction Services: An emerging construction technology company offering innovative pre-construction services that is gaining interest in a booming construction market but has not yet captured significant market share.
- Service List: A startup offering a novel set of services in a high-growth industry, such as renewable energy consulting, with significant growth potential but currently low market penetration.
How to make a strategic BCG matrix in Marketing?
Step 1: Identify Your Products or Business Units
List all the products, services, or business units within your company. This will be the basis for analysis in the BCG Matrix.
Step 2: Gather Data
Conduct a Research Survey to collect data on market growth rates, market share, and other relevant metrics for each product or business unit. This data will be crucial in positioning them accurately within the matrix.
Step 3: Determine Market Growth Rate
Calculate the market growth rate for each product or business unit. Market growth rate represents the overall industry growth, indicating how quickly the market is expanding.
Step 4: Calculate Relative Market Share
Determine the relative market share for each product or business unit. This is the product’s market share compared to the largest competitor in the industry.
Step 5: Create the BCG Matrix
Draw a 2×2 grid. Label the vertical axis as “Market Growth Rate” and the horizontal axis as “Relative Market Share.” Divide the grid into four quadrants:
- Stars: High market growth, high market share
- Cash Cows: Low market growth, high market share
- Question Marks: High market growth, low market share
- Dogs: Low market growth, low market share
Step 6: Position Products on the Matrix
Using the data from your research, plot each product or business unit in the appropriate quadrant based on their market growth rate and relative market share.
Step 7: Analyze and Develop Strategies
Analyze the position of each product or business unit:
- Stars: Invest in these products to maintain or grow market share.
- Cash Cows: Maximize profits with minimal investment.
- Question Marks: Evaluate potential for growth and decide whether to invest or divest.
- Dogs: Consider discontinuing or restructuring these products.
Step 8: Align with Mission Statement for Marketing
Ensure your marketing strategies for each quadrant align with your company’s Mission Statement for Marketing. This will ensure consistency and focus in achieving your marketing objectives.
Step 9: Develop a Marketing Media Kit
Create a comprehensive Marketing Media Kit for products identified as Stars and Cash Cows. This should include promotional materials, key messages, and media channels to effectively communicate the value of these products.
Step 10: Review and Adjust Regularly
Regularly review and adjust your BCG Matrix to reflect changes in the market and internal performance. Continuous monitoring will help maintain strategic alignment and optimize resource allocation.
What Are the 4 Quadrants of the BCG Matrix?
1. Stars
High Market Growth, High Market Share
- Characteristics: Products in the Stars quadrant are leaders in fast-growing markets. They have a high market share and generate significant revenue.
- Strategy: Invest in Stars to maintain or grow market share. These products require substantial investment to sustain their position and capitalize on market opportunities.
- Examples: A successful new technology product or a leading brand in an expanding market.
2. Cash Cows
Low Market Growth, High Market Share
- Characteristics: Products in the Cash Cows quadrant have a high market share in mature, slow-growing markets. They generate consistent, stable cash flow with minimal investment.
- Strategy: Maximize profits from Cash Cows and use the generated cash to support other areas of the business, such as investing in Stars or developing Question Marks.
- Examples: Established household brands or products with a dominant market position in a stable industry.
3. Question Marks
High Market Growth, Low Market Share
- Characteristics: Products in the Question Marks quadrant are in high-growth markets but have a low market share. They have potential but require significant investment to increase their market share.
- Strategy: Evaluate whether to invest heavily in these products to turn them into Stars or to divest if they lack potential. The decision depends on the product’s future prospects and alignment with the company’s goals.
- Examples: New or emerging products with potential but not yet proven success.
4. Dogs
Low Market Growth, Low Market Share
- Characteristics: Products in the Dogs quadrant have a low market share in low-growth markets. They often drain resources and generate minimal profit.
- Strategy: Consider discontinuing or repositioning Dogs. These products may not be worth investing in due to their limited potential for growth and profitability.
- Examples: Outdated or declining products in saturated markets.
Understanding a BCG Growth-Share Matrix
Stars
- High Market Growth, High Market Share
- These products are leaders in their market and have high growth potential.
- Companies should invest in Stars to maintain or increase their market share.
Cash Cows
- Low Market Growth, High Market Share
- These products generate steady cash flow with little investment needed.
- Profits from Cash Cows can be used to support other products in the portfolio.
Question Marks
- High Market Growth, Low Market Share
- These products have potential but require significant investment to increase market share.
- Companies need to evaluate if these products can become Stars or if they should divest.
Dogs
- Low Market Growth, Low Market Share
- These products have limited potential and often drain resources.
- Companies should consider discontinuing or repositioning these products.
Limitations of the Matrix
Simplistic Categorization
- Oversimplification: The matrix simplifies complex business environments into four categories, potentially overlooking nuances and variations within each category.
- Ignores Other Factors: It focuses only on market growth and relative market share, ignoring other important factors such as competitive intensity, market size, and overall industry health.
Static Analysis
- Lack of Dynamism: The matrix provides a snapshot in time and does not account for the dynamic nature of markets. Changes in consumer preferences, technological advancements, and competitor actions can quickly render the analysis outdated.
- Short-Term Focus: It tends to emphasize short-term performance over long-term strategic positioning and sustainability.
Limited Strategic Guidance
- Ambiguous Recommendations: The matrix suggests generic strategies (invest, hold, divest) without providing detailed guidance on how to implement these strategies.
- No Consideration of Synergies: It does not consider the potential synergies between different products or business units that could influence strategic decisions.
Market Growth Rate and Market Share Limitations
- Relative Market Share Issues: The measure of relative market share is based on the largest competitor, which may not always be the most relevant benchmark.
- Market Growth Rate Limitations: High market growth is not always indicative of attractiveness. It may come with increased competition and higher costs, which the matrix does not address.
Resource Allocation Challenges
- Overemphasis on Market Leaders: The matrix encourages investing heavily in Stars and Cash Cows, potentially leading to underinvestment in innovative or niche products that do not fit neatly into the categories.
- Divestment Pressure: It may pressure companies to divest from Dogs and Question Marks without considering their strategic importance or future potential.
Strategic Context Ignored
- Lack of Competitive Insight: The matrix does not provide insight into competitive dynamics or the strategic moves of competitors, which are crucial for informed decision-making.
- Mission Alignment: The matrix does not inherently ensure alignment with the company’s Mission Statement for Marketing or broader strategic goals.
Implementation Challenges
- Data Accuracy: Accurate and reliable data on market growth rates and relative market share is essential, but can be difficult to obtain.
- Subjectivity: Categorizing products can be subjective and influenced by managerial bias or incomplete information.
Ways to use a BCG matrix
1. Resource Allocation
- Invest in Stars: Allocate significant resources to products in the Stars quadrant to maintain or grow their market share.
- Support Cash Cows: Use the stable cash flow from Cash Cows to fund other strategic initiatives, such as developing new products or entering new markets.
- Evaluate Question Marks: Assess the potential of products in the Question Marks quadrant. Decide whether to invest heavily to increase their market share or to divest.
- Minimize Investment in Dogs: Reduce resources allocated to Dogs, and consider discontinuing or repositioning these products.
2. Strategic Planning
- Portfolio Analysis: Use the BCG Matrix to analyze your current product portfolio. Identify which products are performing well and which need strategic changes.
- Market Positioning: Determine the market position of each product. Use this information to make strategic decisions about marketing, product development, and sales efforts.
- Long-Term Planning: Incorporate the insights from the BCG Matrix into your long-term strategic planning. Align product strategies with overall business objectives.
3. Identifying Growth Opportunities
- Focus on High-Growth Areas: Identify products in high-growth markets (Stars and Question Marks). Develop strategies to capitalize on these growth opportunities.
- Innovation and Development: Invest in innovation and development for products with high market potential. Use the matrix to prioritize R&D efforts.
4. Performance Evaluation
- Benchmarking: Use the matrix to benchmark the performance of your products against competitors. Identify areas where your products lead or lag in the market.
- Tracking Progress: Regularly update the matrix to track the progress of your products. Use this to monitor changes in market share and growth rates.
5. Strategic Marketing
- Targeted Marketing: Develop targeted marketing campaigns based on the quadrant a product falls into. For example, invest heavily in marketing Stars, maintain marketing for Cash Cows, and experiment with marketing for Question Marks.
- Messaging and Positioning: Tailor your messaging and positioning strategies for each product category. Highlight strengths and address weaknesses accordingly.
6. Financial Management
- Budget Allocation: Allocate budgets based on the product’s position in the matrix. Ensure that high-potential products receive adequate funding.
- Profit Maximization: Maximize profits from Cash Cows and reinvest in high-potential areas. Avoid over-investing in low-potential products.
7. Risk Management
- Diversification: Use the matrix to ensure a balanced product portfolio. Avoid over-reliance on a single product category.
- Exit Strategy: Identify products that may need to be discontinued or divested. Develop exit strategies for products in the Dogs quadrant to minimize losses.
8. Internal Communication
- Stakeholder Alignment: Use the BCG Matrix to communicate product strategy and performance to stakeholders. Align teams around common goals and strategies.
- Decision-Making Framework: Provide a clear framework for decision-making. Use the matrix to justify strategic decisions and resource allocation.
Bcg Matrix Question Mark
Question Marks in the BCG Matrix represent products or business units with low market share in high-growth markets. These products have potential but require substantial investment to increase their market share. Deciding whether to invest in or divest from these products is a crucial strategic choice for companies.
Characteristics of Question Marks
- High Market Growth, Low Market Share: These products are in rapidly growing markets but currently hold a small market share. They may have the potential to become Stars if managed correctly.
- High Investment Needs: To gain a larger market share, Question Marks require significant financial resources and strategic initiatives.
- Uncertain Future: These products can either become profitable Stars or fail and turn into Dogs, depending on the company’s investment decisions and market dynamics.
Strategic Considerations for Question Marks
- Investment Decisions: Companies need to evaluate the potential of Question Marks carefully. This involves analyzing market trends, competitive landscape, and internal capabilities.
- Financial Service: Securing adequate financial services is crucial to support the high investment needs of Question Marks. This includes funding for marketing, product development, and expansion.
- Pre-Construction Services: For industries like real estate or construction, pre-construction services such as planning, feasibility studies, and securing permits are essential to lay the groundwork for turning Question Marks into Stars.
- Service List: Developing a comprehensive service list that addresses all aspects of the product lifecycle can help streamline operations and improve the chances of success for Question Marks.
Who developed the BCG Matrix?
The Boston Consulting Group developed the BCG Matrix in the 1970s.
What are the four quadrants of the BCG Matrix?
The four quadrants are Stars, Cash Cows, Question Marks, and Dogs.
How do Stars differ from Cash Cows?
Stars have high market growth and share, while Cash Cows have high share but low growth.
What characterizes Question Marks?
Question Marks have low market share in high-growth markets, requiring significant investment.
Why are Dogs considered less desirable?
Dogs have low market share and low growth, often generating minimal profit.
How is market growth rate calculated?
Market growth rate is typically measured by the annual increase in industry sales.
What is relative market share?
Relative market share compares a product’s share to the largest competitor in the market.
How can the BCG Matrix aid in resource allocation?
It helps identify which products to invest in, develop, or divest.
Can the BCG Matrix apply to service industries?
Yes, it can analyze any business units or services based on growth and share.
What strategic actions are recommended for Stars?
Invest to maintain or increase market share and capitalize on growth opportunities.
Share :

40+ BCG Matrix Examples to Download
The BCG Matrix, also known as the Boston Consulting Group Matrix, is a strategic tool used by businesses to evaluate their product portfolio and make informed marketing decisions. It categorizes products into four quadrants based on market growth and market share: Stars, Cash Cows, Question Marks, and Dogs. Through a Research Survey, companies can gather valuable data to position their products accurately within the matrix. Incorporating insights from the Mission Statement for Marketing, the BCG Matrix helps in aligning marketing strategies with organizational goals. Additionally, a well-prepared Marketing Media Kit can support the promotion of products identified as Stars and Cash Cows, ensuring they receive the necessary attention and resources.
What is Bcg Matrix?
The BCG Matrix is a strategic tool used to analyze a company’s product portfolio by categorizing products based on their market growth and market share. It helps businesses identify which products to invest in, develop, or discontinue.
Examples of Bcg Matrix
Apple Inc.: Stars: iPhone; Cash Cows: MacBook; Question Marks: Apple Watch; Dogs: iPod
Coca-Cola: Stars: Coke Zero; Cash Cows: Classic Coke; Question Marks: Smartwater; Dogs: Tab
Google (Alphabet Inc.): Stars: Google Search; Cash Cows: YouTube; Question Marks: Google Glass; Dogs: Google+
Samsung: Stars: Galaxy Smartphones; Cash Cows: Home Appliances; Question Marks: Smartwatches; Dogs: MP3 Players
Microsoft: Stars: Microsoft Azure; Cash Cows: Microsoft Office; Question Marks: Surface Devices; Dogs: Windows Phone
Nike: Stars: Air Jordans; Cash Cows: Running Shoes; Question Marks: Sportswear; Dogs: Golf Equipment
Amazon: Stars: Amazon Web Services (AWS); Cash Cows: E-commerce; Question Marks: Kindle; Dogs: Amazon Fire Phone
Procter & Gamble: Stars: Tide; Cash Cows: Gillette; Question Marks: Old Spice; Dogs: Duracell
Disney: Stars: Disney+; Cash Cows: Theme Parks; Question Marks: ABC Network; Dogs: Disney Store
PepsiCo: Stars: Gatorade; Cash Cows: Pepsi; Question Marks: Quaker Oats; Dogs: Tropicana
Tesla: Stars: Model 3; Cash Cows: Model S; Question Marks: Solar Roof; Dogs: Roadster
Facebook (Meta): Stars: Instagram; Cash Cows: Facebook; Question Marks: Oculus VR; Dogs: Facebook Watch
General Motors: Stars: Chevrolet Bolt EV; Cash Cows: GMC Sierra; Question Marks: Cadillac; Dogs: Saturn
IBM: Stars: Cloud Computing; Cash Cows: Mainframes; Question Marks: Watson AI; Dogs: PCs
Sony: Stars: PlayStation; Cash Cows: Television; Question Marks: Xperia Smartphones; Dogs: MP3 Players
Johnson & Johnson: Stars: Band-Aid; Cash Cows: Baby Products; Question Marks: Acuvue; Dogs: Nizoral
Ford: Stars: F-Series Trucks; Cash Cows: Mustang; Question Marks: Electric Vehicles; Dogs: Fiesta
Unilever: Stars: Dove; Cash Cows: Lipton; Question Marks: Ben & Jerry’s; Dogs: Slim-Fast
Nestlé: Stars: Nespresso; Cash Cows: Nescafé; Question Marks: Purina; Dogs: Hot Pockets
McDonald’s: Stars: McCafe; Cash Cows: Big Mac; Question Marks: Salads; Dogs: McPizza
Intel: Stars: Core Processors; Cash Cows: Xeon Processors; Question Marks: AI Chips; Dogs: Itanium
Adidas: Stars: Ultraboost; Cash Cows: Classic Sneakers; Question Marks: Fitness Wearables; Dogs: Golf Gear
Volkswagen: Stars: Electric Vehicles; Cash Cows: Golf; Question Marks: Audi; Dogs: Beetle
HP (Hewlett-Packard): Stars: Laptops; Cash Cows: Printers; Question Marks: 3D Printing; Dogs: Tablets
L’Oréal: Stars: Lancôme; Cash Cows: L’Oréal Paris; Question Marks: Garnier; Dogs: SoftSheen-Carson
Starbucks: Stars: Mobile Orders; Cash Cows: Coffee; Question Marks: Teavana; Dogs: CDs
BMW: Stars: Electric Vehicles (i Series); Cash Cows: 3 Series; Question Marks: Motorcycles; Dogs: Compact Cars
Kellogg’s: Stars: Special K; Cash Cows: Corn Flakes; Question Marks: Pringles; Dogs: Kashi
Heinz: Stars: Ketchup; Cash Cows: Baked Beans; Question Marks: Organic Products; Dogs: Weight Watchers Meals
Uber: Stars: Uber Eats; Cash Cows: Ride-sharing; Question Marks: Autonomous Vehicles; Dogs: Uber Freight
Airbnb: Stars: Luxury Rentals; Cash Cows: Standard Rentals; Question Marks: Experiences; Dogs: HotelTonight
Ford: Stars: F-Series Trucks; Cash Cows: Mustang; Question Marks: Electric Vehicles; Dogs: Taurus
Sony: Stars: PlayStation; Cash Cows: Televisions; Question Marks: Smart Home Devices; Dogs: VAIO
Netflix: Stars: Original Content; Cash Cows: Subscription Service; Question Marks: Interactive Content; Dogs: DVD Rentals
IBM: Stars: Cloud Services; Cash Cows: IT Services; Question Marks: Quantum Computing; Dogs: Software Solutions
Twitter: Stars: Ads; Cash Cows: Promoted Tweets; Question Marks: Subscriptions; Dogs: Vine
Red Bull: Stars: Energy Drinks; Cash Cows: Sponsorships; Question Marks: Organic Drinks; Dogs: Cola
Canon: Stars: DSLR Cameras; Cash Cows: Printers; Question Marks: Mirrorless Cameras; Dogs: Compact Cameras
Pfizer: Stars: Vaccines; Cash Cows: Prescription Drugs; Question Marks: Over-the-counter Products; Dogs: Generic Drugs
Visa: Stars: Digital Payments; Cash Cows: Credit Card Processing; Question Marks: Crypto Solutions; Dogs: Prepaid Cards
Bcg Matrix Examples for Students
Tech Company (e.g., Apple Inc.): Stars: iPhone; Cash Cows: MacBook; Question Marks: Apple Watch; Dogs: iPod
Beverage Company (e.g., Coca-Cola): Stars: Coke Zero; Cash Cows: Classic Coke; Question Marks: Smartwater; Dogs: Tab
Search Engine Company (e.g., Google): Stars: Google Search; Cash Cows: YouTube; Question Marks: Google Glass; Dogs: Google+
Consumer Electronics Company (e.g., Samsung): Stars: Galaxy Smartphones; Cash Cows: Home Appliances; Question Marks: Smartwatches; Dogs: MP3 Players
Software Company (e.g., Microsoft): Stars: Microsoft Azure; Cash Cows: Microsoft Office; Question Marks: Surface Devices; Dogs: Windows Phone
Sports Apparel Company (e.g., Nike): Stars: Air Jordans; Cash Cows: Running Shoes; Question Marks: Sportswear; Dogs: Golf Equipment
E-commerce Company (e.g., Amazon): Stars: Amazon Web Services (AWS); Cash Cows: E-commerce; Question Marks: Kindle; Dogs: Amazon Fire Phone
Consumer Goods Company (e.g., Procter & Gamble): Stars: Tide; Cash Cows: Gillette; Question Marks: Old Spice; Dogs: Duracell
Entertainment Company (e.g., Disney): Stars: Disney+; Cash Cows: Theme Parks; Question Marks: ABC Network; Dogs: Disney Store
Automobile Company (e.g., Tesla): Stars: Model 3; Cash Cows: Model S; Question Marks: Solar Roof; Dogs: Roadster
Examples of Question MarksFinancial Services: A new digital banking platform in a rapidly growing fintech market but with low market share.
Pre-Construction Services: An emerging construction technology company offering innovative pre-construction services that is gaining interest in a booming construction market but has not yet captured significant market share.
Service List: A startup offering a novel set of services in a high-growth industry, such as renewable energy consulting, with significant growth potential but currently low market penetration.
How to make a strategic BCG matrix in Marketing?
Step 1: Identify Your Products or Business Units
List all the products, services, or business units within your company. This will be the basis for analysis in the BCG Matrix.
Step 2: Gather Data
Conduct a Research Survey to collect data on market growth rates, market share, and other relevant metrics for each product or business unit. This data will be crucial in positioning them accurately within the matrix.
Step 3: Determine Market Growth Rate
Calculate the market growth rate for each product or business unit. Market growth rate represents the overall industry growth, indicating how quickly the market is expanding.
Step 4: Calculate Relative Market Share
Determine the relative market share for each product or business unit. This is the product’s market share compared to the largest competitor in the industry.
Step 5: Create the BCG Matrix
Draw a 2×2 grid. Label the vertical axis as “Market Growth Rate” and the horizontal axis as “Relative Market Share.” Divide the grid into four quadrants:
Stars: High market growth, high market share
Cash Cows: Low market growth, high market share
Question Marks: High market growth, low market share
Dogs: Low market growth, low market share
Step 6: Position Products on the Matrix
Using the data from your research, plot each product or business unit in the appropriate quadrant based on their market growth rate and relative market share.
Step 7: Analyze and Develop Strategies
Analyze the position of each product or business unit:
Stars: Invest in these products to maintain or grow market share.
Cash Cows: Maximize profits with minimal investment.
Question Marks: Evaluate potential for growth and decide whether to invest or divest.
Dogs: Consider discontinuing or restructuring these products.
Step 8: Align with Mission Statement for Marketing
Ensure your marketing strategies for each quadrant align with your company’s Mission Statement for Marketing. This will ensure consistency and focus in achieving your marketing objectives.
Step 9: Develop a Marketing Media Kit
Create a comprehensive Marketing Media Kit for products identified as Stars and Cash Cows. This should include promotional materials, key messages, and media channels to effectively communicate the value of these products.
Step 10: Review and Adjust Regularly
Regularly review and adjust your BCG Matrix to reflect changes in the market and internal performance. Continuous monitoring will help maintain strategic alignment and optimize resource allocation.
What Are the 4 Quadrants of the BCG Matrix?
1. Stars
High Market Growth, High Market Share
Characteristics: Products in the Stars quadrant are leaders in fast-growing markets. They have a high market share and generate significant revenue.
Strategy: Invest in Stars to maintain or grow market share. These products require substantial investment to sustain their position and capitalize on market opportunities.
Examples: A successful new technology product or a leading brand in an expanding market.
2. Cash Cows
Low Market Growth, High Market Share
Characteristics: Products in the Cash Cows quadrant have a high market share in mature, slow-growing markets. They generate consistent, stable cash flow with minimal investment.
Strategy: Maximize profits from Cash Cows and use the generated cash to support other areas of the business, such as investing in Stars or developing Question Marks.
Examples: Established household brands or products with a dominant market position in a stable industry.
3. Question Marks
High Market Growth, Low Market Share
Characteristics: Products in the Question Marks quadrant are in high-growth markets but have a low market share. They have potential but require significant investment to increase their market share.
Strategy: Evaluate whether to invest heavily in these products to turn them into Stars or to divest if they lack potential. The decision depends on the product’s future prospects and alignment with the company’s goals.
Examples: New or emerging products with potential but not yet proven success.
4. Dogs
Low Market Growth, Low Market Share
Characteristics: Products in the Dogs quadrant have a low market share in low-growth markets. They often drain resources and generate minimal profit.
Strategy: Consider discontinuing or repositioning Dogs. These products may not be worth investing in due to their limited potential for growth and profitability.
Examples: Outdated or declining products in saturated markets.
Understanding a BCG Growth-Share Matrix
Stars
High Market Growth, High Market Share
These products are leaders in their market and have high growth potential.
Companies should invest in Stars to maintain or increase their market share.
Cash Cows
Low Market Growth, High Market Share
These products generate steady cash flow with little investment needed.
Profits from Cash Cows can be used to support other products in the portfolio.
Question Marks
High Market Growth, Low Market Share
These products have potential but require significant investment to increase market share.
Companies need to evaluate if these products can become Stars or if they should divest.
Dogs
Low Market Growth, Low Market Share
These products have limited potential and often drain resources.
Companies should consider discontinuing or repositioning these products.
Limitations of the Matrix
Simplistic Categorization
Oversimplification: The matrix simplifies complex business environments into four categories, potentially overlooking nuances and variations within each category.
Ignores Other Factors: It focuses only on market growth and relative market share, ignoring other important factors such as competitive intensity, market size, and overall industry health.
Static Analysis
Lack of Dynamism: The matrix provides a snapshot in time and does not account for the dynamic nature of markets. Changes in consumer preferences, technological advancements, and competitor actions can quickly render the analysis outdated.
Short-Term Focus: It tends to emphasize short-term performance over long-term strategic positioning and sustainability.
Limited Strategic Guidance
Ambiguous Recommendations: The matrix suggests generic strategies (invest, hold, divest) without providing detailed guidance on how to implement these strategies.
No Consideration of Synergies: It does not consider the potential synergies between different products or business units that could influence strategic decisions.
Market Growth Rate and Market Share Limitations
Relative Market Share Issues: The measure of relative market share is based on the largest competitor, which may not always be the most relevant benchmark.
Market Growth Rate Limitations: High market growth is not always indicative of attractiveness. It may come with increased competition and higher costs, which the matrix does not address.
Resource Allocation Challenges
Overemphasis on Market Leaders: The matrix encourages investing heavily in Stars and Cash Cows, potentially leading to underinvestment in innovative or niche products that do not fit neatly into the categories.
Divestment Pressure: It may pressure companies to divest from Dogs and Question Marks without considering their strategic importance or future potential.
Strategic Context Ignored
Lack of Competitive Insight: The matrix does not provide insight into competitive dynamics or the strategic moves of competitors, which are crucial for informed decision-making.
Mission Alignment: The matrix does not inherently ensure alignment with the company’s Mission Statement for Marketing or broader strategic goals.
Implementation Challenges
Data Accuracy: Accurate and reliable data on market growth rates and relative market share is essential, but can be difficult to obtain.
Subjectivity: Categorizing products can be subjective and influenced by managerial bias or incomplete information.
Ways to use a BCG matrix
1. Resource Allocation
Invest in Stars: Allocate significant resources to products in the Stars quadrant to maintain or grow their market share.
Support Cash Cows: Use the stable cash flow from Cash Cows to fund other strategic initiatives, such as developing new products or entering new markets.
Evaluate Question Marks: Assess the potential of products in the Question Marks quadrant. Decide whether to invest heavily to increase their market share or to divest.
Minimize Investment in Dogs: Reduce resources allocated to Dogs, and consider discontinuing or repositioning these products.
2. Strategic Planning
Portfolio Analysis: Use the BCG Matrix to analyze your current product portfolio. Identify which products are performing well and which need strategic changes.
Market Positioning: Determine the market position of each product. Use this information to make strategic decisions about marketing, product development, and sales efforts.
Long-Term Planning: Incorporate the insights from the BCG Matrix into your long-term strategic planning. Align product strategies with overall business objectives.
3. Identifying Growth Opportunities
Focus on High-Growth Areas: Identify products in high-growth markets (Stars and Question Marks). Develop strategies to capitalize on these growth opportunities.
Innovation and Development: Invest in innovation and development for products with high market potential. Use the matrix to prioritize R&D efforts.
4. Performance Evaluation
Benchmarking: Use the matrix to benchmark the performance of your products against competitors. Identify areas where your products lead or lag in the market.
Tracking Progress: Regularly update the matrix to track the progress of your products. Use this to monitor changes in market share and growth rates.
5. Strategic Marketing
Targeted Marketing: Develop targeted marketing campaigns based on the quadrant a product falls into. For example, invest heavily in marketing Stars, maintain marketing for Cash Cows, and experiment with marketing for Question Marks.
Messaging and Positioning: Tailor your messaging and positioning strategies for each product category. Highlight strengths and address weaknesses accordingly.
6. Financial Management
Budget Allocation: Allocate budgets based on the product’s position in the matrix. Ensure that high-potential products receive adequate funding.
Profit Maximization: Maximize profits from Cash Cows and reinvest in high-potential areas. Avoid over-investing in low-potential products.
7. Risk Management
Diversification: Use the matrix to ensure a balanced product portfolio. Avoid over-reliance on a single product category.
Exit Strategy: Identify products that may need to be discontinued or divested. Develop exit strategies for products in the Dogs quadrant to minimize losses.
8. Internal Communication
Stakeholder Alignment: Use the BCG Matrix to communicate product strategy and performance to stakeholders. Align teams around common goals and strategies.
Decision-Making Framework: Provide a clear framework for decision-making. Use the matrix to justify strategic decisions and resource allocation.
Bcg Matrix Question Mark
Question Marks in the BCG Matrix represent products or business units with low market share in high-growth markets. These products have potential but require substantial investment to increase their market share. Deciding whether to invest in or divest from these products is a crucial strategic choice for companies.
Characteristics of Question Marks
High Market Growth, Low Market Share: These products are in rapidly growing markets but currently hold a small market share. They may have the potential to become Stars if managed correctly.
High Investment Needs: To gain a larger market share, Question Marks require significant financial resources and strategic initiatives.
Uncertain Future: These products can either become profitable Stars or fail and turn into Dogs, depending on the company’s investment decisions and market dynamics.
Strategic Considerations for Question Marks
Investment Decisions: Companies need to evaluate the potential of Question Marks carefully. This involves analyzing market trends, competitive landscape, and internal capabilities.
Financial Service: Securing adequate financial services is crucial to support the high investment needs of Question Marks. This includes funding for marketing, product development, and expansion.
Pre-Construction Services: For industries like real estate or construction, pre-construction services such as planning, feasibility studies, and securing permits are essential to lay the groundwork for turning Question Marks into Stars.
Service List: Developing a comprehensive service list that addresses all aspects of the product lifecycle can help streamline operations and improve the chances of success for Question Marks.
Who developed the BCG Matrix?
The Boston Consulting Group developed the BCG Matrix in the 1970s.
What are the four quadrants of the BCG Matrix?
The four quadrants are Stars, Cash Cows, Question Marks, and Dogs.
How do Stars differ from Cash Cows?
Stars have high market growth and share, while Cash Cows have high share but low growth.
What characterizes Question Marks?
Question Marks have low market share in high-growth markets, requiring significant investment.
Why are Dogs considered less desirable?
Dogs have low market share and low growth, often generating minimal profit.
How is market growth rate calculated?
Market growth rate is typically measured by the annual increase in industry sales.
What is relative market share?
Relative market share compares a product’s share to the largest competitor in the market.
How can the BCG Matrix aid in resource allocation?
It helps identify which products to invest in, develop, or divest.
Can the BCG Matrix apply to service industries?
Yes, it can analyze any business units or services based on growth and share.
What strategic actions are recommended for Stars?
Invest to maintain or increase market share and capitalize on growth opportunities.