Timeline Chart Examples to Download

It’s much easier to assess the development of an activity or event when a timeline chart projects their details. These charts clearly demonstrate what phases are already in the past, what is currently in progress, and what will happen in the future. To design a timeline chart the right way, using pre-made timeline templates can save time and ensure a clean, professional layout. Read on below for more information and tips on how to make the most of these templates.
15+ Timeline Chart Templates
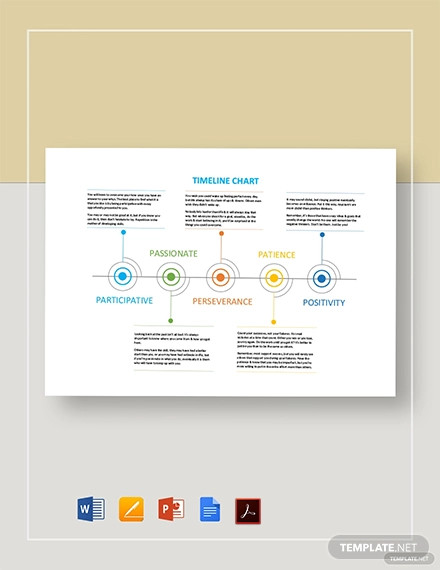
Timeline Chart Template Example
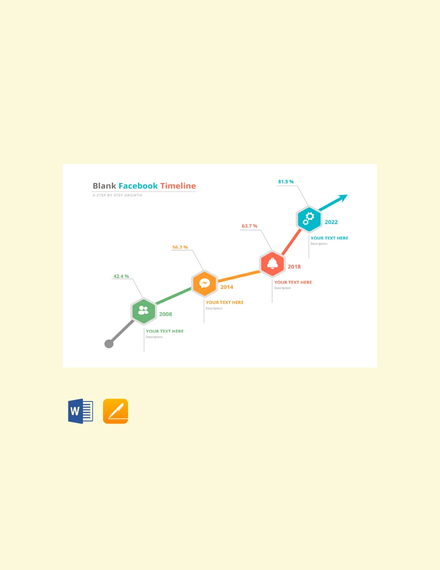
Blank Facebook Timeline Chart
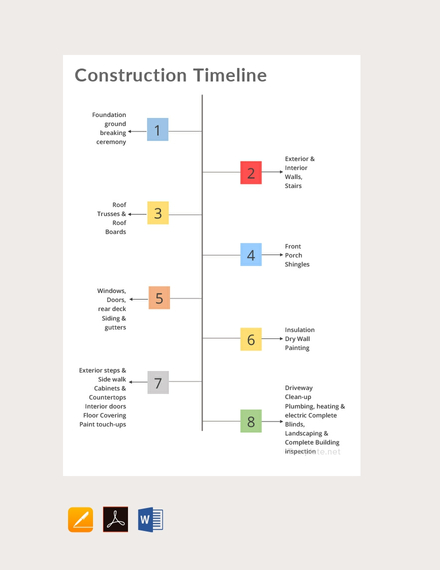
Construction Timeline Chart
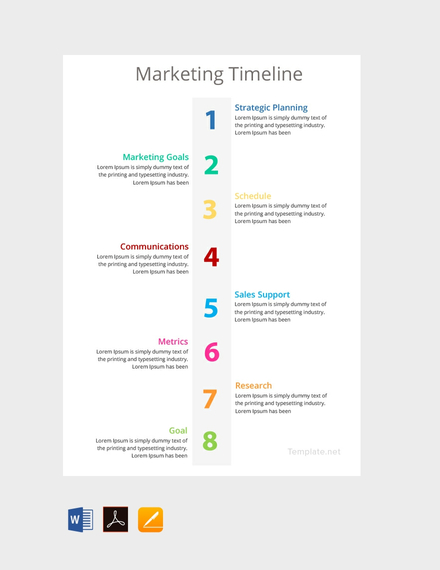
Marketing Timeline Chart
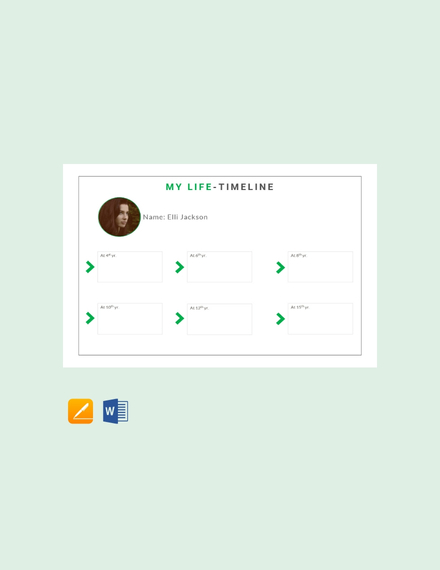
My Life Timeline Chart
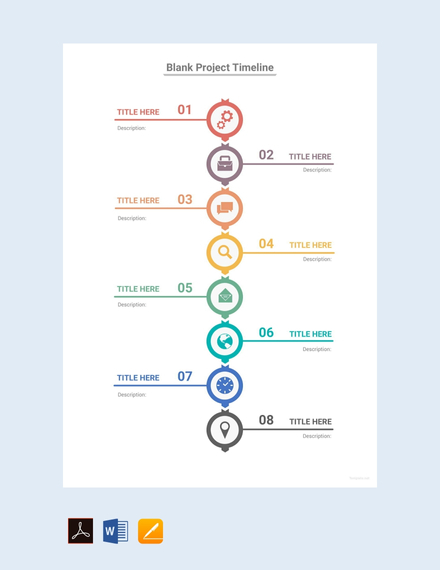
Project Timeline Chart
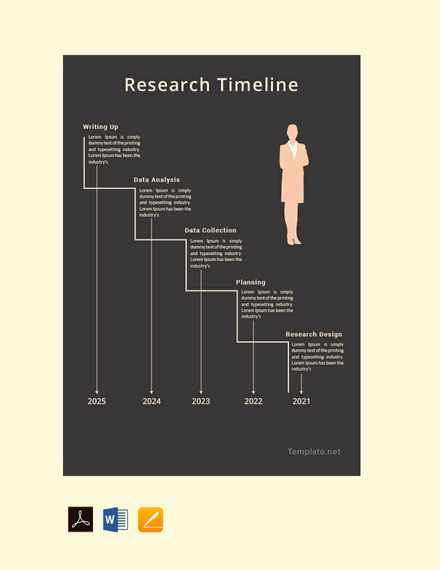
Research Timeline Chart
Timeline Chart Design
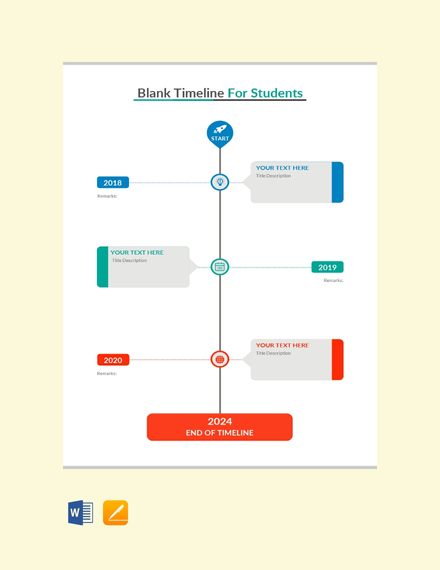
Timeline Chart Template for Students
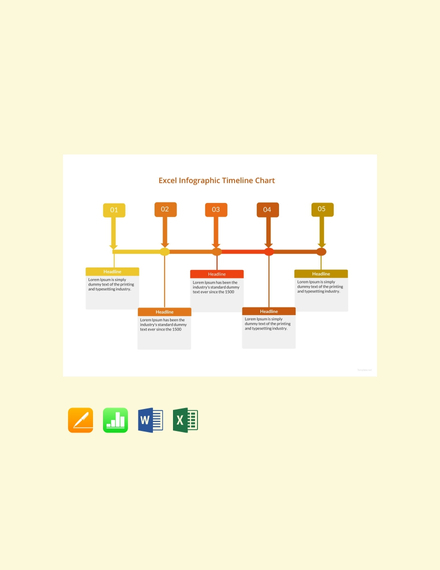
Timeline Infographic Chart
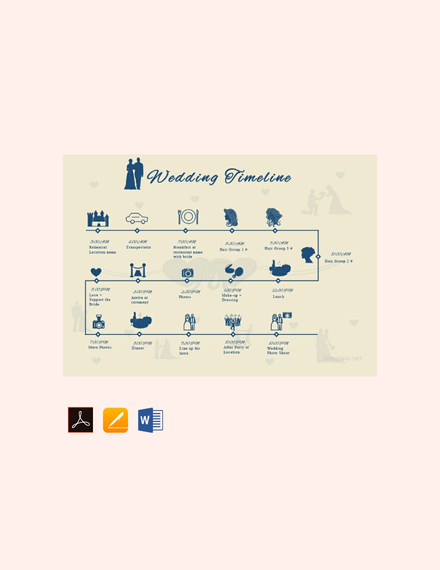
Wedding Timeline Chart
Cost per Genome Timeline Chart
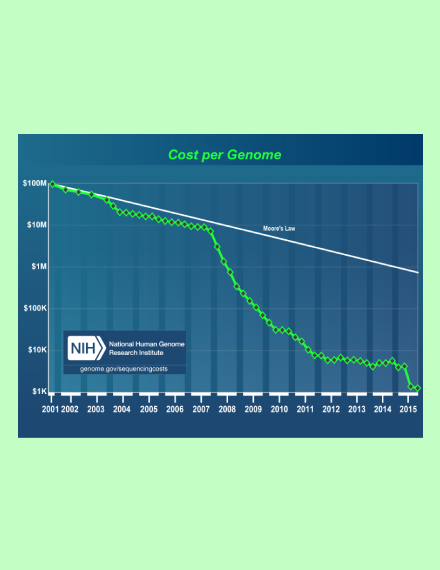 genome.gov
Global Temperature Timeline Chart
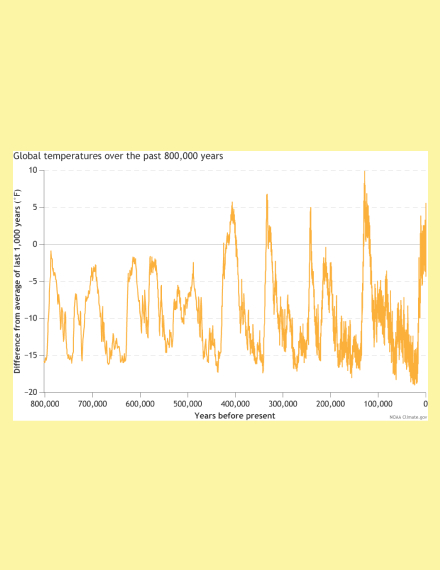 climate.gov
Health Matters Timeline Chart
 assets.publishing.service.gov.uk
Minimum Wage Timeline Chart
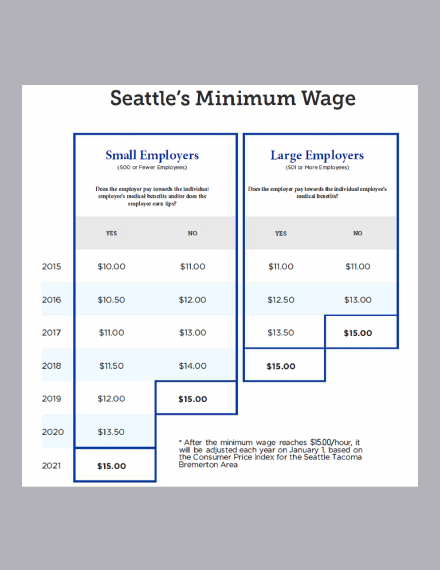 murray.seattle.gov
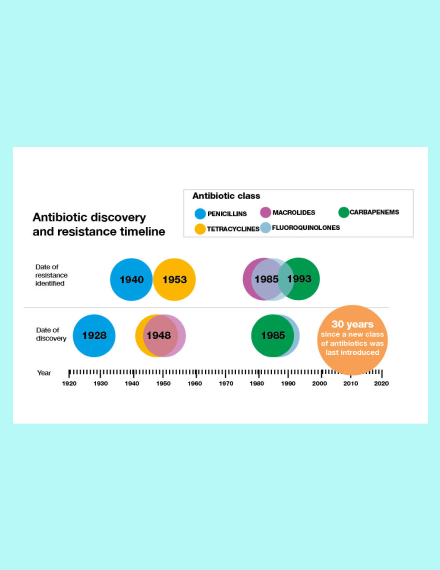
Smoking Awareness Timeline Chart
 smokefree.gov
What is a Timeline Chart?
Timeline charts are an infographic used to show the progression of a particular event or activity over time. It offers us a visual description of the past, present, and future condition of a given matter. They are an essential tool that helps project leaders, corporate managers, historians, and scientists keep track of time and educate others on the subject. Some uses of timeline charts include showcasing historical events in a creative way and the presentation of a business project’s plans.
How to Design a Timeline Chart
As mentioned in a Forbes article, timeline charts and similar tools can be great helping people visualize and plan whatever ideas they have. While there are many ways to create a timeline chart, one of the most efficient methods you could use is through the widely popular application Microsoft Excel. Refer to the guidelines below and you’ll be on your way.
1. Know What Your Topic Is
Before you start designing your timeline chart. First find out what the topic is about. Whether you are doing a timeline of a construction project or the natural development of kids as they age, once you know your topic it will be easy for you to gather ideas for your timeline chart.
2. Choose Your Design
The next step in creating your timeline chart is to choose what design you are going to present your information. For starters, some people go for the gantt chart as it is popular to use for professional projects. You can also contain your written words by putting them in a bubble design.
3. List of Key Events and Dates
Note down important events that are relevant to your timeline. These items are milestones added to create the chart. Once you have listed these items, create a table out of them and specify their respective due dates beside it.
4. Use Color Coding
A great way to highlight significant time points in your chart is to use a variation of colors. Be sure to choose your colors carefully, as you wouldn’t want to make it difficult for your audience to read each data entry.
FAQs
How can I make a timeline chart?
If you’re having trouble creating your chart, consider using a template instead. You can customize the templates to meet your exact requirements using a software application that it is compatible with. That way, you can focus on styling your timeline chart to make it easy to comprehend.
What is a chronology chart timeline?
In this type of chart, events are in a chronological sequence from left to right. This demonstrates a succession of actions and events that took place within a specified period of time. Chronology timelines are most common for making historical timelines as well.
Why is a timeline chart important?
These charts help illustrate time-related metrics, synchronize tasks, set deadlines, and define potential delays to complete an assignment in due time. This is why project managers and other leaders opt to use a timeline chart to relay these kind of information to their audience.
Humans like to organize information in a chronological manner when they can. That is why timeline charts are quite popular when it comes to presenting data. If you need more ideas on how to make your own timeline charts you can take a look at our other timeline and flow chart templates to gain inspiration.
Share :
