7+ Color Chart Examples to Download
There are different types of charts that we use to represent a particular data. Basic charts include pie charts, flow charts, behavioral charts, and so much more. All of which are designed for a specific purpose.
One common example is a color chart. There may have been instances in your life where you have encountered a typical color chart. This could be in picking the perfect prom dress, deciding on the right hair color, or even choosing the right shade for the walls in your room. Whatever the reason may be, color charts are more useful than we thought.
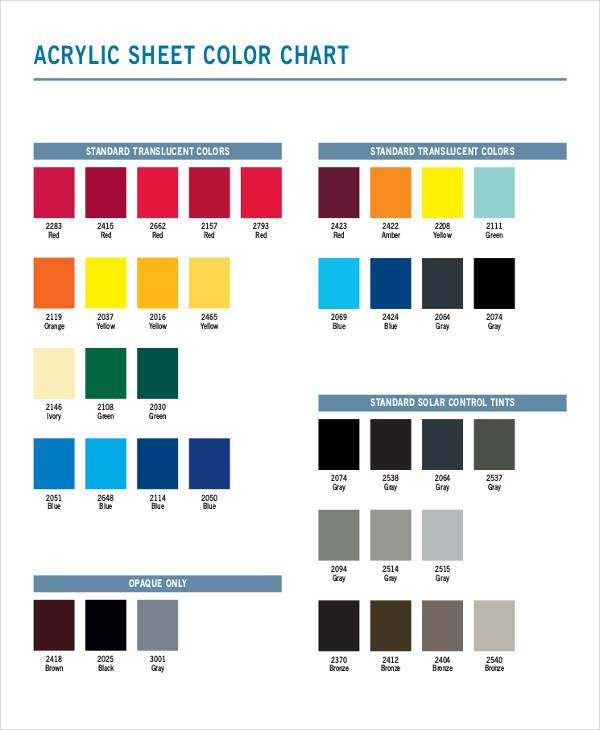
Acrylic Color Chart
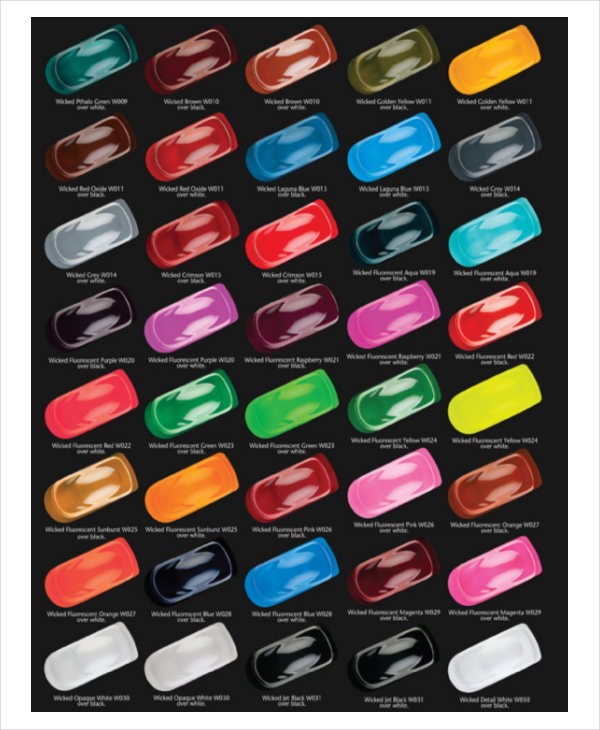
Wicked Colors Sample
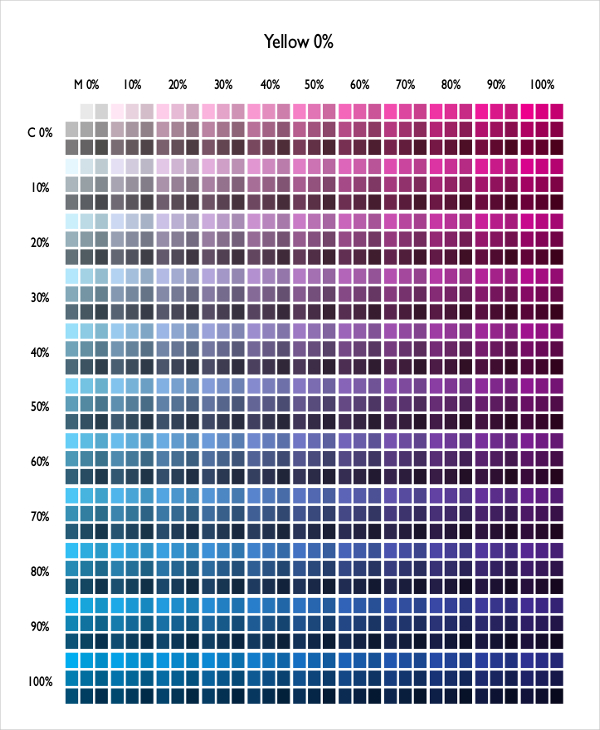
CMYK Color Chart
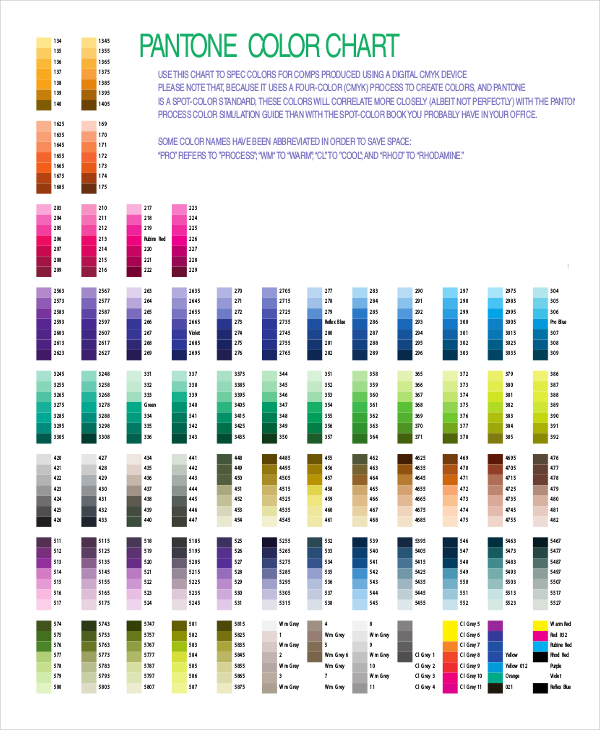
Pantone Color Example
What Is a Color Chart?
A color chart contains a systematic arrangement of a series of color samples. They typically come in the form of a one-page chart, a swatch book, or even in a fan-type. Color charts consist of a large variety of cool to warm colors and their similar hues. They are labeled according to their color names or color codes. This is just one of the many sample chart examples that is used as a guide in drawing accurate conclusions.
How to Make a Color Chart
A color chart is nothing like a bar chart as it is not used to represent statistical data. Instead, it consists of color that are organized according to their respective categories.
To make a color chart, you need the proper medium. Although modern technology has made our lives easier with special online software, color charts can still be made through experimenting with common art supplies. To do so, you can display the colors by row.
They must be sectioned according to their hues. It’s also important to label them with their color names and their corresponding color codes.
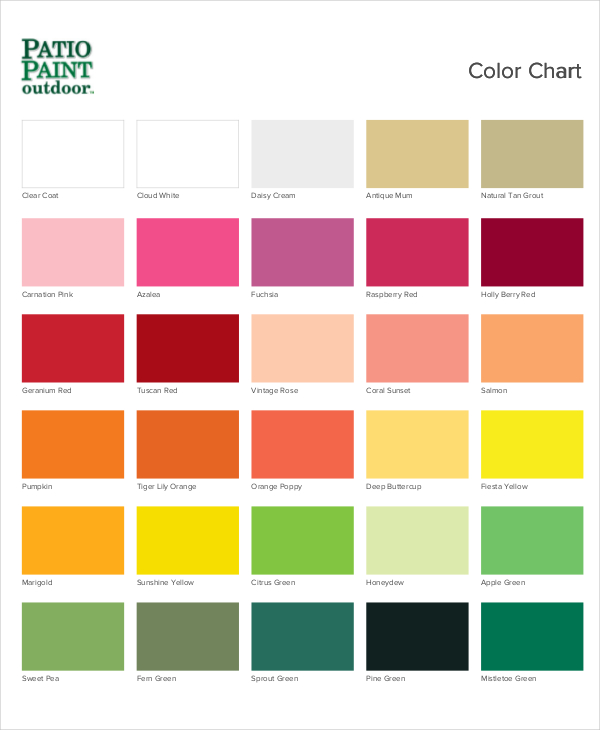
Paint Color Chart
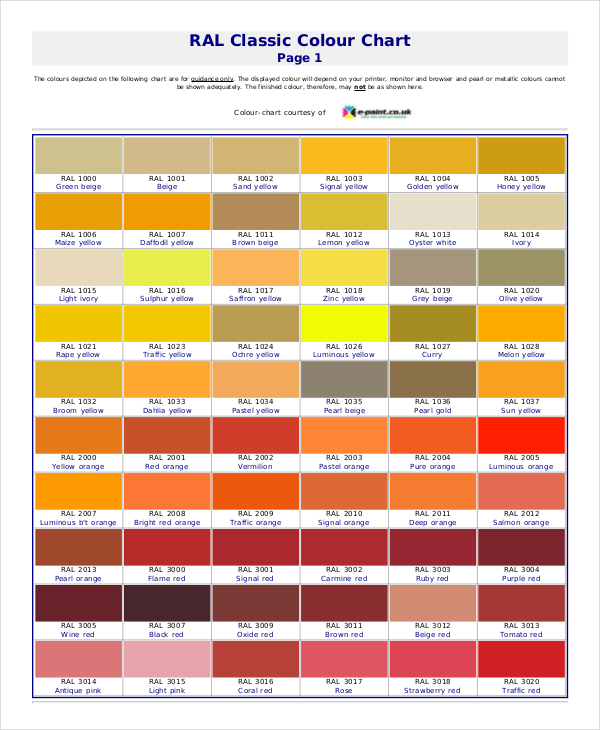
RAL Color Example
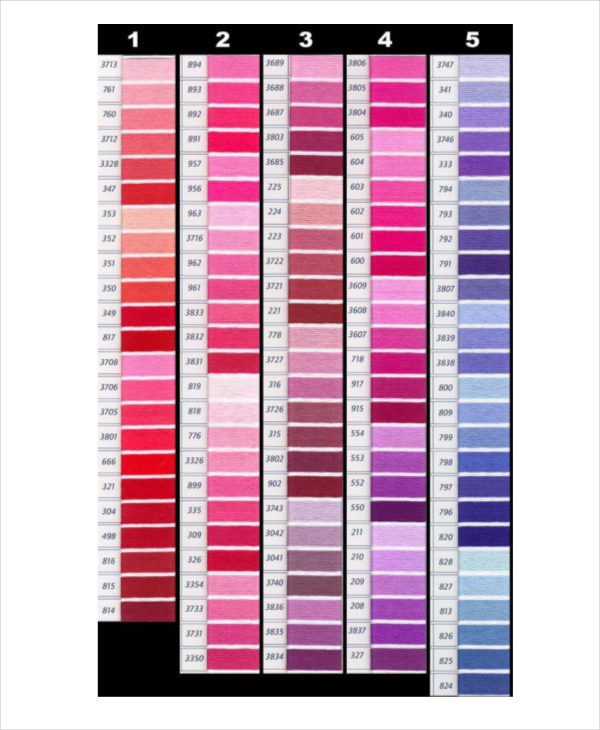
DMC Floss Color Chart
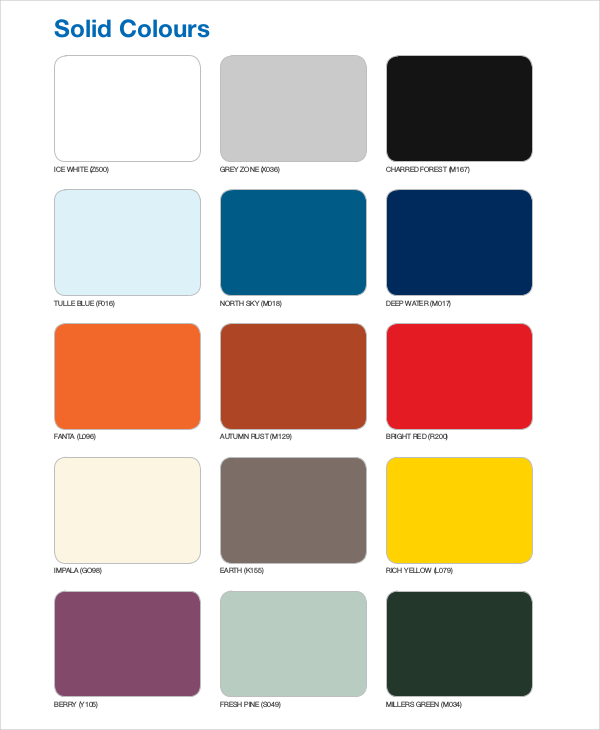
Ceramapanel Colour Sample
Purpose of a Color Chart
For artists, fashion designers, interior designers, and the like, color charts are as useful as they are satisfying in determining the perfect color schemes for a design.
Our knowledge for colors may only be limited to what we see in a box of crayons that we’re often oblivious to the fact that a certain color can actually come in a wide range of shades.
Color charts are intended to check and to draw color comparisons for imaging systems, such as image editing and the like. They could also be used for medical purposes, especially in urine testing. There are printable chart examples in word format that can be used as a reference.
How Is a Color Chart Different from a Normal Chart?
A color chart differs from a regular chart as it does not display measurements nor does it provide statistics. For instance, a size chart displays size labels and their corresponding measurement values.
With the data provided, it’s easy to see the difference between each data as they are displayed in numbers. A color chart, on the other hand, simply displays a chart of colors. It relies on a visual representation for one to assess the difference of each color.


