10+ Data Analysis Examples to Download
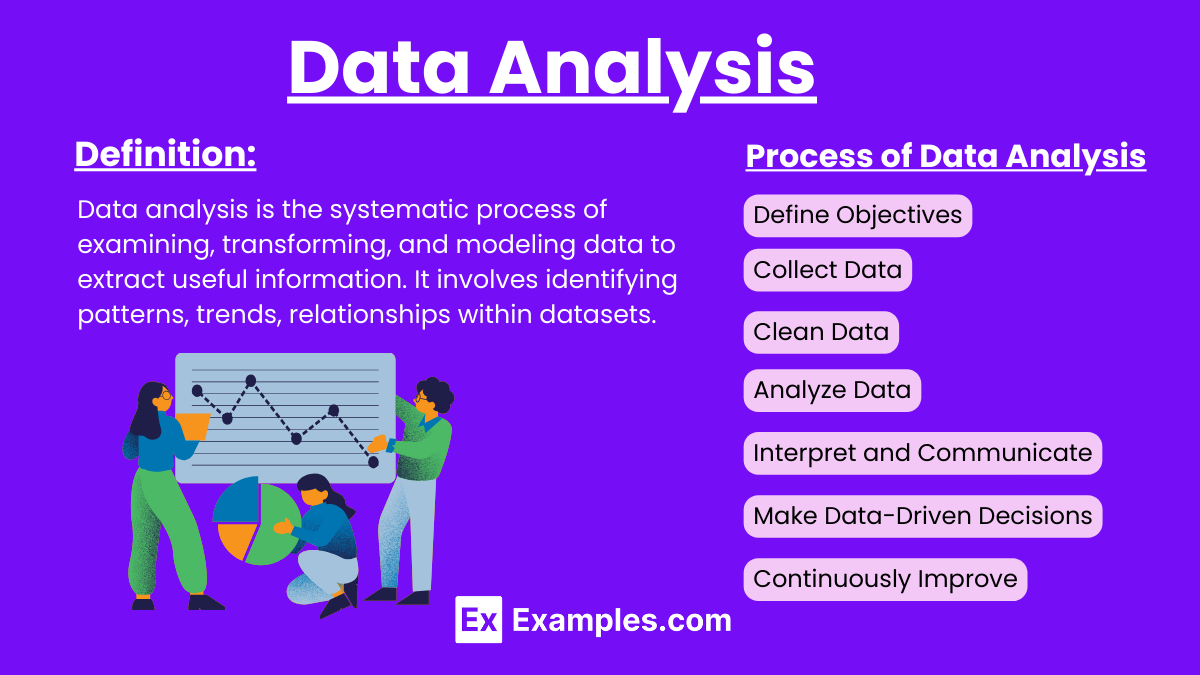
Data analysis involves examining, cleaning, transforming, and modeling data to discover useful information, draw conclusions, and support decision-making. In business, data analysis helps optimize operations, identify market trends, and improve customer experiences. Payment data analysis enhances security, detects fraud, and streamlines transaction processes. In marketing, analyzing data drives targeted campaigns, measures effectiveness, and boosts ROI. Leveraging data analysis across these areas leads to more informed strategies and better overall performance.
What Is Data Analysis?
Examples of Data Analysis
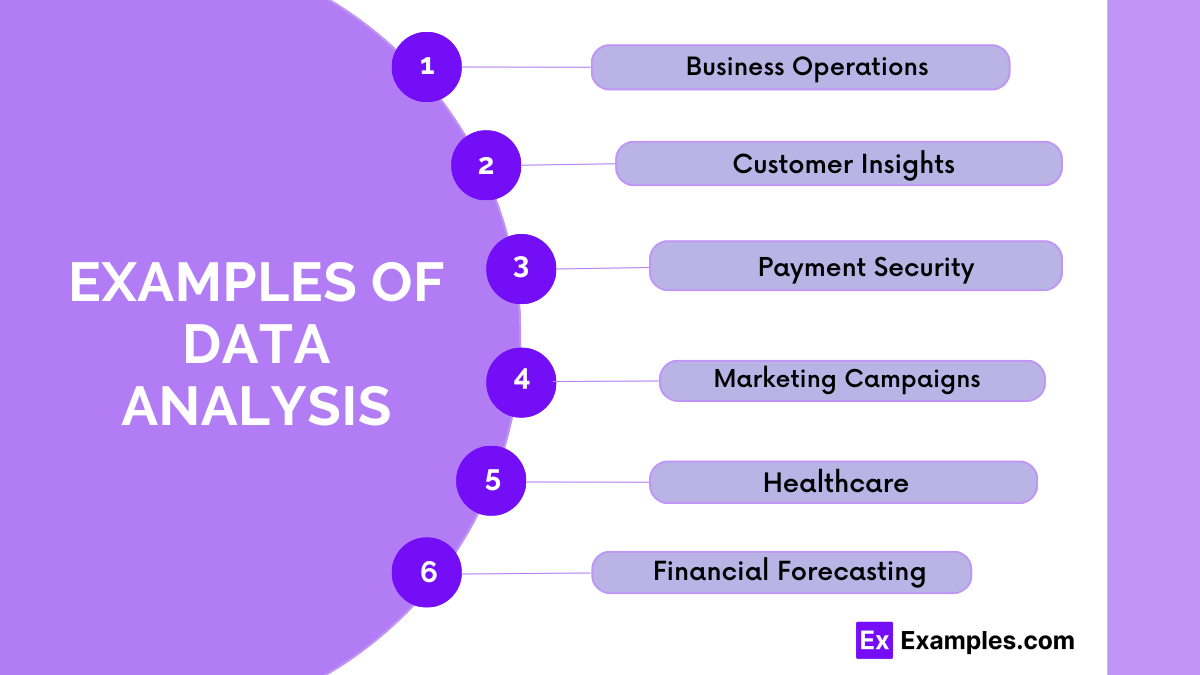
Business Operations: A retail store analyzes sales data to identify the best-selling products and adjust inventory levels accordingly. This helps avoid overstocking or understocking items.
Customer Insights: An e-commerce company uses customer purchase data to understand shopping behavior and recommend personalized products, increasing sales and customer satisfaction.
Payment Security: Banks analyze transaction data to detect fraudulent activities. By spotting unusual patterns, they can prevent unauthorized transactions and protect customer accounts.
Marketing Campaigns: A marketing team evaluates the performance of their campaigns by analyzing click-through rates, conversion rates, and customer engagement. This helps refine strategies and improve ROI.
Healthcare: In the Healthcare Market Research Hospitals analyze patient data to track the effectiveness of treatments and identify trends in disease outbreaks, leading to better patient care and proactive health measures.
Financial Forecasting: Companies analyze historical financial data to predict future revenue and expenses, aiding in budget planning and financial decision-making.
Supply Chain Management: Manufacturers analyze supply chain data to optimize production schedules, reduce costs, and improve delivery times.
Social Media Analytics: Brands analyze social media data to understand audience sentiment and engagement, helping to shape content and communication strategies.
Website Performance: Website owners use data analysis to track user behavior, such as page views and bounce rates, to improve site design and user experience.
Education: Schools analyze student performance data to identify areas where students struggle and implement targeted interventions to improve learning outcomes.
Sales Forecasting: Using historical sales data to predict future sales and plan inventory and marketing efforts.
Sentiment Analysis: Evaluating customer reviews, social media posts, and feedback to understand public opinion and improve products or services.
Market Basket Analysis: Examining purchase data to identify products frequently bought together, helping to optimize product placement and promotions.
Operational Efficiency: Analyzing production data to identify bottlenecks, streamline processes, and improve overall efficiency.
Fraud Detection: Monitoring transaction data to identify unusual patterns that may indicate fraudulent activities.
Customer Lifetime Value (CLV): Calculating the total revenue a business can expect from a single customer account to prioritize high-value customers.
Process of Data Analysis
Define Your Goals:
Determine what you want to achieve with your data analysis. Clear objectives help focus your efforts and ensure relevant data is collected.
Collect Data:
Gather the data you need from various sources. This can include sales records, customer feedback, website analytics, or any other relevant data. Ensure your data is accurate and comprehensive.
Clean the Data:
Clean your data to remove errors, duplicates, and inconsistencies. This step is crucial for ensuring the accuracy of your analysis. Use tools like Excel, SQL, or specialized data cleaning software.
Choose the Right Tools:
Select appropriate tools and software for analyzing your data. Popular tools include Excel, Python, R, Tableau, and Power BI. Choose based on your needs and familiarity.
Analyze the Data:
Start analyzing your data using descriptive statistics to understand basic trends and patterns. Use visualizations like charts and graphs to make the data more understandable. Apply more advanced techniques like regression analysis, clustering, or machine learning as needed.
Interpret Results:
Interpret the results of your analysis to draw meaningful conclusions. Look for patterns, trends, and insights that can inform your decisions and strategies.
Communicate Findings:
Present your findings in a clear and actionable way. Use reports, dashboards, and visualizations to share insights with stakeholders. Ensure your communication is tailored to your audience’s understanding.
Make Data-Driven Decisions:
Use the insights gained from your analysis to make informed decisions. Implement changes, monitor the results, and adjust strategies as needed based on ongoing analysis.
Continuously Improve:
Data analysis is an ongoing process. Continuously collect and analyze data to refine your strategies and improve outcomes over time. Stay updated with new tools and techniques to enhance your data analysis skills.
Types of Data Analysis
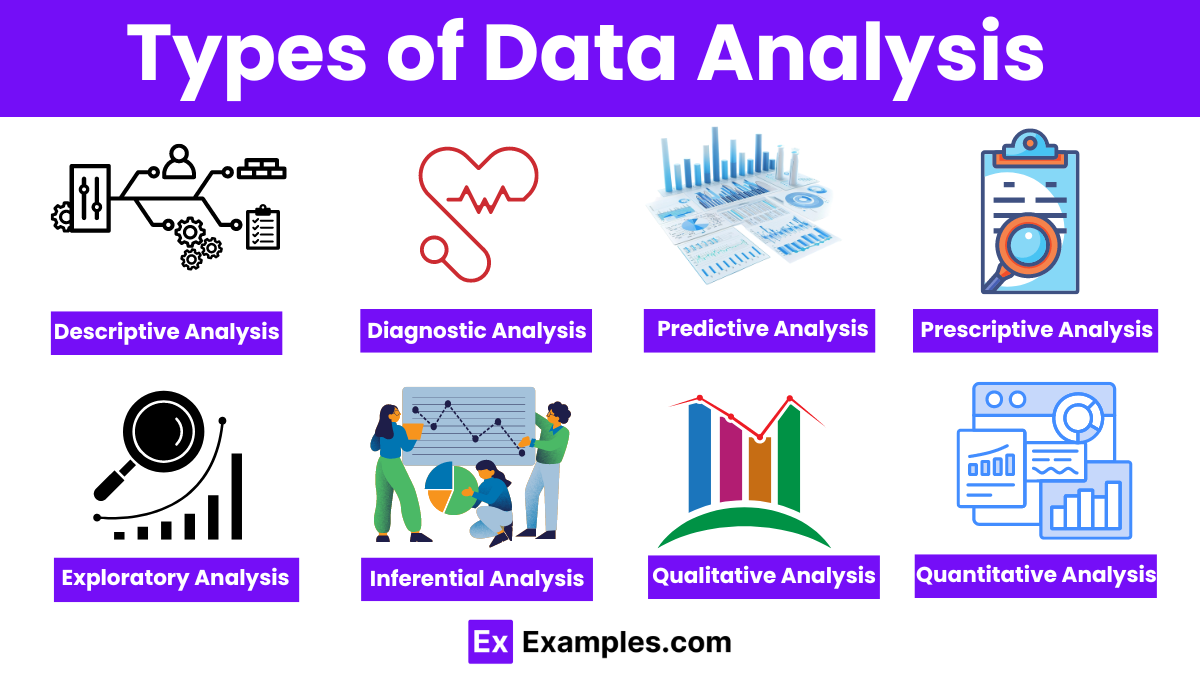
Theses are having 8 Types They are:
- Descriptive Analysis
- Diagnostic Analysis
- Predictive Analysis
- Prescriptive Analysis
- Exploratory Analysis
- Inferential Analysis
- Qualitative Analysis
- Quantitative Analysis
1. Descriptive Analysis: Descriptive analysis focuses on summarizing and describing the main features of a dataset.
- Purpose: It helps understand what has happened by using measures such as mean, median, mode, and standard deviation.
- Examples: Sales reports, average test scores, demographic statistics.
2. Diagnostic Analysis: Diagnostic analysis explores the reasons behind past outcomes.
- Purpose: It aims to identify causes and correlations by drilling down into the data.
- Examples: Analyzing customer complaints to find common issues, examining sales drops by region to identify problem areas.
3. Predictive Analysis: Predictive analysis uses historical data and statistical models to forecast future outcomes.
- Purpose: It helps predict trends, behaviors, and events to guide decision-making.
- Examples: Sales forecasting, predicting customer churn, risk assessment in Finance.
4. Prescriptive Analysis: Prescriptive analysis recommends actions based on data analysis.
- Purpose: It suggests specific actions to achieve desired outcomes by combining data insights with rules, algorithms, and machine learning.
- Examples: Recommending inventory levels, optimizing marketing campaigns, route planning for delivery services.
- 5. Exploratory Analysis: Exploratory analysis is an open-ended process to find patterns, trends, and relationships in the data.
- Purpose: It is used to uncover insights and generate hypotheses without predefined questions.
- Examples: Identifying unexpected trends in social media data, discovering new market segments.
- 6. Inferential Analysis: Inferential analysis makes inferences and predictions about a population based on a sample of data.
- Purpose: It helps generalize findings from a sample to a larger population using statistical techniques.
- Examples: Opinion polls, clinical trials, scientific research studies.
- 7. Qualitative Analysis: Qualitative analysis involves non-numeric data such as text, a, and video to understand concepts, opinions, and experiences.
- Purpose: It helps interpret complex data by identifying themes and patterns.
- Examples: Analyzing interview transcripts, coding open-ended survey responses, content analysis of social media posts.
- 8. Quantitative Analysis: Quantitative analysis deals with numerical data and statistical methods to quantify variables and relationships.
- Purpose: It helps measure and analyze data to identify patterns and test hypotheses.
- Examples: Financial analysis, survey data analysis, experimental research.
Applications of Data Analysis
Business Intelligence:
- Sales and Revenue Optimization: Companies analyze sales data to identify trends, forecast demand, and optimize pricing strategies.
- Customer Insights: Businesses use data to understand customer behavior, preferences, and feedback, improving customer satisfaction and loyalty.
Healthcare:
- Patient Care: Hospitals analyze patient data to improve diagnoses, treatment plans, and outcomes.
- Disease Tracking: Public health agencies use data analysis to track disease outbreaks and implement preventive measures.
Finance:
- Risk Management: Financial institutions analyze transaction data to assess and manage risks, such as credit risk and market volatility.
- Fraud Detection: Banks use data analysis to detect fraudulent activities by identifying unusual transaction patterns.
Marketing:
- Campaign Optimization: Marketers analyze campaign performance data to refine strategies and improve return on investment (ROI).
- Segmentation and Targeting: Companies segment their customer base using data analysis to tailor marketing efforts to specific groups.
Retail:
- Inventory Management: Retailers analyze sales and inventory data to optimize stock levels and reduce costs.
- Customer Experience: Data analysis helps in personalizing shopping experiences and improving customer service.
Education:
- Student Performance: Schools and universities analyze student data to identify areas of improvement and provide targeted support.
- Curriculum Development: Educational institutions use data to develop and refine curricula based on student needs and performance trends.
Supply Chain Management:
- Efficiency Improvement: Companies analyze supply chain data to identify bottlenecks and optimize logistics.
- Demand Forecasting: Data analysis helps predict future demand, ensuring timely and efficient production and distribution.
Human Resources:
- Recruitment: HR departments use data analysis to identify the best candidates and streamline the hiring process.
- Employee Performance: Companies analyze performance data to identify high performers and areas for employee development.
Sports Analytics:
- Performance Improvement: Teams analyze player performance data to develop strategies and training programs.
- Fan Engagement: Sports organizations use data to enhance fan experiences through personalized content and targeted marketing.
Government and Public Policy:
- Policy Making: Governments use data analysis to inform policy decisions and allocate resources effectively.
- Public Safety: Law enforcement agencies analyze crime data to develop strategies for crime prevention and response.
Energy Sector:
- Resource Management: Energy companies analyze data to optimize resource extraction and distribution.
- Renewable Energy: Data analysis helps in the efficient operation of renewable energy sources like wind and solar power.
Transportation and Logistics:
- Route Optimization: Logistics companies use data analysis to optimize delivery routes, reducing costs and improving efficiency.
- Traffic Management: Transportation agencies analyze traffic data to improve infrastructure and reduce congestion.
Top Data Analysis Techniques to Analyze Data
Descriptive Statistics:
- Descriptive statistics summarize and describe the main features of a dataset.
- Techniques: Mean, median, mode, standard deviation, and variance.
- Application: Used to get a quick overview of data, such as average sales, customer age distribution, and product ratings.
Inferential Statistics:
- Inferential statistics make inferences about a population based on a sample.
- Techniques: Hypothesis testing, confidence intervals, and regression analysis.
- Application: Used to predict trends and test hypotheses, such as determining if a new marketing strategy affects sales.
Regression Analysis:
- Regression analysis examines the relationship between variables.
- Techniques: Linear regression, multiple regression, logistic regression.
- Application: Used to predict outcomes, such as forecasting sales based on advertising spend.
Time Series Analysis:
- Time series analysis examines data points collected or recorded at specific time intervals.
- Techniques: Moving averages, exponential smoothing, ARIMA (AutoRegressive Integrated Moving Average).
- Application: Used to analyze trends and patterns over time, such as stock prices, economic indicators, and website traffic.
Clustering:
- Clustering groups data points into clusters that have similar characteristics.
- Techniques: K-means clustering, hierarchical clustering, DBSCAN (Density-Based Spatial Clustering of Applications with Noise).
- Application: Used for market segmentation, customer profiling, and image recognition.
Classification:
- Classification categorizes data into predefined classes.
- Techniques: Decision trees, random forests, support vector machines, neural networks.
- Application: Used for spam detection, credit scoring, and medical diagnosis.
Association Rule Learning:
- Association rule learning identifies relationships between variables in large datasets.
- Techniques: Apriori algorithm, Eclat algorithm, FP-Growth algorithm.
- Application: Used for market basket analysis, recommendation systems, and cross-selling strategies.
Data Mining:
- Data mining extracts useful information from large datasets.
- Techniques: Anomaly detection, pattern recognition, and text mining.
- Application: Used in fraud detection, customer relationship management, and sentiment analysis.
Principal Component Analysis (PCA):
- PCA reduces the dimensionality of a dataset while preserving as much variability as possible.
- Techniques: Eigenvalues and eigenvectors, covariance matrix.
- Application: Used for feature extraction, data visualization, and noise reduction.
Neural Networks and Deep Learning:
- Neural networks and deep learning models simulate the human brain to recognize patterns and make decisions.
- Techniques: Feedforward neural networks, convolutional neural networks (CNNs), recurrent neural networks (RNNs).
- Application: Used for image and speech recognition, natural language processing, and autonomous driving.
Text Analysis and Natural Language Processing (NLP):
- Text analysis and NLP analyze and understand human language.
- Techniques: Sentiment analysis, topic modeling, entity recognition.
- Application: Used for analyzing customer reviews, social media monitoring, and chatbots.
Sentiment Analysis:
- Sentiment analysis determines the emotional tone behind a body of text.
- Techniques: Lexicon-based approaches, machine learning classifiers.
- Application: Used for brand monitoring, customer feedback analysis, and market research.
What Is the Importance of Data Analysis in Research?
Informed Decision-Making:
Data analysis provides a factual basis for making decisions. By analyzing data, researchers can draw accurate conclusions and make informed choices, reducing the reliance on intuition or guesswork.
Uncovering Patterns and Trends:
Through data analysis, researchers can identify patterns, trends, and correlations that are not immediately apparent. This helps in understanding the underlying phenomena and predicting future outcomes.
Validating Hypotheses:
Data analysis is crucial for testing hypotheses and validating theories. By analyzing collected data, researchers can confirm or refute their initial assumptions, contributing to scientific knowledge.
Enhancing Reliability and Accuracy:
Proper data analysis ensures the reliability and accuracy of research findings. By systematically examining the data, researchers can minimize errors, biases, and inconsistencies, leading to more credible results.
Identifying Relationships and Causality:
Data analysis helps in identifying relationships between variables and understanding causal links. This is essential for determining the factors that influence outcomes and for developing interventions or solutions.
Optimizing Resources:
Efficient data analysis allows researchers to make the most of their resources. By understanding which variables have the most significant impact, researchers can focus their efforts and funding on the most critical areas.
Supporting Generalization of Results:
Analyzing data helps in assessing whether the findings can be generalized to a broader population. This is important for extending the applicability of research results beyond the study sample.
Improving Quality of Research:
Data analysis enhances the overall quality of research by ensuring that conclusions are based on empirical evidence. This rigor strengthens the credibility and impact of the research.
Facilitating Data-Driven Insights:
Data analysis enables researchers to derive insights that are data-driven rather than opinion-based. These insights are valuable for advancing knowledge and guiding future research directions.
Enhancing Communication and Presentation:
Analyzing data allows researchers to present their findings in a clear and understandable manner. Visualizations such as charts, graphs, and tables make complex data more accessible to stakeholders.
Enabling Continuous Improvement:
Data analysis allows researchers to continuously refine and improve their methodologies. By analyzing data from different stages of the research, they can identify areas for improvement and adapt their strategies accordingly.
Ethical and Transparent Research:
Proper data analysis ensures that research findings are reported accurately and transparently. This is crucial for maintaining ethical standards and fostering trust in the research community.
Why Is Data Analysis Important
Informed Decision-Making:
Data analysis provides a factual basis for making decisions, reducing reliance on intuition or guesswork.
- Importance: It enables organizations and individuals to make well-informed choices by understanding and interpreting data accurately.
Identifying Trends and Patterns:
Analyzing data helps uncover trends, patterns, and relationships that are not immediately apparent.
- Importance: This insight is crucial for predicting future outcomes and making proactive decisions.
Validating Hypotheses and Theories:
Data analysis is essential for testing and validating hypotheses and theories.
- Importance: It provides empirical evidence that supports or refutes assumptions, contributing to scientific and academic research.
Enhancing Efficiency and Productivity:
Data analysis helps identify inefficiencies and areas for improvement.
- Importance: By optimizing processes based on data insights, organizations can increase productivity and reduce costs.
Improving Customer Understanding and Satisfaction:
Analyzing customer data provides insights into preferences, behaviors, and feedback.
- Importance: This understanding helps tailor products, services, and marketing efforts to better meet customer needs and enhance satisfaction.
Risk Management:
- Data analysis assesses risks by identifying potential issues and predicting their impact.
- Importance: It helps organizations mitigate risks by developing strategies to prevent or minimize adverse effects.
Driving Innovation and Growth:
Analyzing data can reveal new opportunities and areas for innovation.
- Importance: Organizations can leverage these insights to develop new products, services, and business models, driving growth.
Supporting Policy and Strategy Development:
Data analysis informs the development of policies and strategies by providing evidence-based insights.
- Importance: It ensures that policies and strategies are grounded in reality and are more likely to achieve desired outcomes.
Enhancing Financial Performance:
Financial data analysis helps track performance, forecast trends, and optimize budgeting.
- Importance: Organizations can make better financial decisions, improve profitability, and manage resources more effectively.
Ensuring Compliance and Regulatory Adherence:
Analyzing data ensures compliance with laws and regulations.
- Importance: It helps organizations avoid legal issues and maintain good standing with regulatory bodies.
Improving Healthcare Outcomes:
Data analysis in healthcare tracks patient outcomes, diagnoses, and treatment effectiveness.
- Importance: It leads to better patient care, early detection of diseases, and more effective treatment plans.
Optimizing Supply Chain Management:
Analyzing supply chain data improves logistics and inventory management.
- Importance: It reduces costs, improves delivery times, and ensures a more efficient supply chain.
Facilitating Educational Improvements:
Educational Needs Assessment use data analysis to track student performance and curriculum effectiveness.
- Importance: It helps identify areas for improvement and tailor educational approaches to better meet student needs.
Enhancing Marketing Strategies:
Data analysis evaluates the effectiveness of marketing campaigns and customer engagement.
- Importance: It enables marketers to optimize strategies, increase ROI, and better connect with target audiences.
What is data analysis?
Data analysis is the process of examining, cleaning, transforming, and modeling data to discover useful information, draw conclusions, and support decision-making.
Why is data analysis important?
Data analysis is essential for informed decision-making, identifying trends and patterns, validating hypotheses, improving efficiency, understanding customers, managing risks, driving innovation, and enhancing financial performance.
What are the main types of data analysis?
The main types of data analysis include descriptive analysis, inferential analysis, predictive analysis, prescriptive analysis, exploratory analysis, and qualitative and quantitative analysis.
What tools are commonly used for data analysis?
Common tools include Excel, Python, R, SQL, Tableau, Power BI, SAS, and SPSS. These tools help in data cleaning, visualization, statistical analysis, and reporting.
What is the difference between descriptive and inferential statistics?
Descriptive statistics summarize and describe the main features of a dataset, while inferential statistics make inferences about a population based on a sample, allowing for hypothesis testing and predictions.
What is a data analyst’s role?
A data analyst collects, cleans, and interprets data to provide actionable insights. They use statistical techniques and tools to analyze data and support decision-making processes.
What are some common data analysis techniques?
Common techniques include regression analysis, clustering, classification, time series analysis, association rule learning, principal component analysis (PCA), and sentiment analysis.
How does data analysis benefit businesses?
Data analysis helps businesses optimize operations, enhance customer understanding and satisfaction, improve marketing strategies, manage risks, and drive innovation and growth.
What is predictive analysis?
Predictive analysis uses historical data and statistical models to forecast future outcomes. It helps in anticipating trends, behaviors, and events to guide decision-making.
How do you ensure data quality during analysis?
Ensuring data quality involves data cleaning (removing errors, duplicates, and inconsistencies), validating data accuracy, and using reliable data sources. Proper documentation and regular audits also help maintain data quality.
Share :
