7+ Excel for Financial Analysis Examples to Download
A financial analyst is someone who evaluates the financial condition of a business or a company to decide whether it is an appropriate investment. He/ she makes sure that the financial decisions are taken correctly and is fruitful to the company. Therefore the skills that a financial analyst is expected to possess are :
- know the keyboard shortcuts
- know to navigate Excel in a quick manner
- know about Pivot skills
- know about pivot charts
- should be able to make a quick analysis
The Types of Financial Analysis
-
Vertical
In this kind of financial analysis, you need to look at the various components of the income statement which is divided into revenue in the form of a percentage.
-
Horizontal
The horizontal financial analysis is about taking the financial data for several years and then make a comparison with each other to determine the growth rate. This will help the analyst in deciding whether a company is growing or shrinking.
-
Leverage
This is one of the most important methods that an analyst uses to assess the performance of a company. The leverage ratios help
-
Growth
To assess the past growth rates, and at the same time analysing the future growth rates is an important part of the job of an analyst.
-
Profitability
Profitability analysis is a kind of income statement analysis, in which an analyst analyses how attractive the economics of a business are.
-
Liquidity
This kind of financial analysis focuses on a company’s capability to meet short term (less than a year) obligations.
-
Efficiency
This is a kind of financial analysis that helps to know the ways in which a company manages its assets and uses it to originate revenue and cash flow
-
Cash flow
Cash is the most important element in the finance of any company statement. So an analysts’ job in looking after the cash flow profiles of the companies is very important.
-
Sensitivity Analysis
Performing sensitivity analysis helps to know the worst and the best cases that the finance of the company reach or land at. So to build the scenarios and creating the sensitivity analysis is very important.
-
Rates of Return
Ultimately it is the rate of return that the investors or any other financial professionals are focused on, which they can earn on their money. So the assessment of the rate of return on investment is important.
-
Valuation
To know the value and the worth of a business is an important task of an analyst. Therefore financial models in Excel are made, to estimate and know the worth of any business.
-
Variance
In this analysis, you compare the actual results to a budget and financial forecasting. It is a very important part of internal planning and the process of budgeting, especially for the people working in the budgeting and the finance departments.
7+ Excel for Financial Analysis Examples
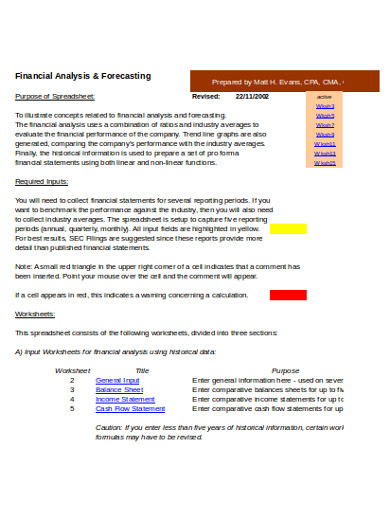
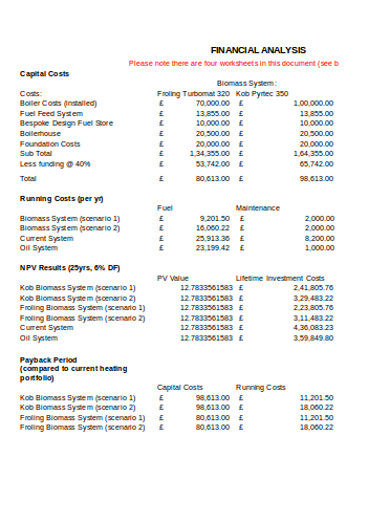
1. Financial Analysis and Forecasting Example
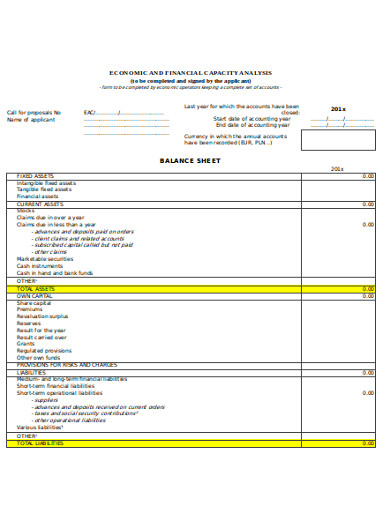
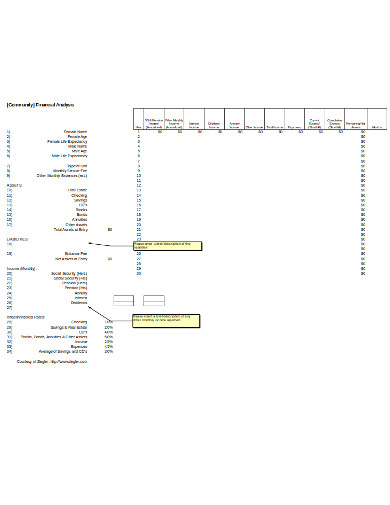
2. Economic and Financial Capacity Analysis Example
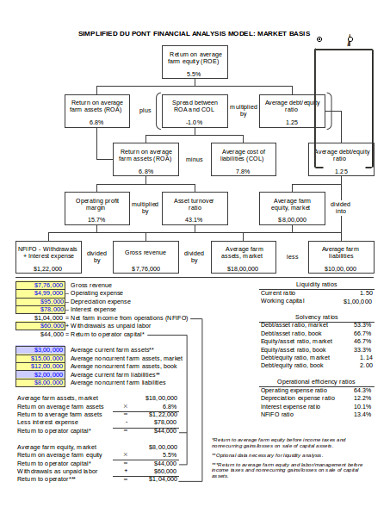
3. Financial Market Analysis Example
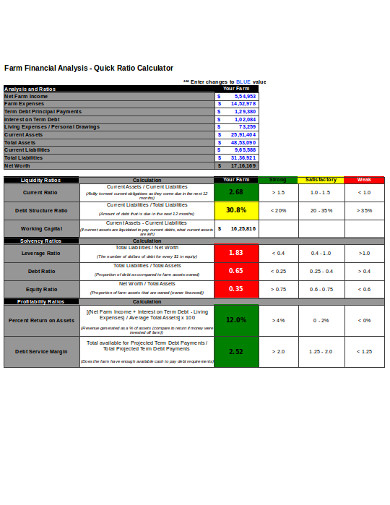
4. Financial Ratio Analysis Examples
5. Sample Financial Analysis Examples
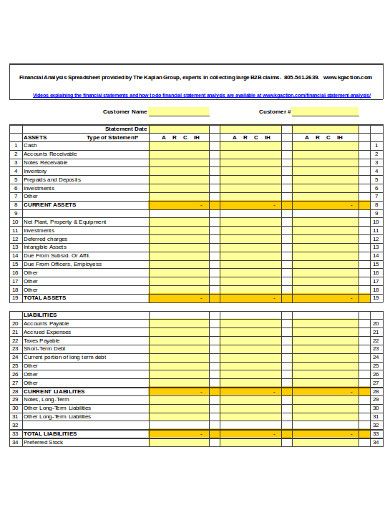
6. Financial Analysis Spreadsheet Example
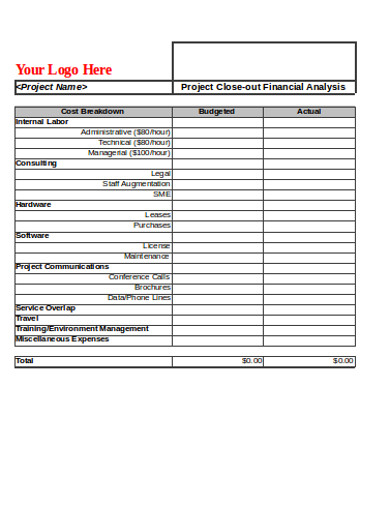
7. Financial Analysis Template
8. Financial Analysis Logo Example
How to Perform an Effective Financial Analysis?
Step 1: Identify the Economic Characteristics of the Industry
You need to know the activities that are involved in the various production processes of the firm.
Step 2: Know the Strategies of the Company
Then you need to know the strategies of the company. The quality of the product/ service that the firm is offering, the uniqueness of the product, the profit earned, etc.
Step 3: Quality of the Firm’s Financial Statements
Then you need to evaluate the key financial statements of the firm. The income statement, the cash flow statement, etc. needs to be evaluated and assessed.
Step 4: Current Position of Risk and Profit
The business
Step 5: Forecast Financial Statement
The financial professionals must try to make legit assumptions about the future of the firm. The forecast needs to be reasonable and also determine how it is going to affect the cash flows and funding.
The Components of Financial Analysis
-
Income Statement
An income statement reflects the financial performance of the company. It will also let you know the profit earned during that particular time period. This also helps to know the future performance and the cash flow that might occur in the future.
-
Balance Sheet
The balance sheet reflects the company’s assets, liabilities at a specific point in time. For that, you need to know the assets, the liabilities and the equity too.
-
Cash Flow Statement
Through a cash flow statement, you will be able to know the amount of cash that originated in a particular period of time.


