Fishbone Diagram – Examples, Types, Digital Tools, Benefits
A Fishbone Diagram, also known as an Ishikawa or cause-and-effect diagram, is a visual tool used for critical thinking and problem-solving. It helps identify the root causes of a problem by organizing potential contributing factors into categories resembling a fish’s skeleton. This method enhances critical thinking by encouraging thorough analysis and structured brainstorming, making it easier to pinpoint underlying issues and develop effective solutions. Ideal for quality management, it fosters a deeper understanding of complex problems.
What is Fishbone Diagram?
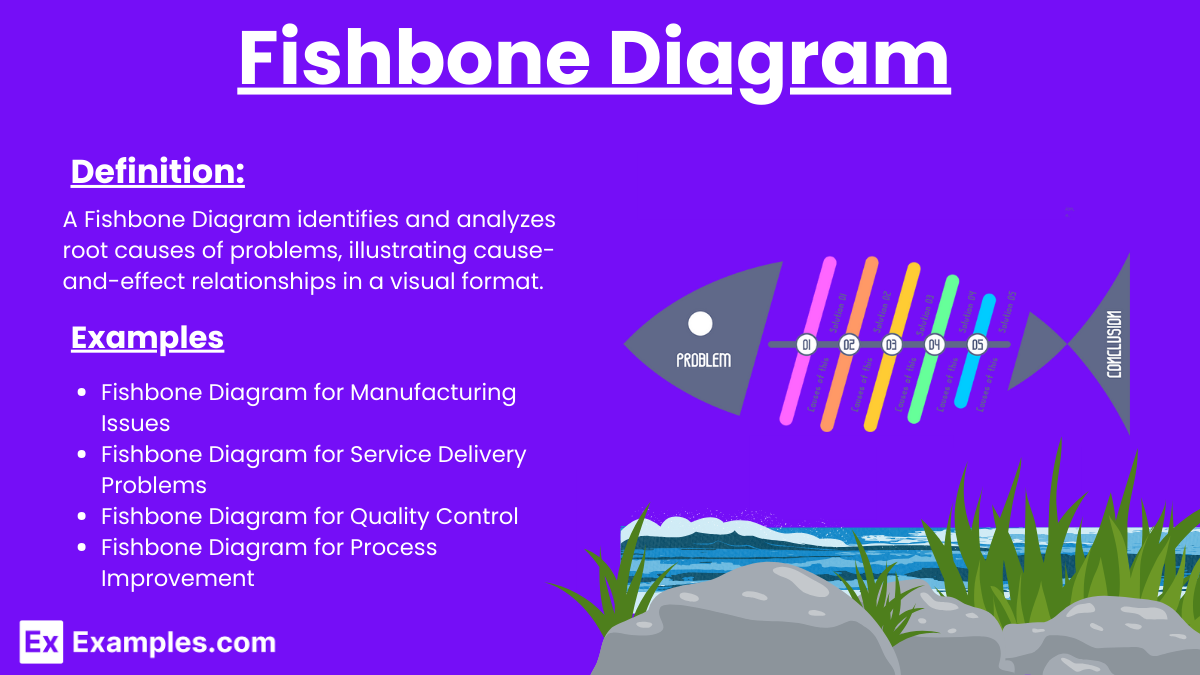
A Fishbone Diagram, or Ishikawa Diagram, is a visual tool for identifying root causes of a problem. Shaped like a fish skeleton, it organizes potential causes into categories, facilitating structured analysis and critical thinking in problem-solving processes.
Fishbone Diagram Example
- Fishbone Diagram for Manufacturing Issues – Identifies causes like machine faults, manpower errors, material defects, and measurement inaccuracies affecting production.
- Fishbone Diagram for Service Delivery Problems – Analyzes factors like staff training, customer expectations, service procedures, and communication affecting service quality.
- Fishbone Diagram for Quality Control – Examines causes such as testing procedures, material quality, equipment calibration, and operator skills affecting product quality.
- Fishbone Diagram for Process Improvement – Identifies bottlenecks like workflow inefficiencies, resource allocation, employee training, and technology integration impacting process efficiency.
Types of Fishbone Diagrams
- 4S Fishbone Diagram – Focuses on root causes in four categories: Surroundings, Suppliers, Systems, and Skills, commonly used in service industries.
- 5M Fishbone Diagram – Categorizes causes into Manpower, Methods, Materials, Machines, and Measurements, often used in manufacturing sectors.
- 6M Fishbone Diagram – Expands to Manpower, Methods, Materials, Machines, Measurements, and Mother Nature (environment), useful for comprehensive problem analysis.
- 8P Fishbone Diagram – Analyzes problems using eight categories: Product, Price, Place, Promotion, People, Process, Physical Evidence, and Performance, ideal for marketing.
Digital Tools and Software For Fishbone Diagram creation
- Lucidchart – An online diagramming tool offering templates for fishbone diagrams, aiding in causal research and collaborative problem-solving.
- Microsoft Visio – Provides advanced features for creating fishbone diagrams, supporting detailed causal research and professional presentations.
- Creately – A versatile tool for drawing fishbone diagrams, enhancing causal research with intuitive drag-and-drop functionality.
- SmartDraw – Software designed for creating fishbone diagrams, facilitating causal research with easy-to-use templates and customization options.
- Edraw Max – Offers comprehensive tools for fishbone diagram creation, ideal for in-depth causal research and visual data analysis.
- Miro – An online whiteboard tool that supports fishbone diagram creation, perfect for collaborative causal research and brainstorming sessions.
Fishbone Diagram Example For Students
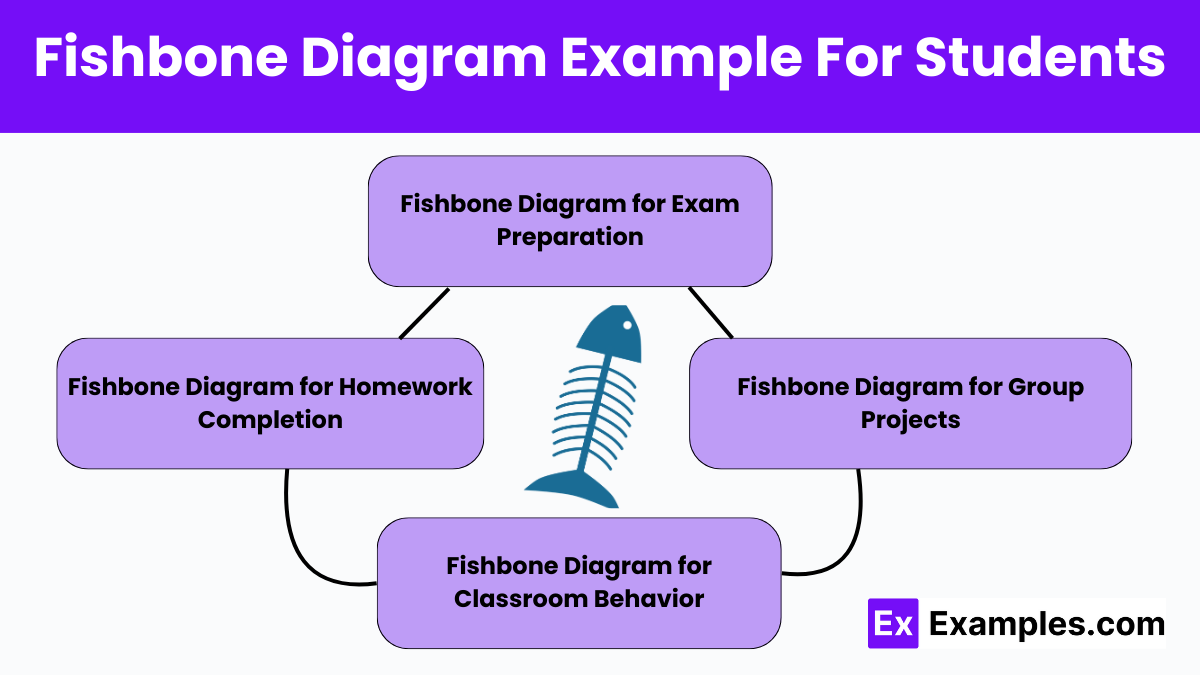
- Fishbone Diagram for Exam Preparation – Identifies causes like study habits, time management, resources, and distractions affecting students’ exam performance.
- Fishbone Diagram for Group Projects – Analyzes factors such as team communication, task division, deadlines, and resource availability impacting project success.
- Fishbone Diagram for Classroom Behavior – Examines causes like peer influence, teaching methods, classroom environment, and personal issues affecting student behavior.
- Fishbone Diagram for Homework Completion – Identifies causes and effects such as time management, understanding of material, support at home, and motivation impacting homework completion.
Fishbone Diagram Medicine
- Fishbone Diagram for Medication Errors – Identifies causes like prescription inaccuracies, dispensing mistakes, patient misunderstanding, and staff training affecting patient safety.
- Fishbone Diagram for Patient Treatment Delays – Analyzes factors such as scheduling issues, resource availability, communication gaps, and procedural inefficiencies impacting care delivery.
- Fishbone Diagram for Drug Interaction Issues – Examines causes like patient history, prescription review processes, staff knowledge, and documentation practices affecting treatment safety.
- Fishbone Diagram for Hospital Readmissions – Identifies causes such as discharge procedures, follow-up care, patient education, and chronic condition management impacting the territory sales plan.
When To Use a Fishbone Diagram
- Problem Identification – Use a fishbone diagram to identify root causes when a problem’s origin is unclear.
- Quality Improvement – Employ it to enhance quality by pinpointing defects and inefficiencies in processes.
- Process Analysis – Utilize it to analyze and understand complex processes, identifying contributing factors to issues.
- Team Brainstorming – Apply it during team brainstorming sessions to organize thoughts and visualize potential causes.
- Root Cause Analysis – Use it for in-depth root cause analysis to prevent recurring problems by addressing underlying issues.
- Project Management – Implement it in project management to foresee potential problems and plan effective solutions.
- Customer Complaints – Employ it to investigate customer complaints, identifying root causes and improving customer satisfaction.
How to Create a Fishbone Diagram
- Define the Problem – Clearly state the issue to be analyzed, ensuring everyone understands the problem.
- Create the Head – Draw a horizontal arrow pointing to the right, with the problem written at the arrow’s head.
- Identify Major Categories – Determine the main categories of potential causes (e.g., Methods, Materials, Machines, Manpower).
- Draw the Bones – Create branches from the main arrow for each category, resembling a fishbone structure.
- Brainstorm Possible Causes – List all potential causes under each category, identifying factors contributing to the problem.
- Analyze the Diagram – Examine the identified causes, looking for patterns and root causes.
- Develop Action Plan – Formulate a plan to address and mitigate the root causes, aiming for problem resolution.
- Review and Revise – Continuously review and revise the diagram as needed to ensure it reflects any new information or changes.
Benefits of Fishbone Diagrams
- Identifies Root Causes – Helps pinpoint underlying causes of a problem rather than just addressing symptoms.
- Organizes Thoughts Visually – Provides a clear, visual representation of complex issues, making it easier to understand and analyze.
- Encourages Team Collaboration – Promotes brainstorming and collective problem-solving, leveraging diverse perspectives.
- Simplifies Complex Problems – Breaks down complicated problems into manageable categories, facilitating a structured approach to analysis.
- Supports Quality Improvement – Aids in identifying defects and inefficiencies, leading to enhanced quality and performance.
- Facilitates Communication – Offers a straightforward way to communicate problems and potential solutions to stakeholders.
- Enhances Decision Making – Provides a comprehensive view of all possible causes, aiding in informed decision-making.
- Promotes Continuous Improvement – Encourages ongoing analysis and refinement of processes, contributing to long-term improvements.
- Prevents Recurrence – Helps develop solutions that address root causes, reducing the likelihood of problems recurring.
- Adaptable Tool – Versatile and can be used across various industries and for different types of problems.
Who created the fishbone diagram?
Dr. Kaoru Ishikawa, a Japanese quality control expert, created the fishbone diagram.
What are the main components of a fishbone diagram?
The main components are the problem statement (head) and categories of potential causes (bones).
How is a fishbone diagram used in quality management?
It is used to identify, explore, and display potential causes of problems, aiding in quality improvement.
What are common categories in a fishbone diagram?
Common categories include Methods, Materials, Machines, Manpower, Measurements, and Environment.
How does a fishbone diagram facilitate brainstorming?
It organizes thoughts visually, encouraging team members to explore and discuss potential causes.
Can fishbone diagrams be used for non-manufacturing problems?
Yes, they are versatile and can be applied to any problem in various industries, including healthcare, education, and services.
What is the first step in creating a fishbone diagram?
Define the problem clearly and write it at the head of the main arrow.
How do you identify root causes using a fishbone diagram?
By brainstorming and listing all potential causes under each category, then analyzing patterns and relationships.
What are the benefits of using a fishbone diagram?
Benefits include identifying root causes, organizing thoughts, encouraging collaboration, and supporting quality improvement.
Share :
