13+ Flowchart for Beginners Examples to Download
Whenever we’re asked to produce formal documents containing data that needs to be analyzed, along with information regarding the data gathering process, we’re often required to create a general flowchart for each event.
Flowcharts are used in many industries, including engineering, physical sciences, computer programming, and even entertainment. This is created to communicate how a process is conducted or how it should be conducted without any group-specific jargon. You may also see management flow chart examples.
But for the flowchart to serve its desired purpose, you must first understand the important role that process flowcharts play across different fields in the market, along with its types and their respective uses.
Restaurant Process Flow Chart Example
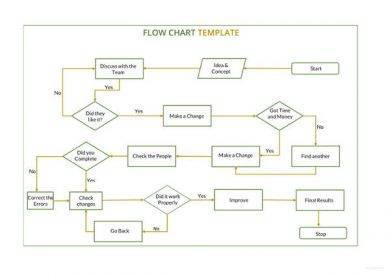
Sample Flow Chart Example
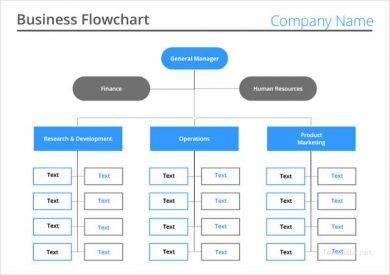
Business Flow Chart Example
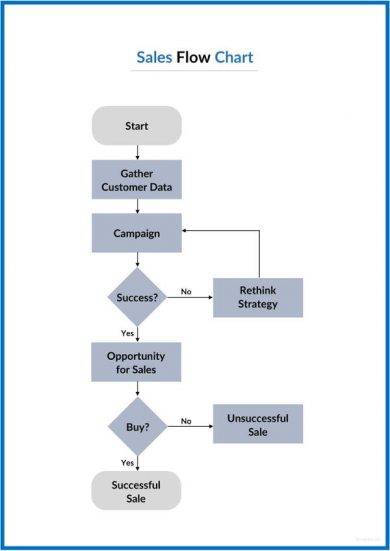
Sales Flowchart Example
Reasons to Use Flowcharts
There are some matters that are difficult to explain through mere words. That’s because it’s a lot easier to understand a concept when it’s presented to us through visual graphics. This is why many people use different types of general charts, graphs, diagrams, or flowcharts to convey a thought.
Flowcharts allow us to explain a process in a simple and clear manner through the use of symbols and text. This gives us the gist of how a process flows even in a single glance. The primary benefit of these simple flowcharts is that it bridges the vocabulary gap that exists between a diverse group of individuals from different fields, such as between entrepreneurs and programmers, accountants and medical personnel.
Each group from the examples given uses a specific jargon to communicate, which is why it’s important to simplify these words and procedures in such a way that both parties can properly visualize.
To gain a deeper understanding of flowcharts, the following are some of the more principal reasons to use flowcharts:
1. For process documentation
Many businesses in the industry use standard flowcharts for documentation. This is used to relay high-level procedures to low-level procedures through detailed work instructions. Large corporations and small organizations alike can greatly benefit from flowcharting different aspects of their business. This can be utilized to show the flow of their business operations to employees and stakeholders, or how certain strategies may be employed in a step-by-step manner.
Many companies even use flowcharts as training materials because of how they can visually stimulate the mind and hold a reader’s attention a lot better compared to an ordinary block of text.
Standardizing and documenting these processes can help keep the business organized for better chances of success in the market.
2. For proper workflow management and continuous improvement
To ensure that your customers are provided the best service, you need to manage your workflow accordingly. The first step to successful workflow management is to define the current state of these processes through a business flowchart. This allows you to study and analyze your business process for any inefficiencies. After examining the areas that are in need of improvement, you can then revise your current workflow using a new flowchart.
3. For programming
Information technology is one of the major industries that played a huge influence on the widespread use of flowcharts in the 20th century. For years, professionals in the data processing world used flowcharts to flesh out their programming logic in a comprehensible manner. You may also see event flow chart examples.
Many experts and instructors in the industry would even advise students to learn about the concept of flowcharting before they could begin with simple programming.
Although the birth of object-oriented programming and various modeling tools has transformed the initial stages of system development, making programming flowcharts not as common as it once was, complex program logic can still be modeled effectively through a flowcharting method. You may also like process flow chart examples.
4. For quick troubleshooting
At one point in our lives, we might have encountered a troubleshooting flowchart to resolve a problem. This type of flowchart usually comes in the form of a Decision Tree, where each branch of the tree progressively narrows down the possible solutions to an issues based on a criteria. You may also check out project flow chart examples.
However, the effectiveness of such flowchart would usually depend on how neatly the range of problems and their respective solutions are structured in a True/False diagnosis model. Many managers and team leaders use flowcharts in troubleshooting to speed up the problem solving time greatly. You might be interested in nursing flowchart examples.
5. For regulatory and quality management requirements
For companies that are subjected to regulatory requirements that require your accounting procedures to be defined and documented properly, an easy way to present this data is to create an accounting flowchart for all your accounting-related procedures. You may also see marketing flow chart examples.
You can also use the flowchart to comply with the certification requirements for quality management systems. In such cases, these flowcharts are not only useful, but they may be mandated as well.
Basic Flowchart Example
Data Flowchart Example
Data Visualization Flowchart Example
Decision Flowchart Example
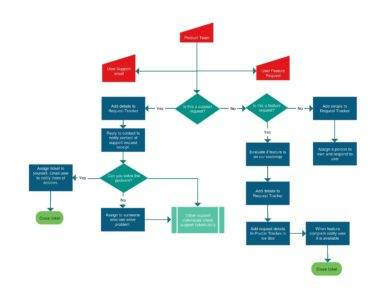
Flowchart Sample Template
Types of Flowcharts and Its Usage
Generally, a flowchart is used to represent an algorithm, workflow, or process. Each step in the procedure is represented by a shape or symbol, and are connected with the use of arrows to portray a particular order.
Here are some of the common types of flowcharts and their uses:
1. Basic Flowchart
One of the most frequent uses of a basic flowchart is for planning a new project. Many engineers and software designers use this type of flowchart to map out their ideas on print. This can also be used to represent an algorithm, to illustrate a solution to a given problem, and to represent the different processes in an operation.
A basic flowchart is perfect for analyzing, designing, documenting, and managing a process due to its simplicity. They are especially helpful when a project involves a sequence of steps that require specific decisions to be made.
2. Business Process Modeling Diagram
We all know that running a business involves a series of complex processes executed by the company’s subsectors. But even with these individual processes, there is a need to unify these procedures for a smooth and organized workflow.
A Business Process Modeling Diagram (BPMD) provides a graphical view of a business’s work processes through a standardized workflow. This simplifies the understanding of business activities, flows, and processes. This also shows the internal business operation to a specific organization, depicts the interaction between entities, and bridges the communication gap that occurs between the business process design and implementation. You may also see music chart examples.
3. Swimlane Flowchart
Swimlane flowcharts are most ideal for documenting a business’s internal and external work processes. For instance, the company may need to comply to the external pressures involving business process management automation, enterprise resource planning, company sale, and legislation and regulatory compliance (like the Sarbanes-Oxley Act). You may also like daily chart examples.
As for the internal aspect of the business, a swimlane flowchart may be used for the following purposes:
- Flexibility – This can be used for both new and existing employees to learn how they can improve their work ethics to properly perform their job.
- Quality – If each member of a team performs a task according to how it is demonstrated in the flowchart, then the outcome of the process will be consistent. You may also check out weekly chart examples.
- Visibility – The management of the organization can see how a job is meant to be performed for better analysis.
- Process Improvement – This will help you visualize your current work process to see what needs to be improved.
4. Workflow Diagram
A workflow diagram describes the stages of the business (or manufacturing processes) from its initial to its final stage. This makes it easier for the organization to monitor the progress of the processes more clearly and efficiently.
Here, ovals are used to indicate the beginning and the end of a workflow, rectangles are used to show the process activities, circles are used to show the connectors from one activity to another, while diamonds signify the decision-making process. You might be interested in behavior chart examples.
Using this system allows you to focus on process integration and/or human task orientation for successful workflow management.
5. Process Map
A process map is a detailed flowchart that is commonly used in the world of software and electronics because of how it can assist users in diagnosing or troubleshooting a problem.
The flowchart can be used to depict a simple project life cycle—such as the initiation, definition, design, development, and implementation phases—for better process management. The steps involved in the process map are usually arranged in a sequential order, specifically from start to finish. You may also see temperature chart examples.
Similar to a workflow diagram, a process map may be used for process improvement as well. This enables users to break down a complex process into smaller steps to reveal areas of inefficiency, along with those that require improvement. You may also like diet chart examples.
6. Specification and Description Language (SDL) Diagram
The Specification and Description Language Diagram is ideal for brainstorming computer algorithms using a unique set of symbols. This is frequently used in the field of programming and network design because of how it offers a great source for internal problem solving in system design and systems engineering. The three general components of an SDL diagram include the system definition, the block, and the process. You may also check out comparison chart examples.
This can also be used to show clients and customers how to troubleshoot basic problems due to how they could easily be followed when presented correctly.
7. Data Flow Diagram
The data flow diagram, which is a lot similar to an entity relationship diagram, uses specialized flowcharts to distill a substantial amount of information into a couple of symbols and connectors. This allows system developers to communicate with users in such a way that they could understand industry-specific concepts. You might be interested in monthly chart examples.
8. Process Flow Diagram
A process flow diagram, also known as a flowsheet, is a technical illustration used to exhibit compound processes in the fields of chemical and process engineering.
But due to the complexity of its procedure, the flowchart would simply focus on the major details of the plant process and not on its minor details. This type of flowchart is usually applied in a wide range of branches in engineering, such as oil and petroleum refining, natural gas systems, water treatment and processes, green energy (solar and wind power), piping and irrigation systems, and electrical power plants. You may also see metric conversion chart examples.
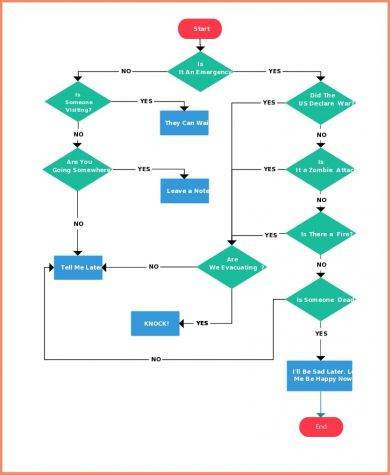
Game of Thrones Flowchart Example
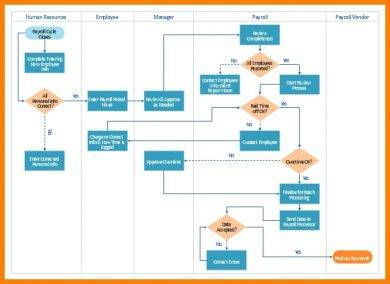
Payroll Process Flowchart Example
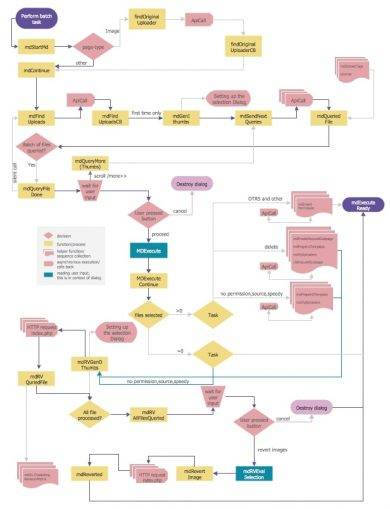
Project Flowchart Example
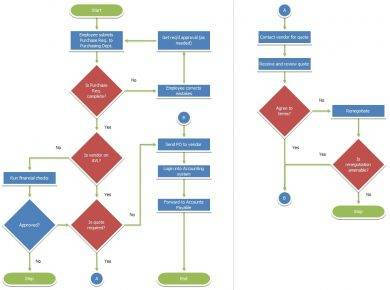
Purchase Order Flowchart Example
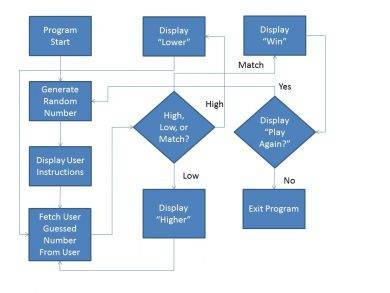
Simple Flowchart Example
A flowchart offers us a pictorial or a graphical representation of a given process for better comprehension. By understanding the importance of these flowcharts and how they are applied, we can create well-defined flowcharts for better process management. You may also see control chart examples.
This ensures an efficient and effective development process to obtain business or project success. So if you ever find yourself in need of a flowchart, make sure to keep our guidelines and examples in mind.
13+ Flowchart for Beginners Examples to Download

Whenever we’re asked to produce formal documents containing data that needs to be analyzed, along with information regarding the data gathering process, we’re often required to create a general flowchart for each event.
Flowcharts are used in many industries, including engineering, physical sciences, computer programming, and even entertainment. This is created to communicate how a process is conducted or how it should be conducted without any group-specific jargon. You may also see management flow chart examples.
But for the flowchart to serve its desired purpose, you must first understand the important role that process flowcharts play across different fields in the market, along with its types and their respective uses.
Restaurant Process Flow Chart Example

Sample Flow Chart Example

Details
File Format
Word
XLSX
Business Flow Chart Example

Details
File Format
Word
PDF
Sales Flowchart Example

Details
File Format
Word
Reasons to Use Flowcharts
There are some matters that are difficult to explain through mere words. That’s because it’s a lot easier to understand a concept when it’s presented to us through visual graphics. This is why many people use different types of general charts, graphs, diagrams, or flowcharts to convey a thought.
Flowcharts allow us to explain a process in a simple and clear manner through the use of symbols and text. This gives us the gist of how a process flows even in a single glance. The primary benefit of these simple flowcharts is that it bridges the vocabulary gap that exists between a diverse group of individuals from different fields, such as between entrepreneurs and programmers, accountants and medical personnel.
Each group from the examples given uses a specific jargon to communicate, which is why it’s important to simplify these words and procedures in such a way that both parties can properly visualize.
To gain a deeper understanding of flowcharts, the following are some of the more principal reasons to use flowcharts:
1. For process documentation
Many businesses in the industry use standard flowcharts for documentation. This is used to relay high-level procedures to low-level procedures through detailed work instructions. Large corporations and small organizations alike can greatly benefit from flowcharting different aspects of their business. This can be utilized to show the flow of their business operations to employees and stakeholders, or how certain strategies may be employed in a step-by-step manner.
Many companies even use flowcharts as training materials because of how they can visually stimulate the mind and hold a reader’s attention a lot better compared to an ordinary block of text.
Standardizing and documenting these processes can help keep the business organized for better chances of success in the market.
2. For proper workflow management and continuous improvement
To ensure that your customers are provided the best service, you need to manage your workflow accordingly. The first step to successful workflow management is to define the current state of these processes through a business flowchart. This allows you to study and analyze your business process for any inefficiencies. After examining the areas that are in need of improvement, you can then revise your current workflow using a new flowchart.
3. For programming
Information technology is one of the major industries that played a huge influence on the widespread use of flowcharts in the 20th century. For years, professionals in the data processing world used flowcharts to flesh out their programming logic in a comprehensible manner. You may also see event flow chart examples.
Many experts and instructors in the industry would even advise students to learn about the concept of flowcharting before they could begin with simple programming.
Although the birth of object-oriented programming and various modeling tools has transformed the initial stages of system development, making programming flowcharts not as common as it once was, complex program logic can still be modeled effectively through a flowcharting method. You may also like process flow chart examples.
4. For quick troubleshooting
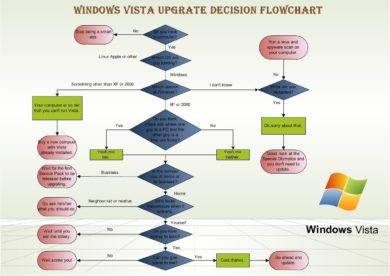
At one point in our lives, we might have encountered a troubleshooting flowchart to resolve a problem. This type of flowchart usually comes in the form of a Decision Tree, where each branch of the tree progressively narrows down the possible solutions to an issues based on a criteria. You may also check out project flow chart examples.
However, the effectiveness of such flowchart would usually depend on how neatly the range of problems and their respective solutions are structured in a True/False diagnosis model. Many managers and team leaders use flowcharts in troubleshooting to speed up the problem solving time greatly. You might be interested in nursing flowchart examples.
5. For regulatory and quality management requirements
For companies that are subjected to regulatory requirements that require your accounting procedures to be defined and documented properly, an easy way to present this data is to create an accounting flowchart for all your accounting-related procedures. You may also see marketing flow chart examples.
You can also use the flowchart to comply with the certification requirements for quality management systems. In such cases, these flowcharts are not only useful, but they may be mandated as well.
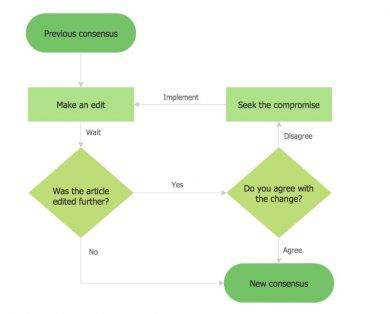
Basic Flowchart Example
soarclub.us
Details
File Format
PDF
Size: 22 KB
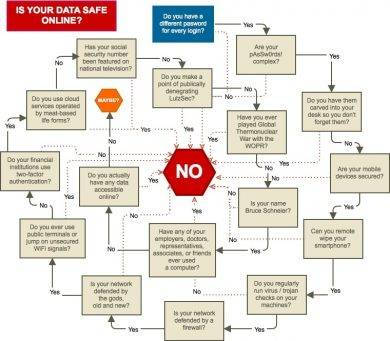
Data Flowchart Example
dahkai.com
Details
File Format
PDF
Size: 74 KB
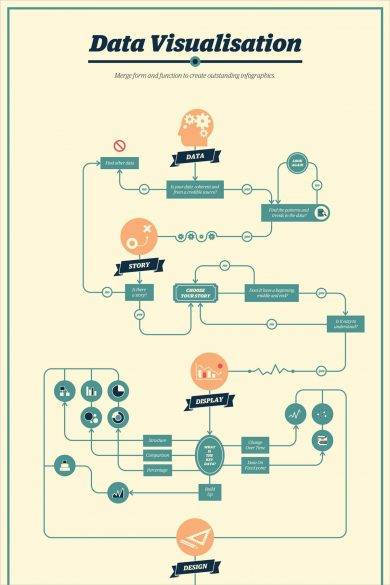
Data Visualization Flowchart Example
blog.visme.co
Details
File Format
PDF
Size: 94 KB
Decision Flowchart Example
onwe.bioinnovate.co
Details
File Format
PDF
Size: 102 KB
Flowchart Sample Template
onwe.bioinnovate.co
Details
File Format
PDF
Size: 95 KB
Types of Flowcharts and Its Usage
Generally, a flowchart is used to represent an algorithm, workflow, or process. Each step in the procedure is represented by a shape or symbol, and are connected with the use of arrows to portray a particular order.
Here are some of the common types of flowcharts and their uses:
1. Basic Flowchart
One of the most frequent uses of a basic flowchart is for planning a new project. Many engineers and software designers use this type of flowchart to map out their ideas on print. This can also be used to represent an algorithm, to illustrate a solution to a given problem, and to represent the different processes in an operation.
A basic flowchart is perfect for analyzing, designing, documenting, and managing a process due to its simplicity. They are especially helpful when a project involves a sequence of steps that require specific decisions to be made.
2. Business Process Modeling Diagram
We all know that running a business involves a series of complex processes executed by the company’s subsectors. But even with these individual processes, there is a need to unify these procedures for a smooth and organized workflow.
A Business Process Modeling Diagram (BPMD) provides a graphical view of a business’s work processes through a standardized workflow. This simplifies the understanding of business activities, flows, and processes. This also shows the internal business operation to a specific organization, depicts the interaction between entities, and bridges the communication gap that occurs between the business process design and implementation. You may also see music chart examples.
3. Swimlane Flowchart
Swimlane flowcharts are most ideal for documenting a business’s internal and external work processes. For instance, the company may need to comply to the external pressures involving business process management automation, enterprise resource planning, company sale, and legislation and regulatory compliance (like the Sarbanes-Oxley Act). You may also like daily chart examples.
As for the internal aspect of the business, a swimlane flowchart may be used for the following purposes:
Flexibility – This can be used for both new and existing employees to learn how they can improve their work ethics to properly perform their job.
Quality – If each member of a team performs a task according to how it is demonstrated in the flowchart, then the outcome of the process will be consistent. You may also check out weekly chart examples.
Visibility – The management of the organization can see how a job is meant to be performed for better analysis.
Process Improvement – This will help you visualize your current work process to see what needs to be improved.
4. Workflow Diagram
A workflow diagram describes the stages of the business (or manufacturing processes) from its initial to its final stage. This makes it easier for the organization to monitor the progress of the processes more clearly and efficiently.
Here, ovals are used to indicate the beginning and the end of a workflow, rectangles are used to show the process activities, circles are used to show the connectors from one activity to another, while diamonds signify the decision-making process. You might be interested in behavior chart examples.
Using this system allows you to focus on process integration and/or human task orientation for successful workflow management.
5. Process Map
A process map is a detailed flowchart that is commonly used in the world of software and electronics because of how it can assist users in diagnosing or troubleshooting a problem.
The flowchart can be used to depict a simple project life cycle—such as the initiation, definition, design, development, and implementation phases—for better process management. The steps involved in the process map are usually arranged in a sequential order, specifically from start to finish. You may also see temperature chart examples.
Similar to a workflow diagram, a process map may be used for process improvement as well. This enables users to break down a complex process into smaller steps to reveal areas of inefficiency, along with those that require improvement. You may also like diet chart examples.
6. Specification and Description Language (SDL) Diagram
The Specification and Description Language Diagram is ideal for brainstorming computer algorithms using a unique set of symbols. This is frequently used in the field of programming and network design because of how it offers a great source for internal problem solving in system design and systems engineering. The three general components of an SDL diagram include the system definition, the block, and the process. You may also check out comparison chart examples.
This can also be used to show clients and customers how to troubleshoot basic problems due to how they could easily be followed when presented correctly.
7. Data Flow Diagram
The data flow diagram, which is a lot similar to an entity relationship diagram, uses specialized flowcharts to distill a substantial amount of information into a couple of symbols and connectors. This allows system developers to communicate with users in such a way that they could understand industry-specific concepts. You might be interested in monthly chart examples.
8. Process Flow Diagram
A process flow diagram, also known as a flowsheet, is a technical illustration used to exhibit compound processes in the fields of chemical and process engineering.
But due to the complexity of its procedure, the flowchart would simply focus on the major details of the plant process and not on its minor details. This type of flowchart is usually applied in a wide range of branches in engineering, such as oil and petroleum refining, natural gas systems, water treatment and processes, green energy (solar and wind power), piping and irrigation systems, and electrical power plants. You may also see metric conversion chart examples.
Game of Thrones Flowchart Example
bidproposalletter.com
Details
File Format
PDF
Size: 41 KB
Payroll Process Flowchart Example
samplesofpaystubs.com
Details
File Format
PDF
Size: 30 KB
Project Flowchart Example
rebellions.info
Details
File Format
PDF
Size: 47 KB
Purchase Order Flowchart Example
onwe.bioinnovate.co
Details
File Format
PDF
Size: 44 KB
Simple Flowchart Example
jbryan2.create.stedwards.edu
Details
File Format
PDF
Size: 40 KB
A flowchart offers us a pictorial or a graphical representation of a given process for better comprehension. By understanding the importance of these flowcharts and how they are applied, we can create well-defined flowcharts for better process management. You may also see control chart examples.
This ensures an efficient and effective development process to obtain business or project success. So if you ever find yourself in need of a flowchart, make sure to keep our guidelines and examples in mind.

