20+ Graphic Organizer Examples to Download
A graphic organizer is a visual tool used to structure information and ideas, making them easier to understand and analyze. Common types include the T Chart, which helps compare and contrast concepts, Expository Writing organizers that aid in structuring informative texts, and the Plot Diagram, which outlines the elements of a story. These tools enhance learning by breaking down complex information into manageable visual representations. To streamline their creation and ensure consistency, educators and students often use ready-made graphic organizer templates, which provide structured layouts for various purposes and save time during lesson planning or study sessions.
What is Graphic Organizer?
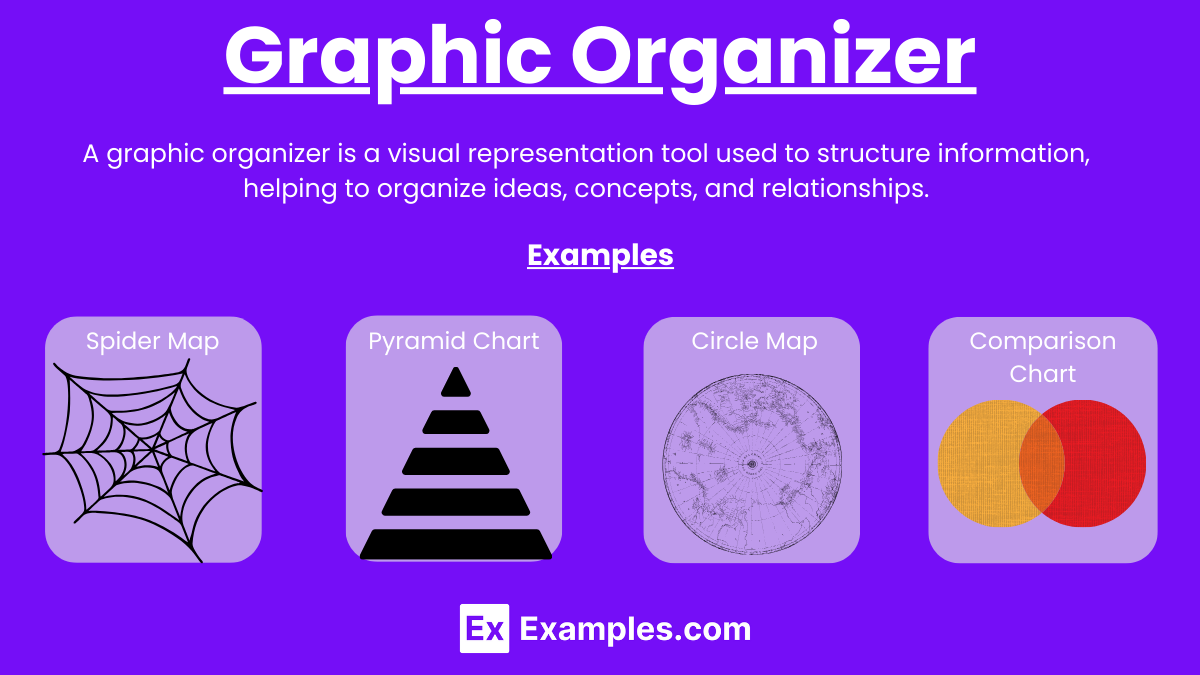
A graphic organizer is a visual aid that helps in organizing and presenting information clearly, often used in literary analysis and for illustrating concepts like ethos pathos and logos. It simplifies complex ideas by arranging them in structured formats, enhancing comprehension and retention.
Examples of Graphic Organizer
1. Sequence Chart
- Purpose: Organize events or steps in a particular order.
- Structure: A series of boxes or shapes connected by arrows.
2. Fishbone Diagram (Ishikawa)
- Purpose: Identify causes of a specific problem.
- Structure: A central “spine” with branches (bones) representing different categories of causes.
3. Spider Map
- Purpose: Explore a central idea with related subtopics.
- Structure: Central idea in the middle with lines radiating to subtopics.
4. Double Bubble Map
- Purpose: Compare and contrast two items in more detail than a Venn diagram.
- Structure: Two overlapping circles with additional circles around them to expand on differences and similarities.
5. Pyramid Chart
- Purpose: Illustrate hierarchical relationships.
- Structure: A pyramid with different levels representing a hierarchy.
6. Word Web
- Purpose: Expand on a single word or concept.
- Structure: A central word with lines connecting to related words or ideas.
7. Matrix Chart
- Purpose: Organize information into categories for comparison.
- Structure: A table with rows and columns.
8. PMI Chart (Plus, Minus, Interesting)
- Purpose: Evaluate the positives, negatives, and interesting points about a topic.
- Structure: Three columns labeled Plus, Minus, and Interesting.
9. Circle Map
- Purpose: Define a concept or idea.
- Structure: A central circle with the main idea and an outer circle with related information.
10. Tree Diagram
- Purpose: Break down a broad category into subcategories.
- Structure: A branching diagram starting from a single node and expanding outwards.
11. Chart Diagram
- Purpose: Organize and present data or information in a clear, structured way.
- Structure: Rows and columns similar to a table, used for categorizing information.
12. Argumentative Essay Outline
- Purpose: Plan and structure an argumentative essay.
- Structure: Sections for introduction, thesis statement, main arguments, counterarguments, and conclusion.
13. Cluster Diagram
- Purpose: Group related ideas around a central concept.
- Structure: Central concept with branches forming clusters of related ideas.
14. Problem-Solution Chart
- Purpose: Identify problems and propose solutions.
- Structure: Two columns or sections, one for problems and one for solutions.
15. Bio Poem Graphic Organizer
- Purpose: Create a biographical poem about a person or character.
- Structure: Lines or sections prompting specific biographical information.
16. Storyboard
- Purpose: Plan the sequence of events in a story or presentation.
- Structure: Panels or frames in a sequence, often with illustrations or descriptions.
17. Comparison Chart
- Purpose: Compare multiple items across several criteria.
- Structure: A grid with items and criteria forming rows and columns.
18. RAFT Organizer (Role, Audience, Format, Topic)
- Purpose: Plan writing by defining role, audience, format, and topic.
- Structure: Sections labeled Role, Audience, Format, Topic.
19. Sensory Chart
- Purpose: Describe an experience or setting using the five senses.
- Structure: Sections or columns for sight, sound, smell, taste, and touch.
20. Fact and Opinion Chart
- Purpose: Distinguish between factual information and opinions.
- Structure: Two columns labeled Fact and Opinion.
Types of Graphic Organizer
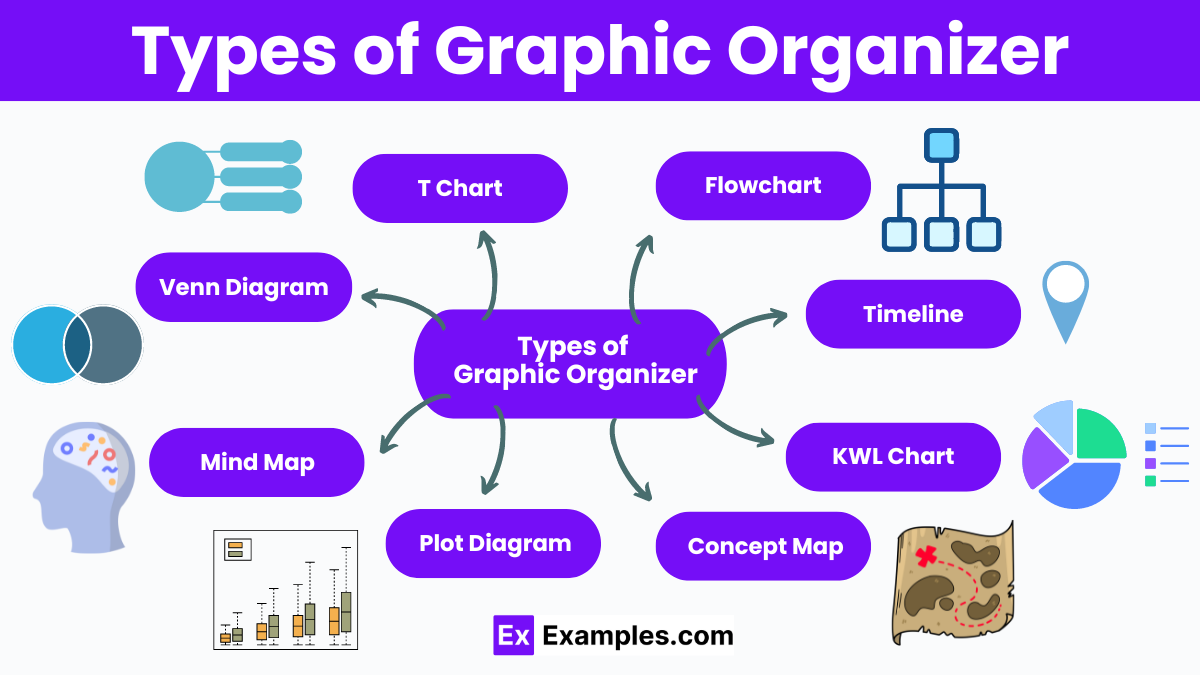
Venn Diagram: Compare and contrast two or more items, Overlapping circles to show similarities and differences.
T Chart: Organize information into two categories, A chart with two columns, often used for pros and cons, facts vs. opinions.
Mind Map: Brainstorm and visualize connections between ideas, Central idea with branches connecting related concepts.
Flowchart: Illustrate steps in a process or sequence, Boxes connected by arrows showing the flow of information or steps.
Plot Diagram: Outline the structure of a story, A diagram showing the exposition, rising action, climax, falling action, and resolution.
KWL Chart: Track what students Know, Want to know, and have Learned, Three columns labeled K, W, and L.
Concept Map: Show relationships between concepts. Nodes connected by lines, often with labels to explain the connections.
Timeline: Sequence events in chronological order, A linear diagram with dates and events marked along it.
Cause and Effect Diagram: Identify causes and effects of an event or situation, A central line with branches for causes leading to an effect.
Expository Writing Organizer: Structure information for informative or explanatory texts, Sections for introduction, body paragraphs, and conclusion, with specific spaces for main points and supporting details.
Purpose of Graphic Organizers
- Visual Representation: Simplifies complex information by representing it visually, making it easier to understand and remember.
- Enhances Learning: Supports different learning styles, particularly visual learners, and aids in better comprehension.
- Organization: Helps in structuring information logically, facilitating clear and coherent presentation.
- Critical Thinking: Encourages students to analyze relationships and patterns among concepts.
- Problem-Solving: Assists in breaking down problems into manageable parts and visualizing solutions.
- Communication: Improves communication by providing a clear visual representation of ideas, concepts, and relationships.
Uses of Graphic Organizers
- Brainstorming: Helps in generating and organizing ideas during brainstorming sessions.
- Note-Taking: Aids in recording and summarizing key points during lectures or reading.
- Planning: Useful for planning essays, reports, or projects by outlining main ideas and supporting details.
- Comparing and Contrasting: Facilitates comparison and contrast of different concepts, ideas, or events.
- Sequencing: Helps in organizing events or steps in a process in a logical order.
- Classifying: Assists in grouping information into categories based on shared characteristics.
- Cause and Effect: Visualizes the relationship between causes and their effects.
- Decision Making: Supports decision-making processes by laying out options and evaluating their pros and cons.
- Problem Analysis: Breaks down problems to analyze components and find solutions.
- Vocabulary Development: Aids in understanding and retaining new vocabulary words.
- Reading Comprehension: Helps in summarizing and understanding texts, including identifying main ideas and supporting details.
- Concept Mapping: Visualizes relationships between different concepts, making connections clearer.
- Project Management: Organizes tasks and timelines in project management.
- Collaboration: Enhances group work by providing a shared visual reference for discussing and organizing ideas.
- Presentations: Improves presentations by providing a clear and engaging way to display information.
- Memory Aid: Acts as a memory aid by organizing information in an easily recallable format.
- Learning Assessment: Helps teachers assess students’ understanding and thought processes.
- Synthesis of Information: Assists in synthesizing information from multiple sources into a cohesive understanding.
- Study Guide: Serves as an effective study guide by highlighting key concepts and their relationships.
- Instructional Tool: Used by teachers to explain complex topics in a simplified manner.
Tips for Using Graphic Organizers
- Organize Your Thoughts
- Visualize Relationships
- Enhance Understanding
- Plan the 5 Paragraph Essay
- Develop Body Paragraphs
- Use in Literary Analysis
- Apply to Statistics Reports
- Edit and Revise
What is a graphic organizer?
A visual tool that helps structure and organize information, making it easier to understand and analyze.
How do graphic organizers improve writing?
They provide a clear framework for organizing ideas, ensuring logical flow and coherence in writing.
What types of graphic organizers are there?
Examples include Venn diagrams, mind maps, flow charts, and essay maps, each suited for different tasks.
Can graphic organizers be used for essays?
Yes, they are especially useful for structuring essays, including thesis statements, body paragraphs, and conclusions.
How do graphic organizers aid in literary analysis?
They help break down and analyze literary elements like themes, characters, and plot structures.
Are graphic organizers useful for statistics reports?
Absolutely, they help present and analyze statistical data clearly, using charts, graphs, and tables.
Can graphic organizers improve reading comprehension?
Yes, they help visualize relationships and key points, enhancing understanding and retention.
Do graphic organizers benefit all grade levels?
Yes, they are versatile tools that can be adapted for students of all ages and educational levels.
How do I choose the right graphic organizer?
Select based on the task’s requirements, such as essay writing, data analysis, or literary analysis.
Can graphic organizers be used in group projects?
Yes, they facilitate collaboration by providing a shared framework for organizing and presenting information.
Share :
