10+ Infographic Examples to Download

Have you ever come across a visual representation of complex information that just blew your mind? That’s an Infographic! It is a creative way to present data, information, or knowledge that can be quickly understood and easily remembered. Infographics are a powerful tool in today’s digital world, and they have become increasingly popular in content marketing, social media, and brand strategy. Let’s dive into what infographics are, how to create them, and some FAQs to clear any doubts.
1. DPI Infographic Template

dpi.wi.gov
2. Economic Impact Results Infographic Template
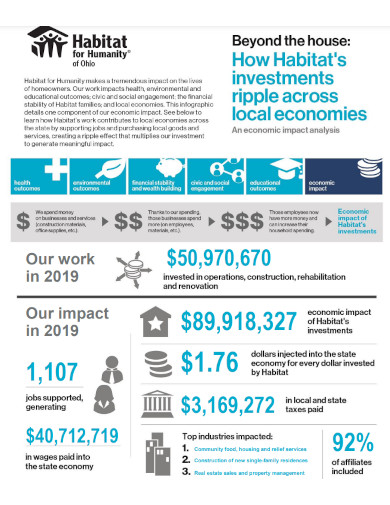
habitatohio.org
3. Employee Engagement Infographic Template

powell-software.com
4. Vertical Infographic Template
uploads-ssl.webflow.com
5. Infographic Planning Guide
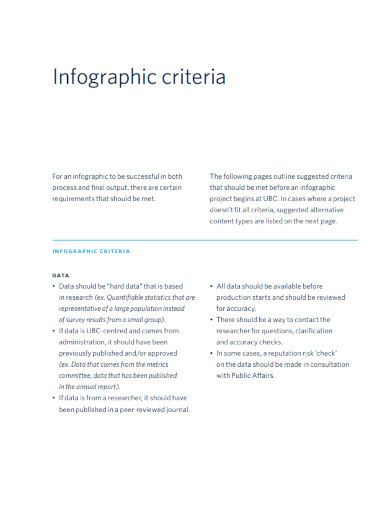
assets.brand.ubc.ca
6. Endangered Species Infographic Project
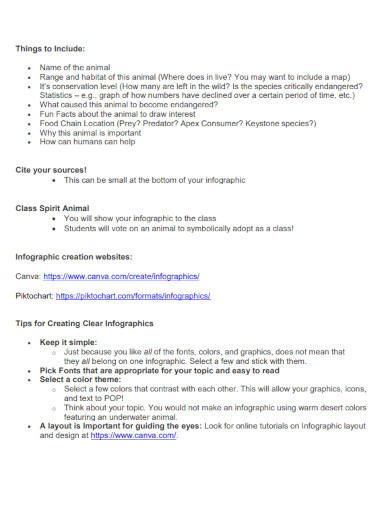
cdn.naaee.org
7. Career Cluster Infographic
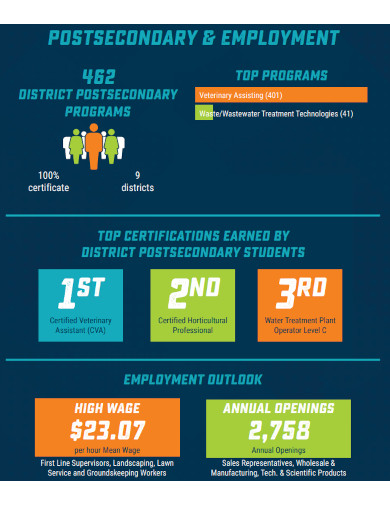
fldoe.org
8. Human Subjects Research Infographic

grants.nih.gov
9. Infographic Rubric Template
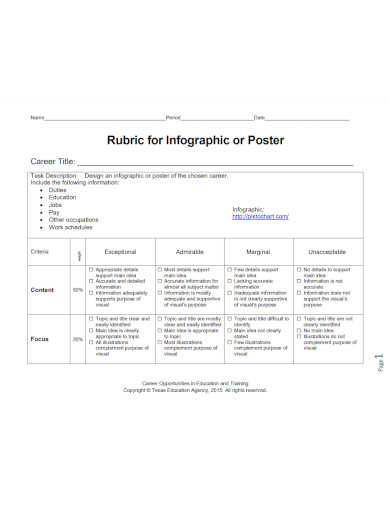
txcte.org
10. Infographic Assignment Template
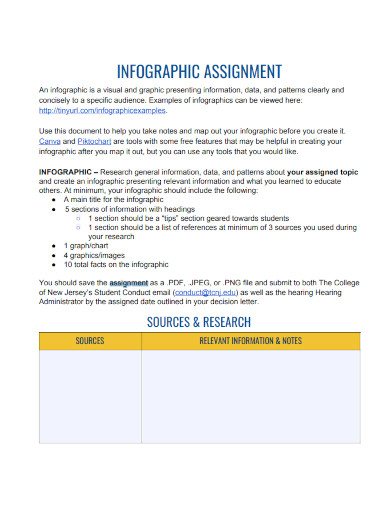
conduct.tcnj.edu
11. Digital Marketing Infographic Template
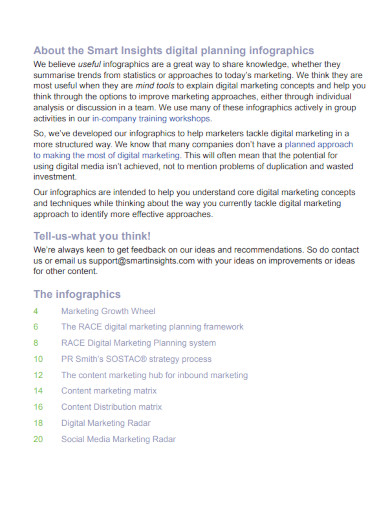
davidhodder.com
What is an Infographic?
An Infographic is a visual representation of complex data, information, or knowledge, designed to convey a message quickly and effectively. It combines text, images, and charts to make the content more engaging and easily understood. Infographics come in different types, such as a one-pager, a creative organizational chart, a marketing campaign proposal, or an infographic case study. They are widely used in content marketing, social media marketing, and brand strategy to deliver a message that resonates with the target audience.
How to Create an Infographic?
Creating an infographic can seem daunting, but it doesn’t have to be. Here’s a step-by-step guide to creating an infographic:
Step 1: Define the purpose and message of your infographic.
Before you start creating your infographic, it’s important to define the purpose and message you want to convey. This will help you choose the type of infographic and the visual elements that align with your message.
Step 2: Gather the data and information you want to include.
Collect the data and information that you want to present in your infographic. This could be in the form of statistics, facts, or any other relevant information. Make sure the data is accurate and up-to-date.
Step 3: Choose the type of infographic that best suits your purpose.
There are many types of infographics, such as a one-pager, a timeline, a flowchart, or a comparison infographic. Choose the type that best suits your purpose and the data you want to present.
Step 4: Sketch out a rough design of your infographic.
Start with a rough sketch of your infographic. This will help you visualize how the data will be presented and where the visual elements will be placed. Keep in mind the purpose and message you defined in step one.
Step 5: Select the colors, fonts, and visual elements that align with your brand or message.
Choose the colors, fonts, and visual elements that align with your brand or message. Make sure they are consistent throughout the infographic and don’t detract from the message you want to convey.
Step 6: Use vector design software to create your infographic.
Use vector design software such as Adobe Illustrator, Canva, or Piktochart to create your infographic. This will allow you to create high-quality graphics and manipulate the visual elements easily.
Step 7: Review and refine your infographic until you’re satisfied with the final product.
Review and refine your infographic until you’re satisfied with the final product. Make sure the information is accurate, the message is clear, and the visual elements are engaging. Get feedback from others if possible to ensure your infographic effectively delivers the message you intended.
FAQs
Why are infographics important in content marketing?
Infographics are important in content marketing because they make the content more engaging and easier to understand. They are also highly shareable on social media, which can increase brand awareness and drive traffic to a website.
What skills do I need to create an infographic?
You need skills in graphic design, data analysis, and storytelling to create an effective infographic. However, there are many online tools and resources available that can help you create an infographic even if you don’t have these skills.
How do I make my infographic stand out?
To make your infographic stand out, use a unique design that aligns with your brand or message. Use clear and concise language, and make sure the information is accurate and up-to-date.
Can I use an infographic in my Graphic Designer resume?
Yes, you can use an infographic in your graphic designer resume to showcase your skills and experience in a visually appealing way. However, make sure it’s relevant to the job you’re applying for and doesn’t detract from the overall professionalism of your resume.
In conclusion, infographics are a powerful tool in today’s digital world, and they can be used in various contexts such as content marketing, social media marketing, and brand strategy. Creating an effective infographic requires a combination of graphic design, data analysis, and storytelling skills. By following the step-by-step guide and answering some of the frequently asked questions, you can create an infographic that effectively delivers your message and engages your target audience.
Share :
