33+ Measurement Chart Examples to Download
Let’s be honest, none of us are actual experts when it comes to measurements and their conversions. We need some sort of guide for us to clarify our assumptions. Lo and behold, the creation of measurement chart examples. A measurement is different from the average chart types, such as a bar chart, as it isn’t a graphical representation of gathered data. Instead, it presents defined data according to the international system of units.
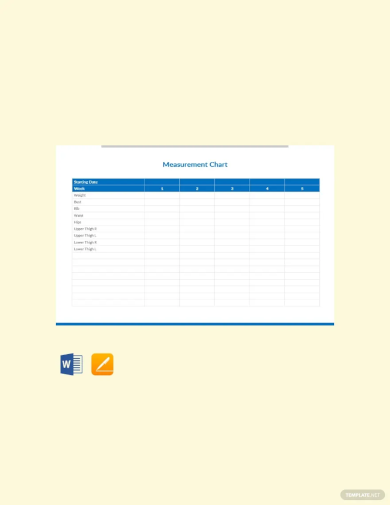
Measurement Chart Template
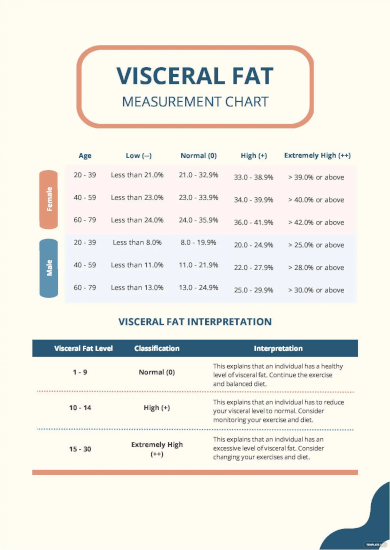
Visceral Fat Measurement Chart
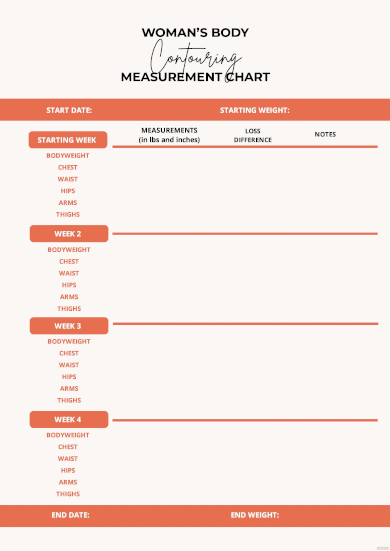
Woman’s Body Contouring Measurement Chart Template
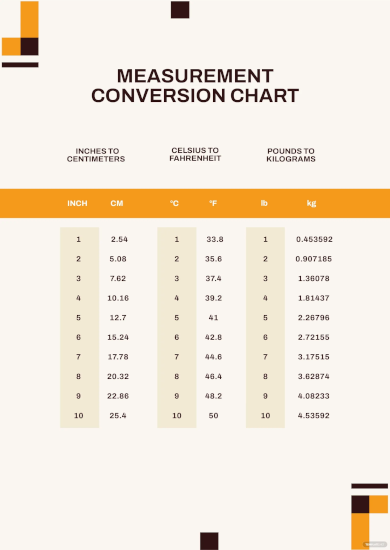
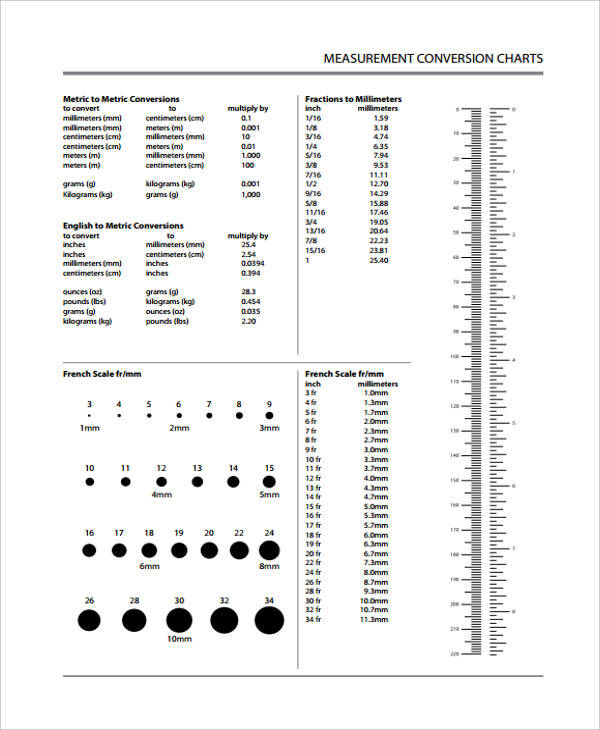
Measurement Conversion Chart
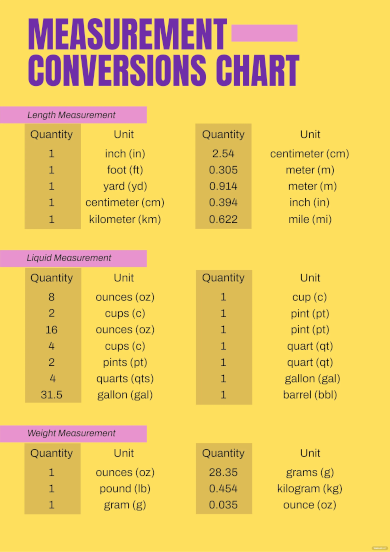
Measurement Conversions Chart
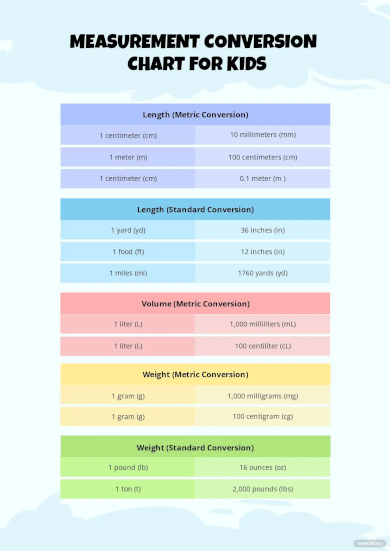
Measurement Conversion Chart For Kids
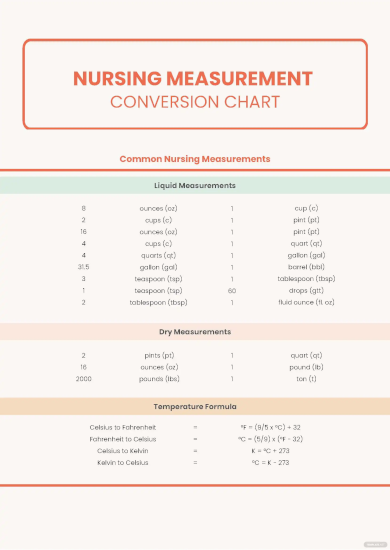
Nursing Measurement Conversion Chart
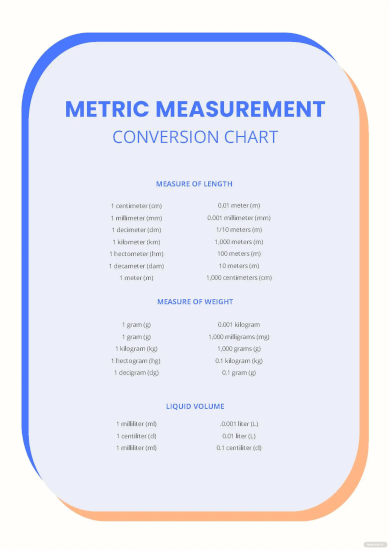
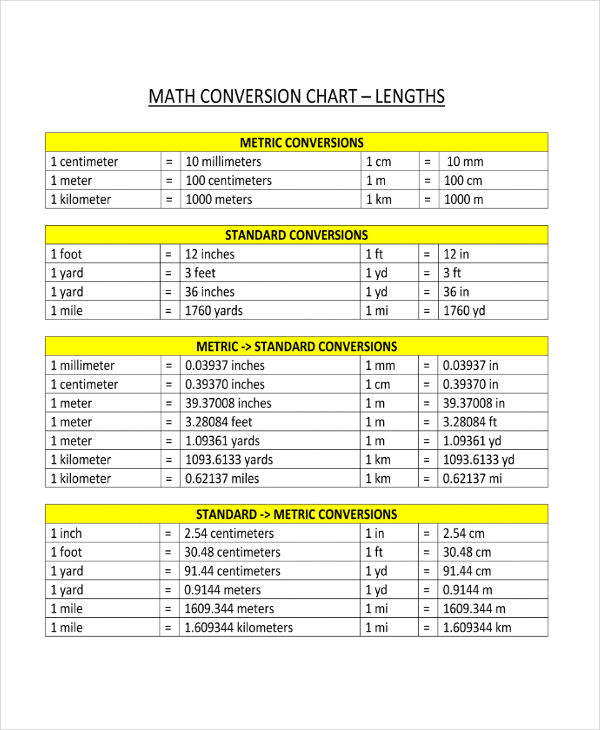
Metric Measurement Conversion Chart
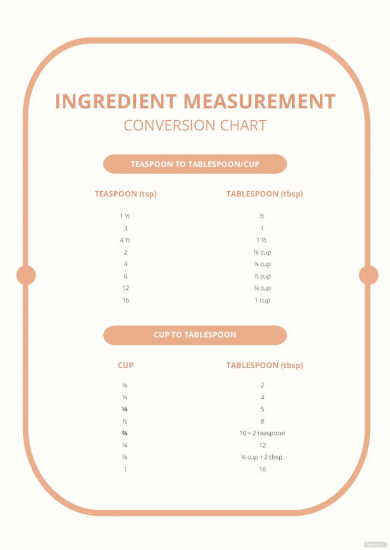
Ingredient Measurement Conversion Chart
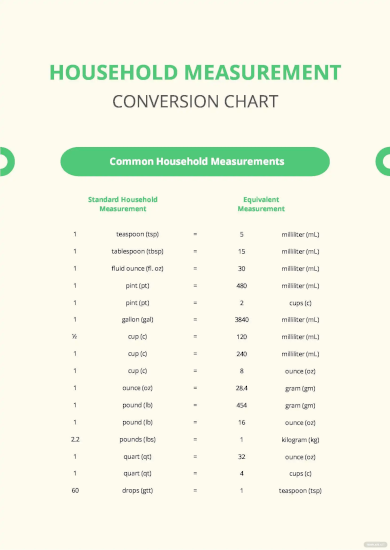
Household Measurement Conversion Chart
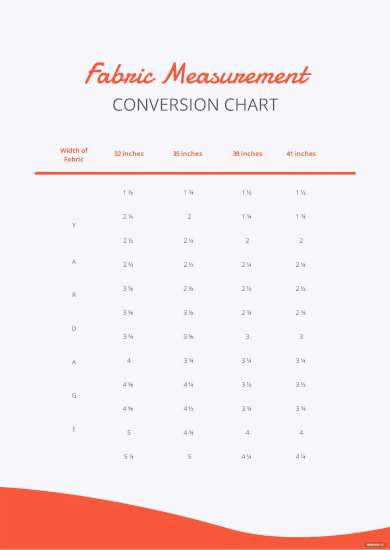
Fabric Measurement Conversion Chart
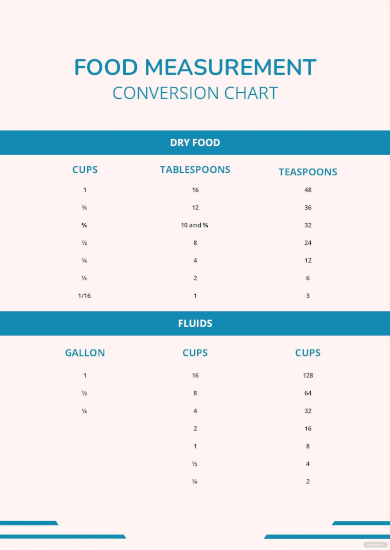
Food Measurement Conversion Chart
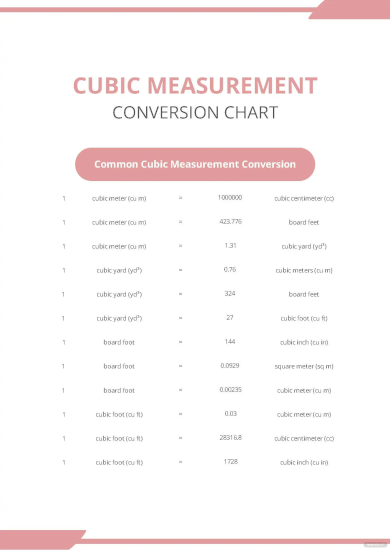
Cubic Measurement Conversion Chart
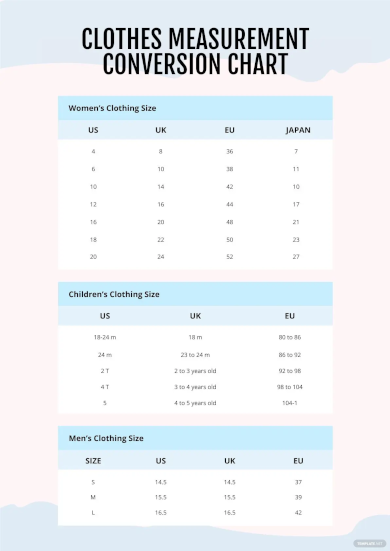
Clothes Measurement Conversion Chart
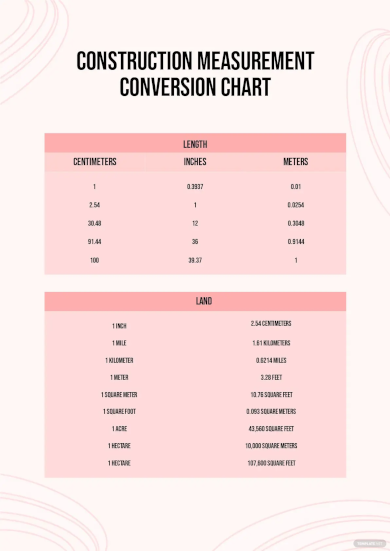
Construction Measurement Conversion Chart
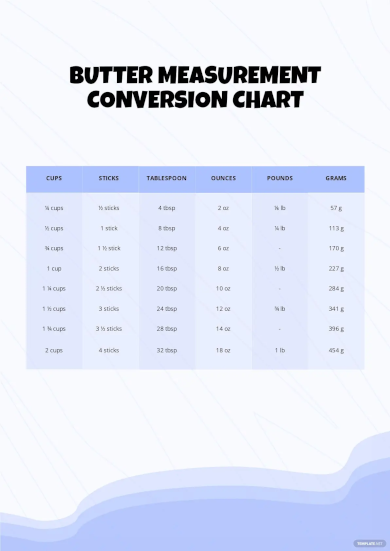
Butter Measurement Conversion Chart
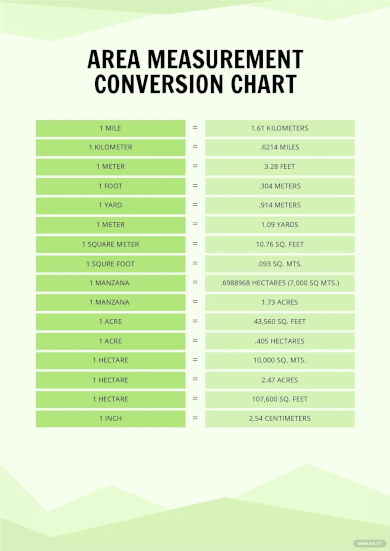
Area Measurement Conversion Chart
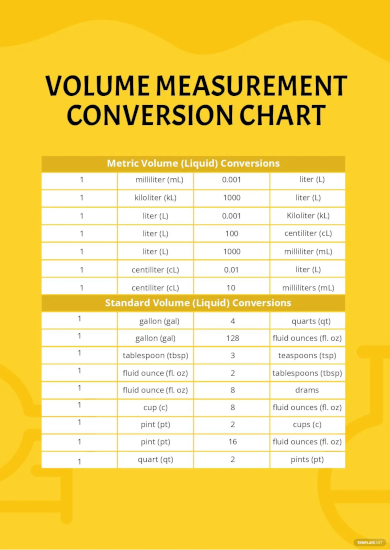
Volume Measurement Conversion Chart
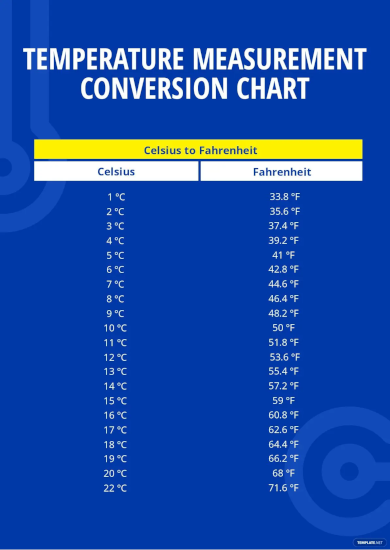
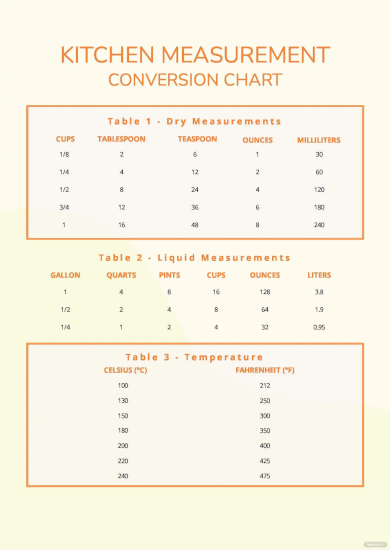
Temperature Measurement Conversion Chart
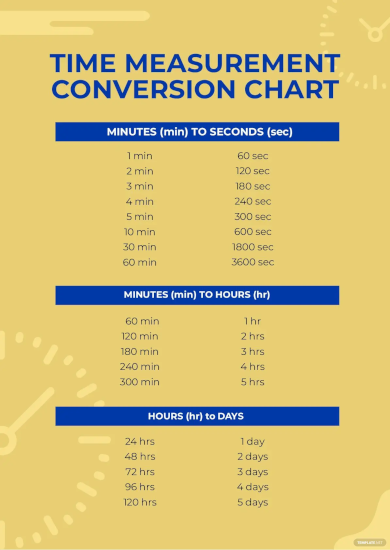
Time Measurement Conversion Chart
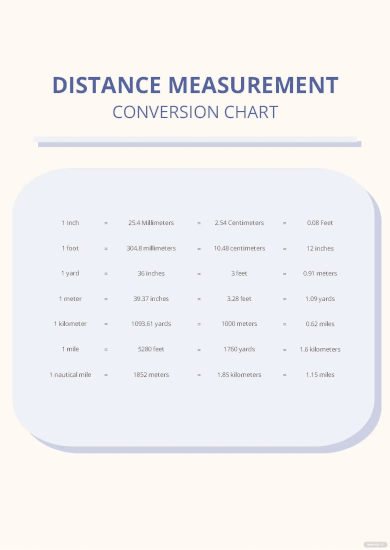
Distance Measurement Conversion Chart
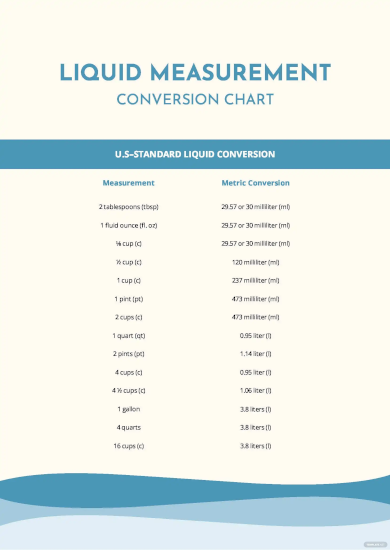
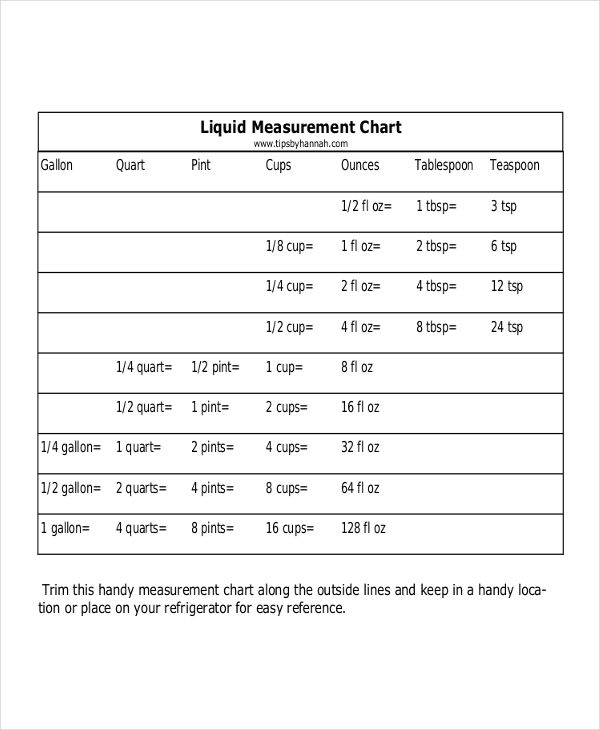
Liquid Measurement Conversion Chart
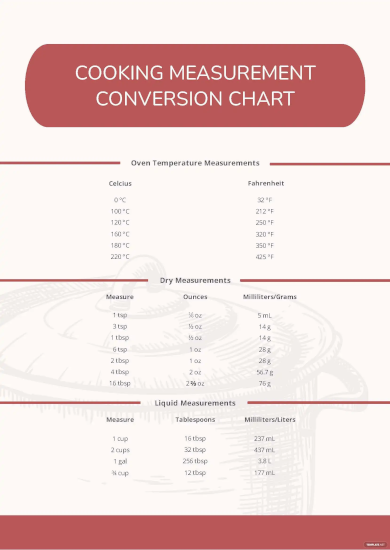
Cooking Measurement Conversion Chart
Kitchen Measurement Conversion Chart
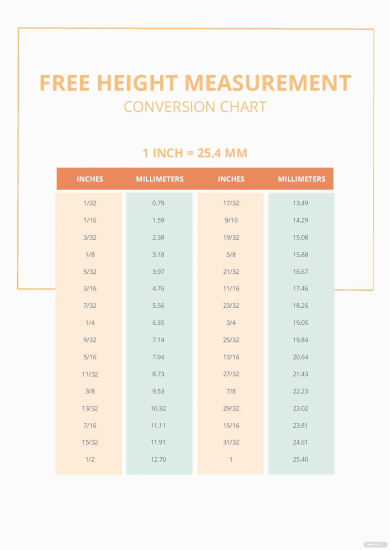
Free Height Measurement Conversion Chart
Basic Measurement Chart
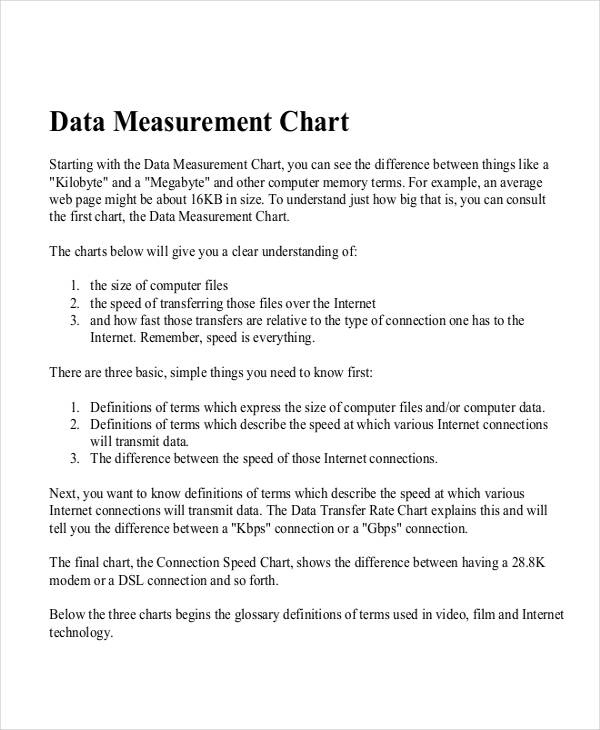
Data Measurement
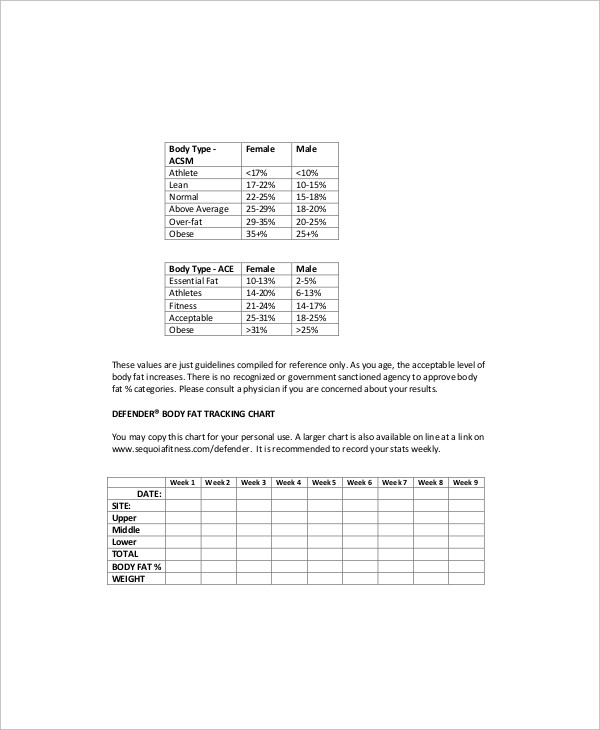
Body Fat Measurement Chart
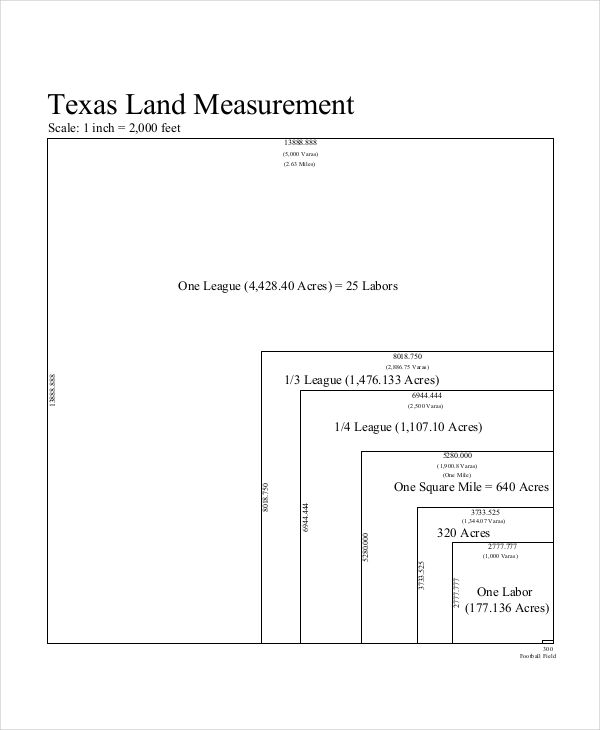
Land Measurement Chart
What Is a Measurement Chart?
In math class, we’re taught how to compute different metric conversions with the help of measurement charts. Sometimes, we’re even forced to familiarize each measurement conversion for exams. With this, you’re probably familiar with the measurement chart’s content.
A sample chart is used to define the points of measure of a given piece. These mathematical conversions guide us in making accurate measurements. Sooner or later, we become familiar with each value that we wouldn’t even need the chart anymore.
A common chart example that display measurements is a size chart.
How to Make a Height Measurement Chart?
A height measurement chart is often used by healthcare providers and parents to monitor their child’s growth.
This may be for medical purposes or for personal reasons. There are different ways to make a height measurement chart. Most height measurement charts are designed to be life-sized, so individuals may stand alongside the chart to measure themselves.
To make a height measurement chart, you must first choose a material for your chart.
The chart is typically made out of cardboard or wood. Height is generally measured in feet and inches, you can use a tape measure to properly indicate the measurements on your chart. Imagine the chart to be an over sized ruler. With this in mind, you can draw horizontal lines on different points of measure.
You must also label each point using their respective numerical values. Each measurement must be made as accurate as possible.
A growth chart is another chart example that is used to measure one’s body measurements.
Liquid Measurement
Cooking Measurement Chart
Measurement Conversion
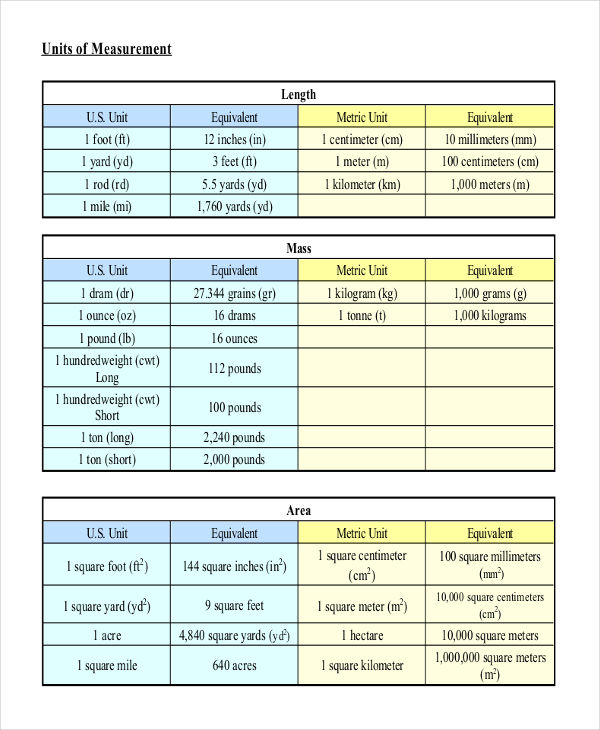
Measurement Units Chart
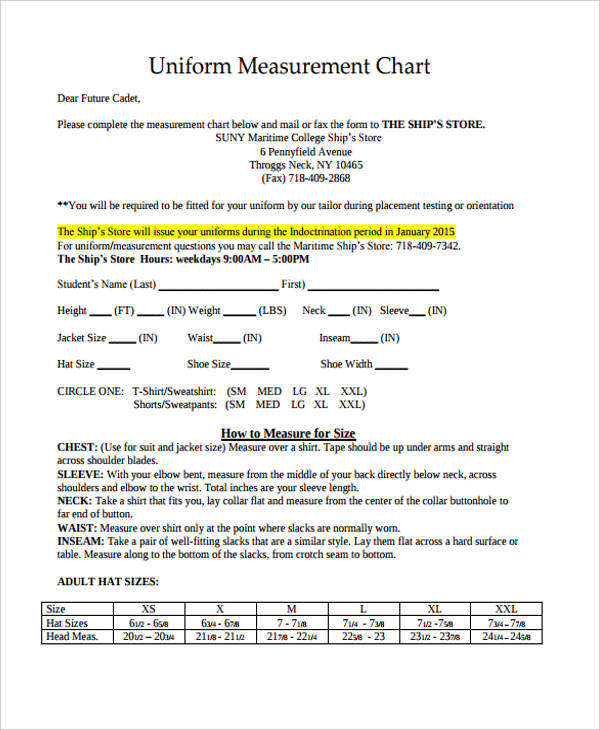
Uniform Measurement
Importance of a Measurement chart
Measurement charts may not be something you use on the daily but it’s definitely something you’ll find useful at different points of your life.
- For instance, some retail companies display measurements in centimeters on their size charts while others use inches.
You’re familiar with your personal measurements using the latter but not with centimeters. During situations like this, a measurement chart may come in handy for accurate conversions.
Measurement charts may also be useful for food preparation and science experiments. There’s nothing worse than a failed science experiment caused by inaccurate measurements. After all, inaccurate measurements may garner negative outcomes one way or another.
A measurement chart may also provide approximate visualizations. This is especially applicable for land measurements. It will make it easier for you to draw comparisons between the given land areas.
Overall, measurement charts serve as a proper guide for different reasons. There are other various sample chart examples that are used for similar purposes as well.
Share :
