9+ New Product Financial Analysis Examples to Download
In evaluating economic trends, setting financial policy, building long-term plans for business activity, and identifying companies for investment, a financial analysis must be conducted. Similarly, in having new product or new product line, an entity must carry a financial analysis to evaluate the budget for that certain new product and to compare to other similar products from competing companies.
In this way, you will know if the product is feasible and within the budget and it can compete in the market. The effect of this new product must also be constantly monitored by looking through the income statement, balance sheet, and cash flow of the entity for these are the areas in the financial statement that would be affected by the launching of the new product.
Wondering what does new product financial analysis look like? Below are several examples of new product financial analysis that will give you an idea on how to create one.
Consumer Goods Industry New Product Financial Analysis Example
Marketing Management New Product Financial Analysis Example
New Product Cost Estimations and Financial Analysis Example
Elements of a Financial Analysis
To have an overview of the financial standing of your entity or a certain product or product line of your business, a financial analysis is conducted which evaluates your financial health, an indicator of your business potential or the potential of your business to operate in long term.
Business owners must be knowledgeable enough to understand the results of the financial analysis and to take proper actions based on the results. In order to do this, first, you must know the basics of financial analysis.
There are five elements of a financial analysis that you must learn and understand. These are as follows:
Revenue
Different types of business have different sources of revenue. For example, for manufacturing entities, their source of revenue is from the sale of manufactured goods; for a merchandising business, their source of revenue is from the sale of the merchandise that they bought from their supplier; and for service companies, their source of revenue is from the services that they have provided. You may also see statement analysis examples.
Note that the term “revenue” differs from the “profit,” which will be discussed later, in a way that profit is arrived when you will deduct all the expenses of the company from the revenue. To simplify, revenue less expenses equals profit. You may also like investment analysis examples.
A company’s main source of case is their revenues. Revenues can also determine the long-term success of the business. An analysis of the revenue must be conducted in order to understand the current financial standing of an entity.
1. Revenue growth.
In calculating the revenue growth rate, you must divide the revenue growth, which is the revenue for this period less the revenue for the last period, by the revenue for the last period. It should be noted that when you calculate the revenue growth, you must not include one-time revenues for this can distort the simple analysis.
2. Revenue concentration.
This is a measure of how your total revenue is distributed among your customer base. Basically, when you are serving a large number of small-volume customers, you have a low customer concentration than those entities serving a handful of large customers account for the majority of its business. To compute, divide the revenue from client by the total revenue. You may also check out company analysis examples.
How does this analysis impact the sales of your business? The higher the revenue concentration, the greater the risk you are facing when it comes to your sales.
For example, if you have a handful of customers who buy big-time, this would result to higher revenue concentration, and this is risky because you could face financial difficulty if a certain customer stops buying. Hence, you must have diverse clients, and no client should represent more than 10% of your total revenues. You might be interested in define financial ratio analysis?
3. Revenue per employee.
This measures the productivity of your business by computing the average revenue generated by each employee of a company. This can be computed by dividing the revenue by the average number of employees. The higher the ratio, the more productive the employees. You may also see how to prepare a financial statement analysis.
Profit
A company’s profit is the amount left after you deduct all the expenses from the revenue. You must produce profit that would fuel your company to consistently operate for your business to run in a long term. Here are some profit analysis that you must conduct to evaluate if your business can run well in the future:
1. Gross profit margin ratio.
A gross profit margin will determine if you have the ability to absorb fluctuations in the revenue or cost of goods sold without losing the ability to pay for ongoing expenses.
This can be computed as follows: gross profit, which is revenues less cost of goods sold, divided by the revenues. This is important because it shows the investors how profitable the business is without taking into consideration the indirect costs and gives them insight of how healthy the company is. You may also like project analysis examples.
2. Operating profit margin ratio.
This will measure the company’s profitability and is computed as follows: operating profit margin, which is revenues less cost of goods sold less operating expenses, divided by revenues.
Note that you will deduct only the operating expenses, which are expenses that are directly related to your operation. This does not include your expenses on interest or taxes. This analysis in important for this will determine your company’s ability to make a profit regardless of how you finance operations, either debt or equity funding. The higher the operating profit margin ratio, the better. You may also check out what are the limitations of ratio analysis?
3. Net profit margin ratio.
In the previous item, only the operating expenses are deducted from the revenues, but for net profit margin ratio, all the expenses are deducted from the revenues to arrive at the net profit margin, which will be divided by the revenues to arrive at the net profit margin ratio. You might be interested in define profitability ratio analysis?
This is the measurement of what remains for reinvestment into your business and for distribution to owners in the form of dividends after all the expenses have been deducted. It is both a measurement of efficiency and overall business health. So basically, companies with high net profit margin ratios have the high probability to survive during a period of economic contraction. You may also see critical analysis examples.
New Product Criteria and Financial Analysis Example
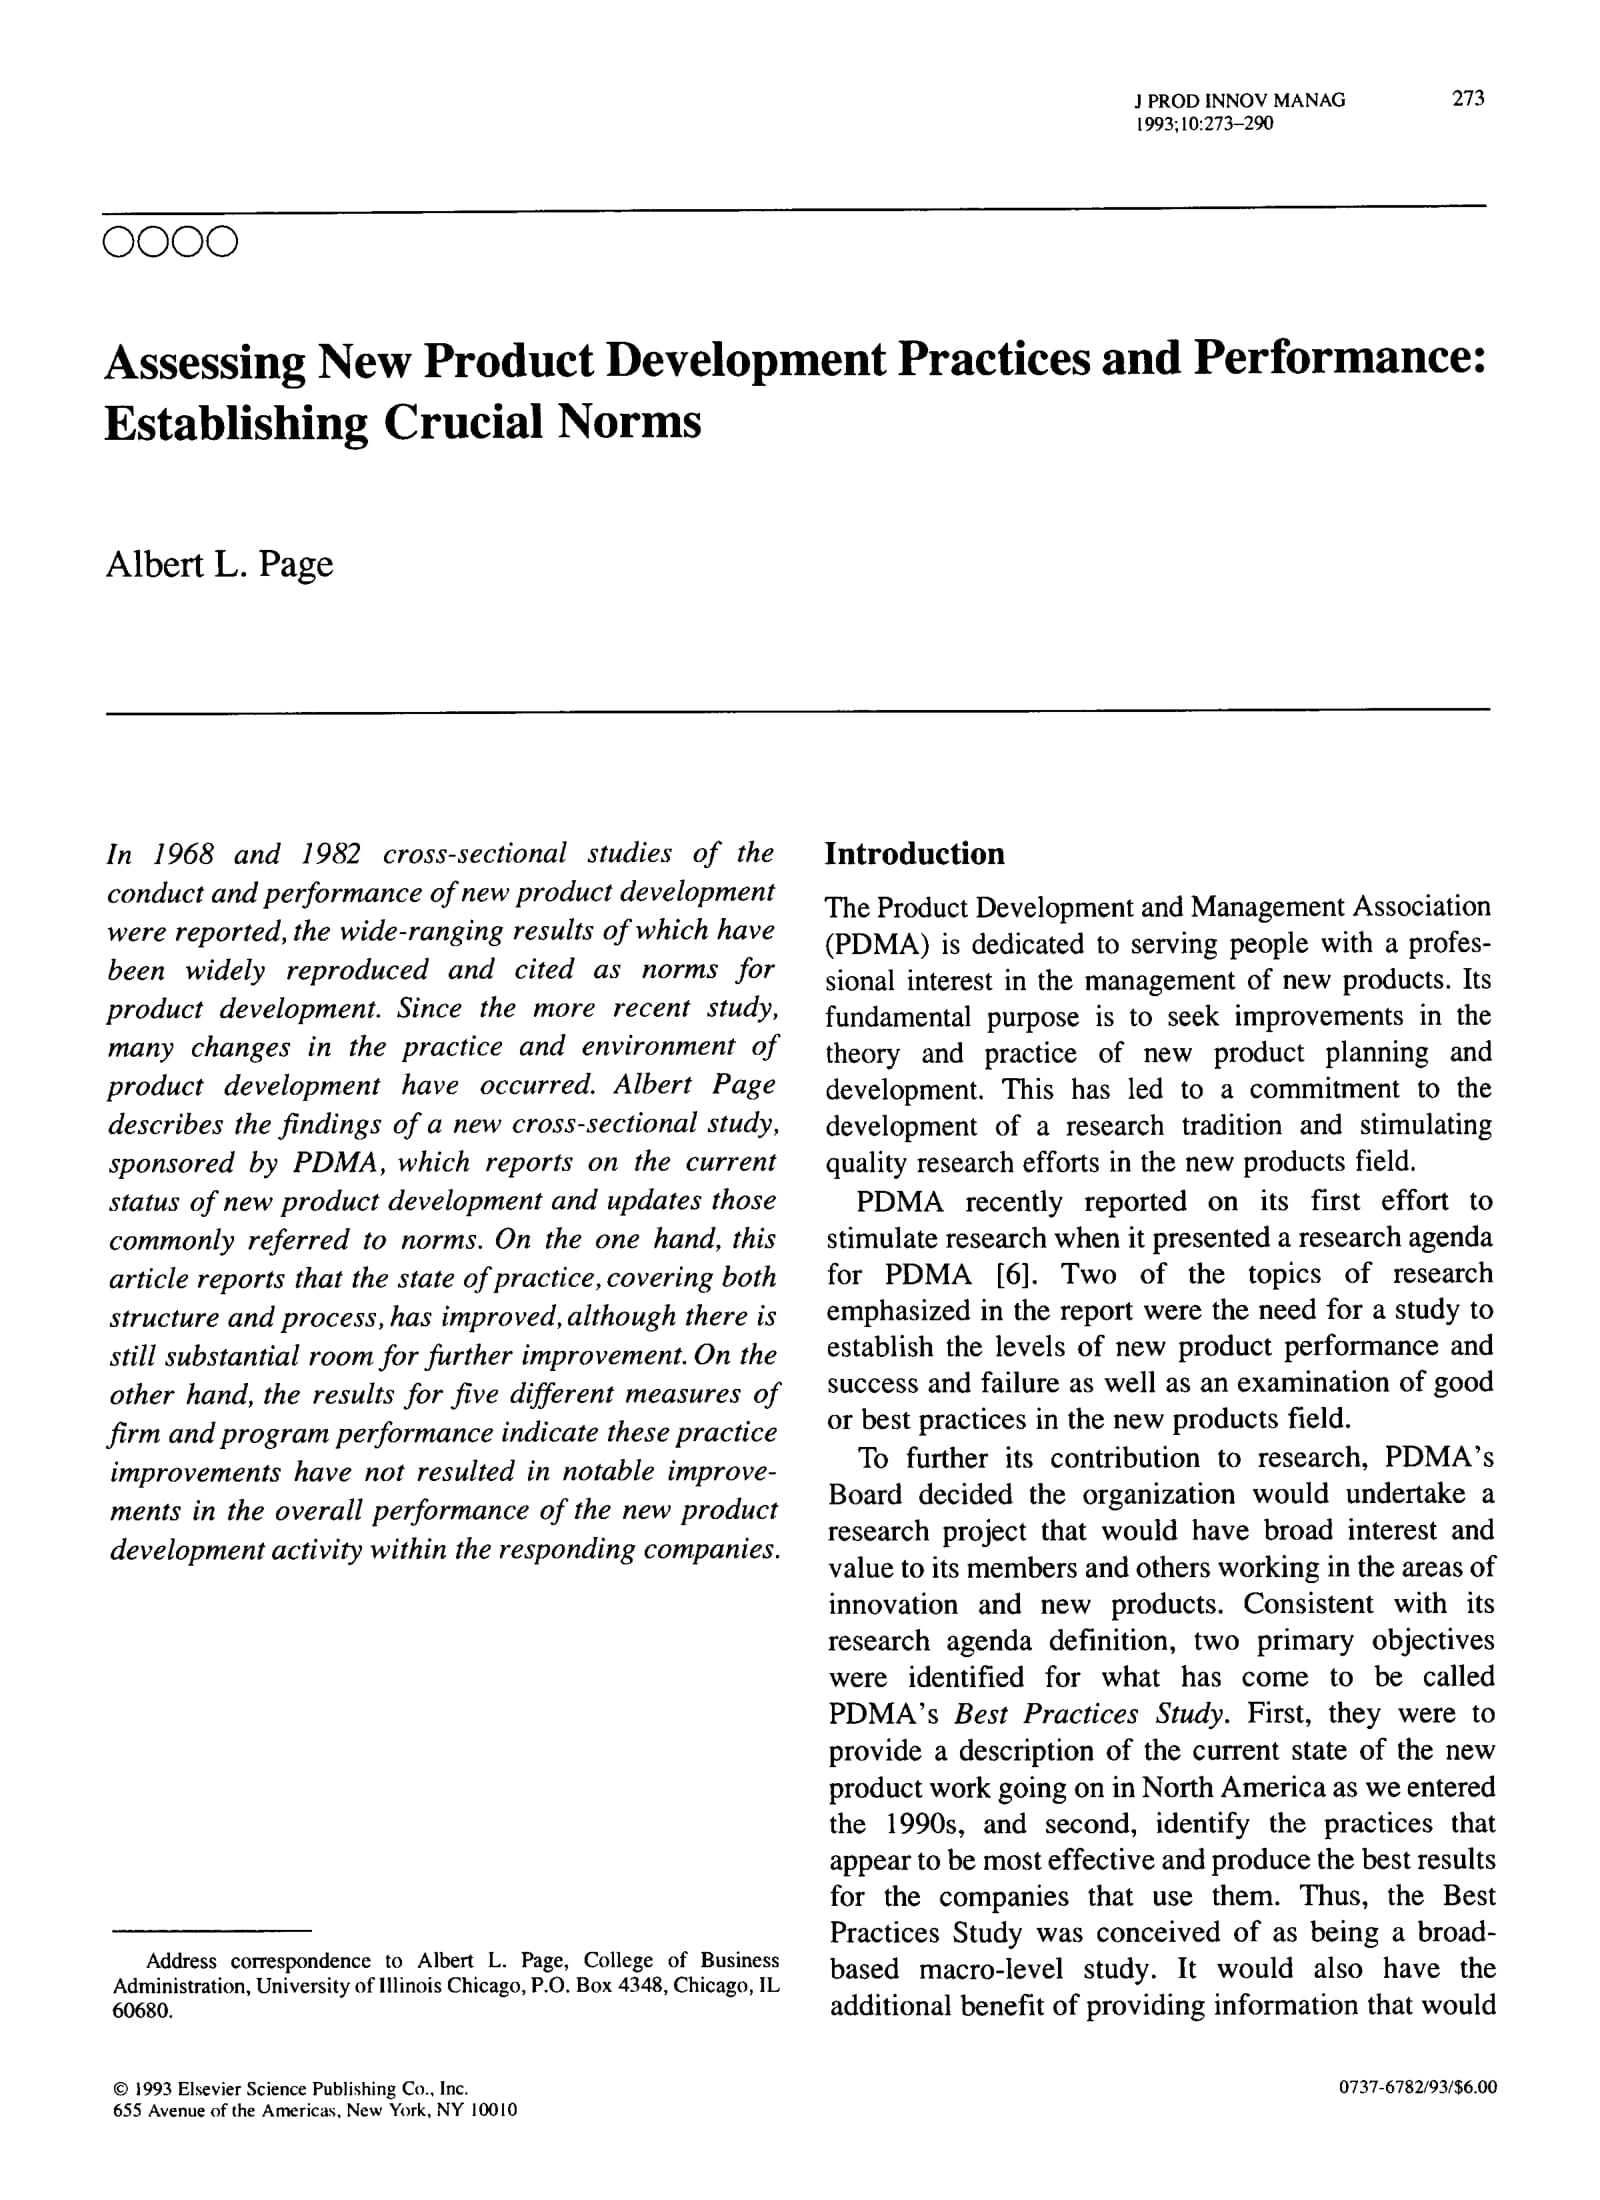
New Product Development Practices and Financial Analysis Example
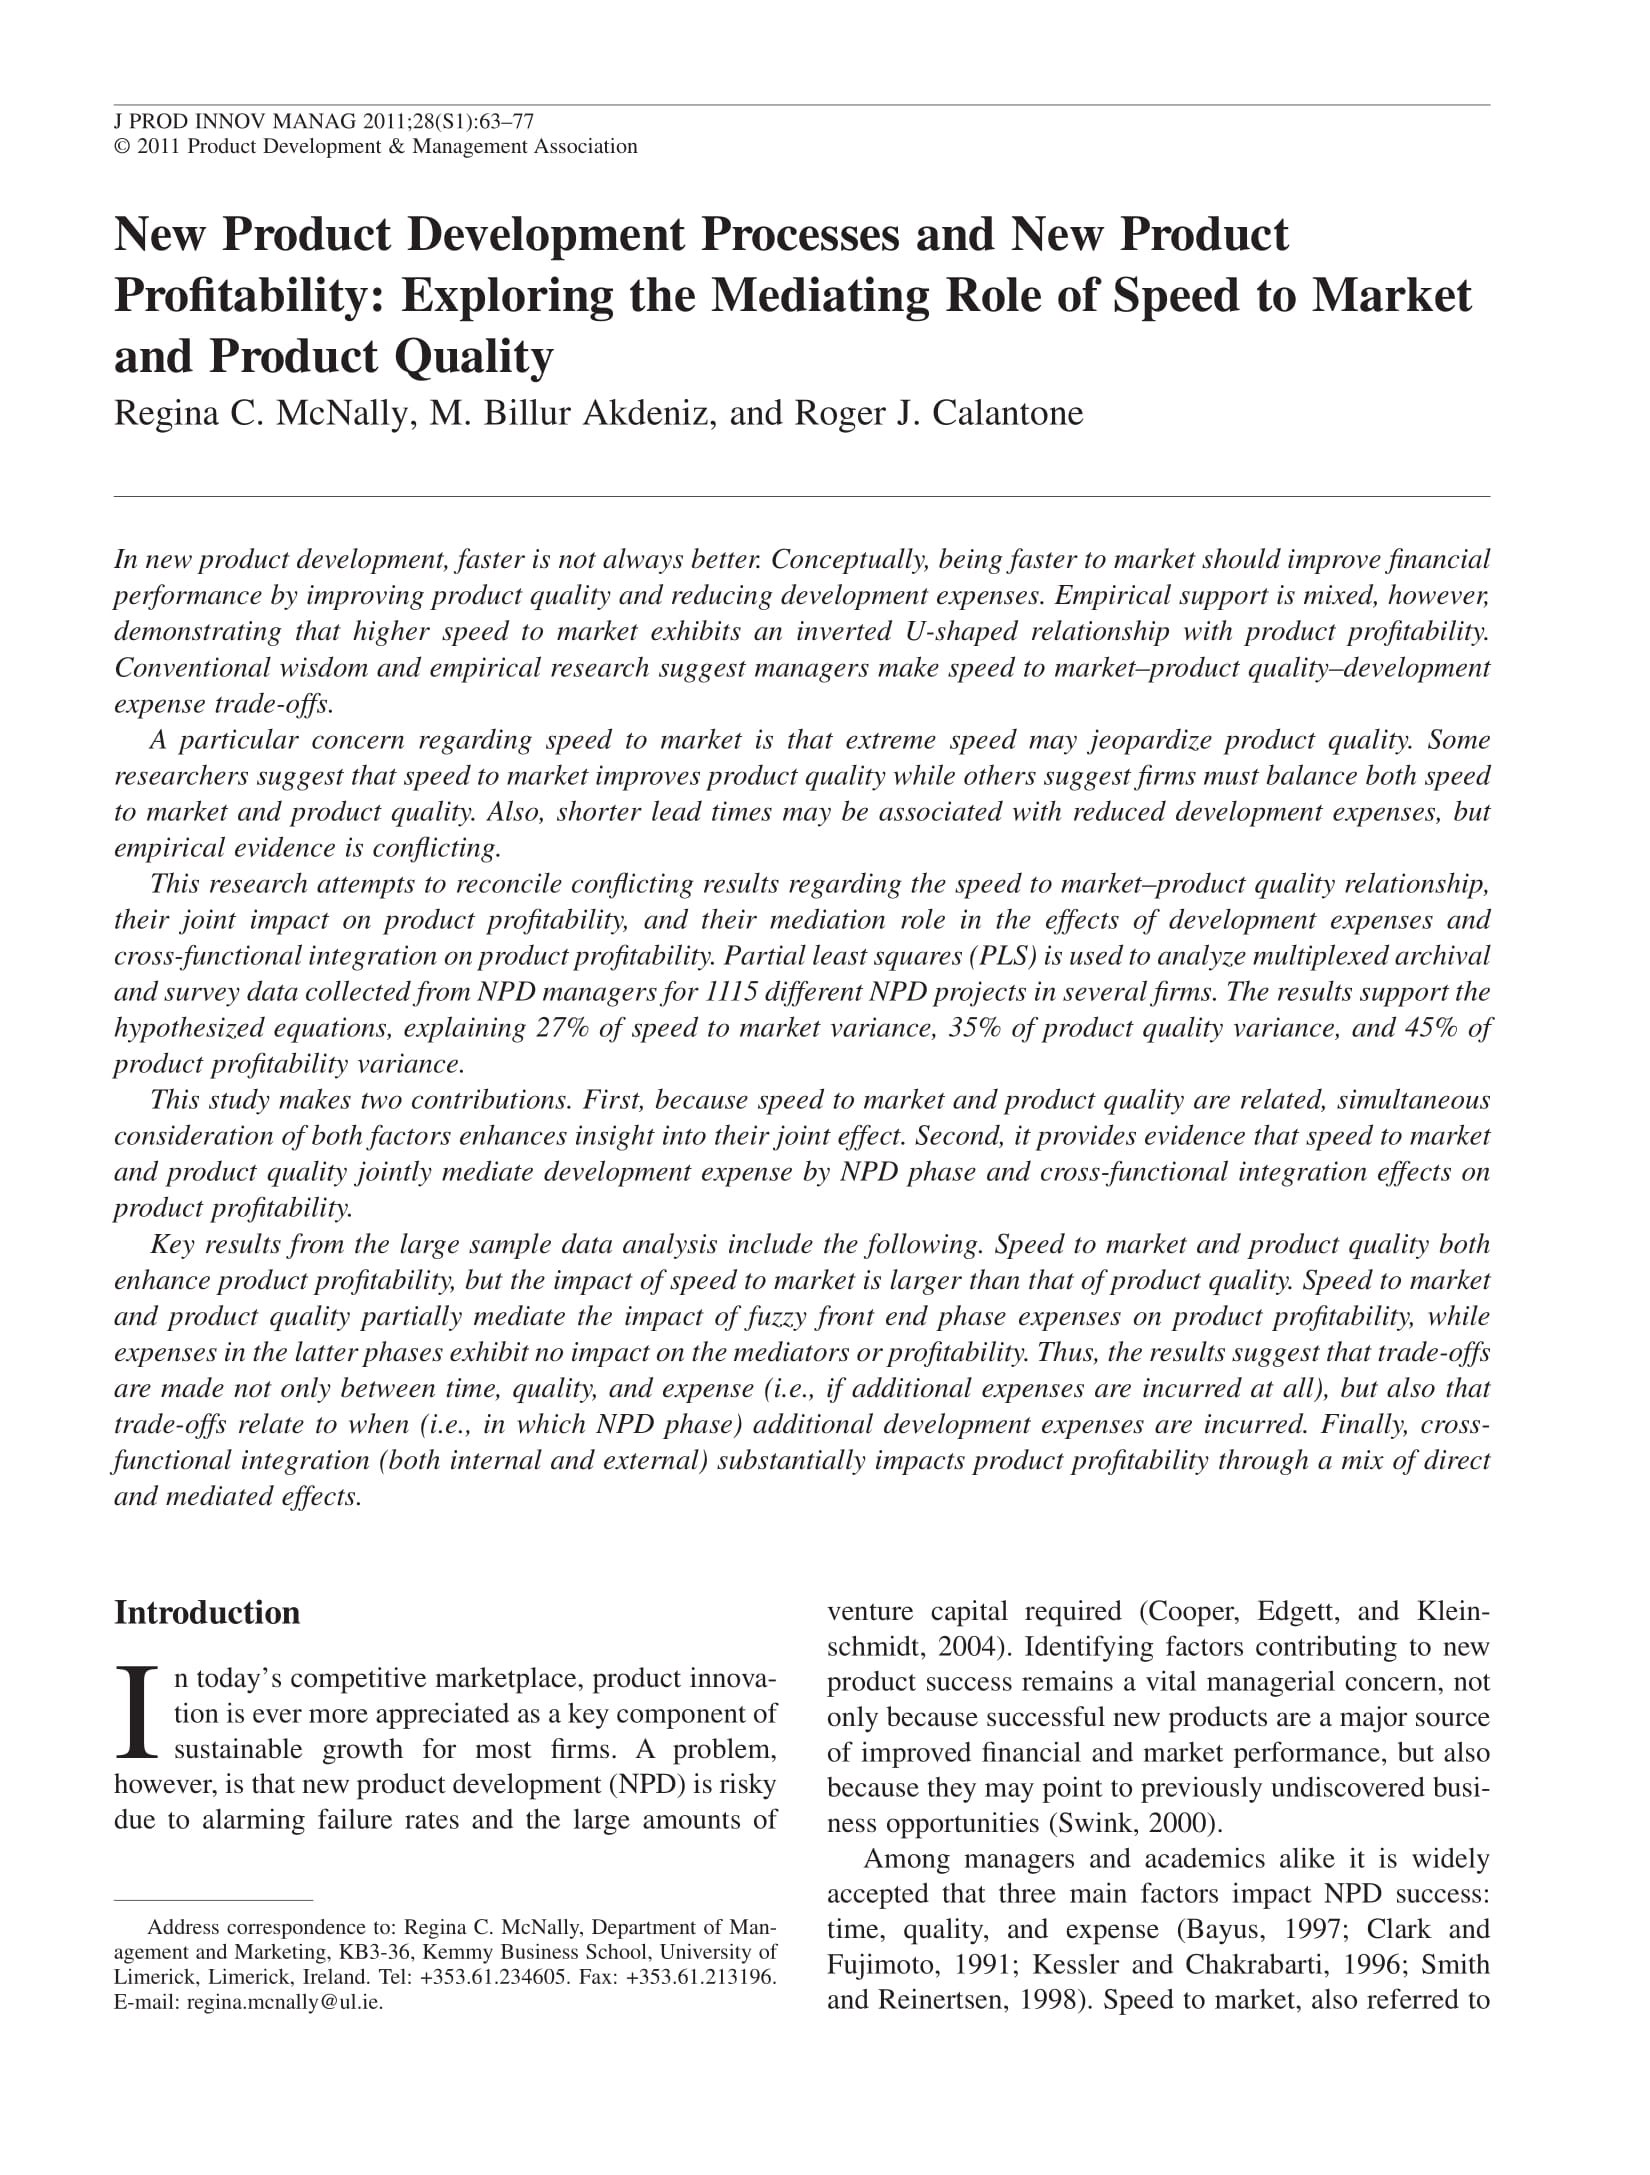
New Product Development Process Financial Analysis Example
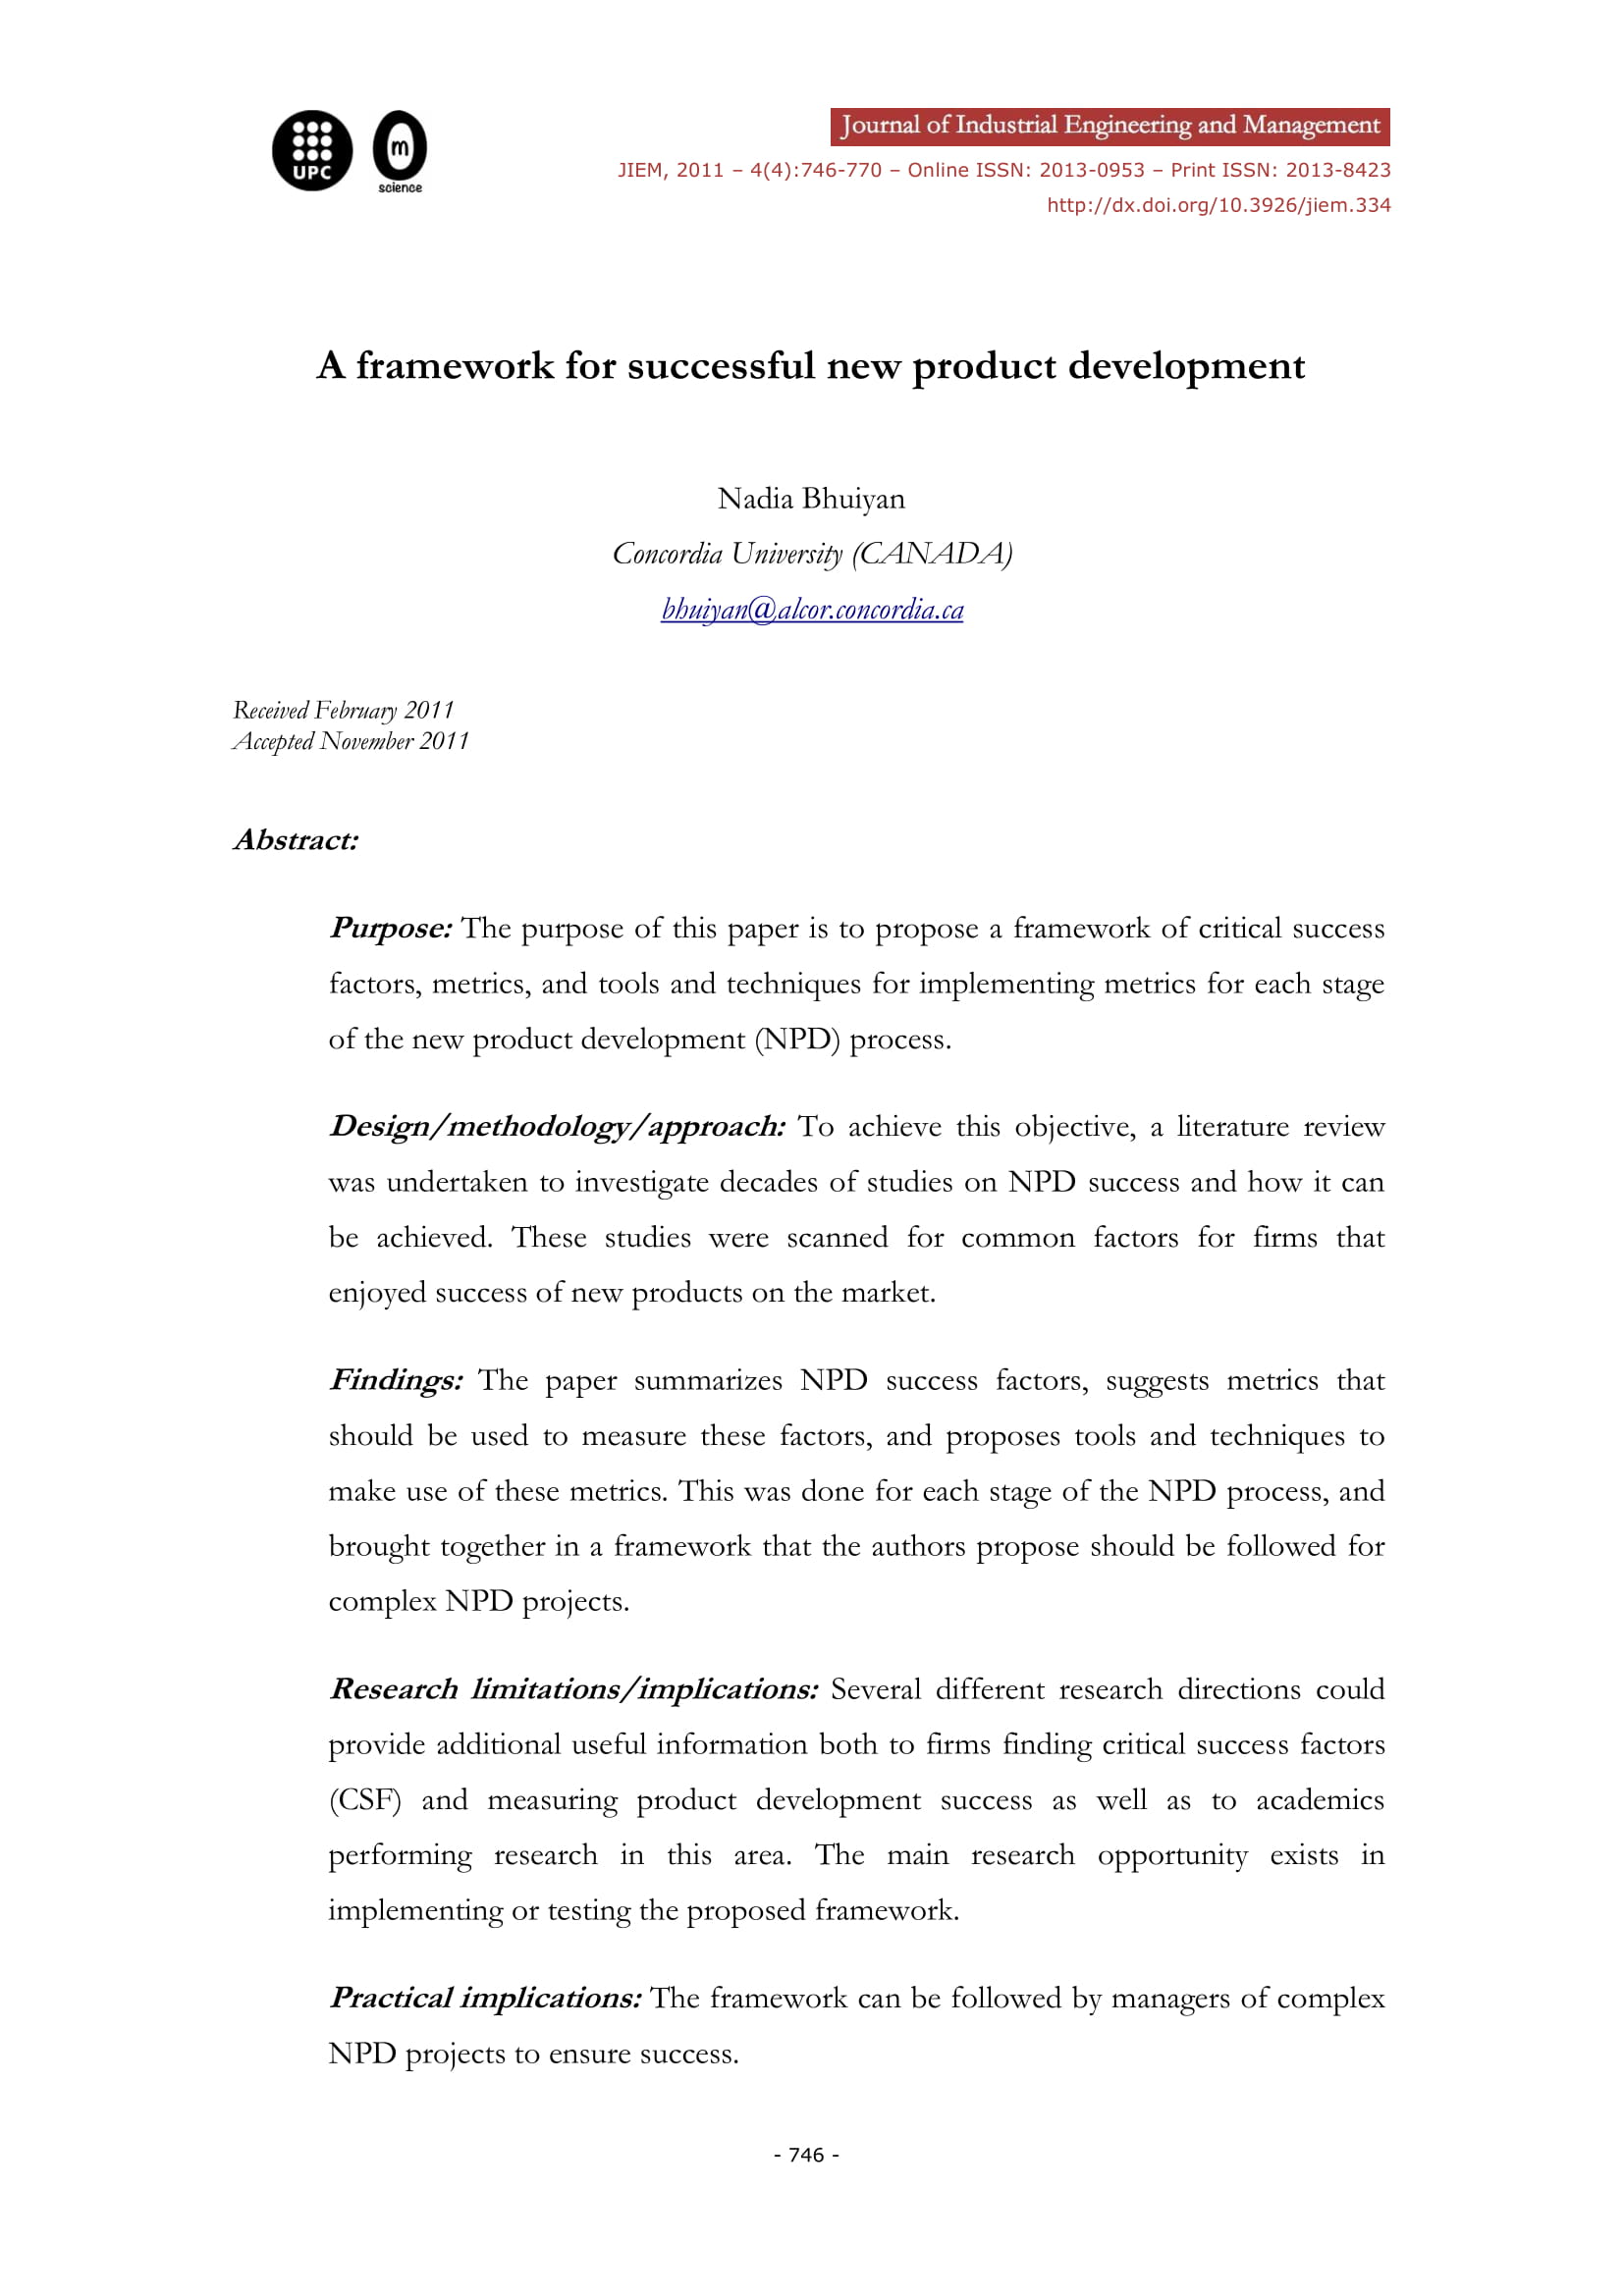
New Product Framework and Financial Analysis Example
Operational Efficiency
Operational efficiency is the capability of a company in utilizing the company’s resources, delivering the products or services to the customers in the most cost-effective manner possible, and ensuring the high quality of those products or services. The company must know how to minimize redundancy and waste and utilize the resources and workforce that contribute most to its success to attain operational efficiency. You may also see decision tree analysis examples.
1. Accounts receivable turnover ratio.
This is computed by dividing the net credit sales by the average accounts receivable. This measures how efficiently an entity manages the credit they extend to their customers.
A higher accounts receivable turnover ratio means that a company is managing credit well while a ratio is a sign you must improve how you collect credits from customers. You may also compare your accounts receivable turnover ratio with the other competing companies in the same industry to determine if you are doing well in your credit collection over your competitors. You may also like sales analysis examples.
2. Inventory turnover ratio.
This is computed by dividing the cost of goods sold by the average inventory, which is beginning inventory plus ending inventory divided by two. This measures how efficiently you manage inventory.
A high inventory turnover ratio would mean that your inventory is constantly rolling due to high sales while a low inventory turnover ratio means that you are not selling well or you are producing too much for your current level of sales. The implication of having high inventory is that you would have an increased holding expenses for that inventory. You may also check out risk analysis examples.
Capital Efficiency and Solvency
Lenders and investors are greatly interested on your company’s efficiency and solvency. The capital efficiency of a company is a ratio between the expenses incurred by a company and the expenses to manufacture a product or service. This is also called the return on capital employed or the ratio between the earnings before interests and taxes and the capital employed. You might be interested in needs analysis examples.
On the other hand, solvency indicates whether the cash flow of the company is sufficient to meet its liabilities. Solvency ratio is a ratio used to measure an entity’s ability to meet its debt and obligations. If a company has a lower solvency ratio, this would mean that there is a greater probability that it will default on its liabilities. Here are some efficiency and solvency ratios that would help you assess your company. You may also see operational analysis examples.
1. Return on equity.
This can be computed as follows: net income divided by the shareholder’s equity. This represents the return that the investors of your company are generating from your business. This is a measure of the efficiency of a business. A high return on equity would mean that the company can generate an income while only using a small amount of capital, indicating how well a company’s management is deploying its shareholder’s capital. You may also see impact analysis examples.
However, you must also note that a high level of debt can artificially boost your return on equity as well as write-downs and share buybacks. The more debt the company has, the less shareholder’s equity it has which would result in higher return on equity. You may also like regression analysis examples.
2. Debt to equity.
Apparently, this is the ratio of debt over the equity which indicates how much leverage a company is using in order to operate. A low debt-to-equity ratio indicates a lower amount of financing by debt via lenders versus funding through equity via shareholders. A higher ratio indicates the company is getting more of their financing from borrowing, which may pose a risk to the company if debt levels are too high. You may also check out factor analysis examples.
Liquidity
Liquidity is the ability of your company to generate cash to cover your expenses. Current ratio and interest coverage can help you measure the liquidity of your company.
1. Current ratio.
This is calculated as follows: current assets divided by current liabilities. This measures the ability of a company to pay off short-term obligations when they fall due. You might be interested in cost benefit analysis examples.
2. Interest coverage.
This is calculated by dividing the earnings before interest and taxes by the interest expense. This measures the ability of the company to pay interest expense from the cash they generate.
New Product Launch and Financial Analysis Example
New Product Launch Process and Financial Analysis Example
New Product Process and Financial Analysis Example
Final Words
A company must constantly perform financial analysis especially when launching a new product. After that, it must constantly monitor the trends and ratio, which are indicators of the financial health of a company. There are five elements of financial analysis that you must know, namely revenue, profit, operational efficiency, capital efficiency and solvency, and liquidity.
You must have at least a general knowledge and the knowledge on how to interpret and analyze the relationship of the components of your balance sheet, financial statement, and cash flows as these are the usual areas that you need to focus on when talking about the enhancement and improvement of your company.
The discussion above would help you not only calculate the important ratios for your company but also interpret the results of your calculations. Lastly, the examples presented above would definitely help you understand more about new product financial analysis. You may also see free analysis examples.


