10+ Data Analysis Plan Examples to Download
With the use of a data analysis plan, you will probably know what to do when you are opting to analyze the data you have gathered. It is one of the most essential things to have that guides you on how you are going to do data collection appropriately. For some reasons, you might want to make sure that you are creating an effective plan. Through that, you should have gathered information that answers some questions in which you probably would want to know about. Having a good plan saves time. It is actually a very good idea to put some data that makes sense to your data analysis plan. Otherwise, you will feel disappointed and may think that what you are doing is worthless.
10+ Data Analysis Plan Examples
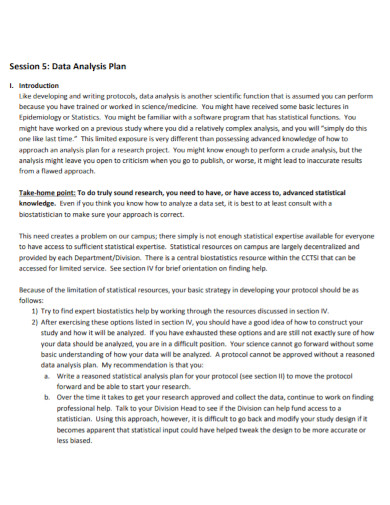
1. Data Analysis Plan Template
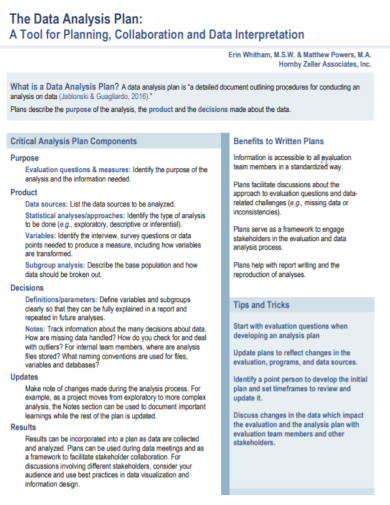
2. Survey Data Analysis Plan Template
3. Qualitative Data Analysis Plan Template
4. Scientific Data Analysis Plan
5. Standard Data Analysis Plan
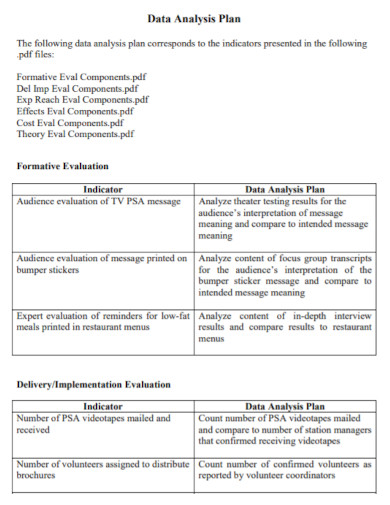
6. Formative Data Analysis Plan
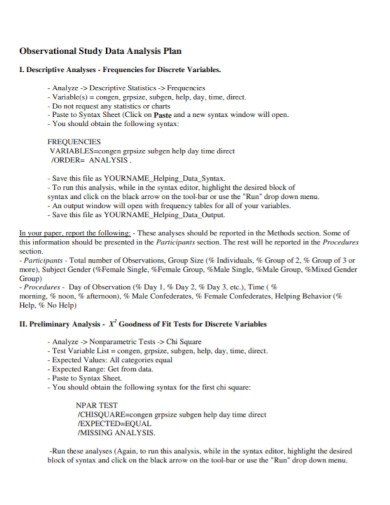
7. Observational Study Data Analysis Plan
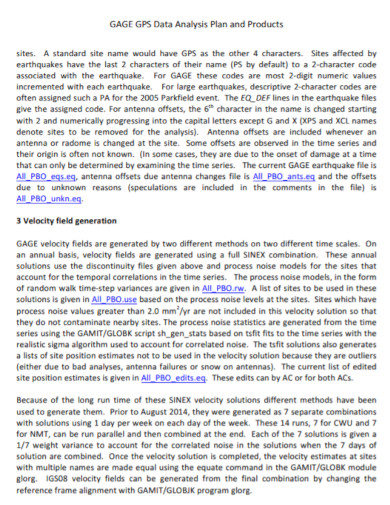
8. Data Analysis Plan and Products
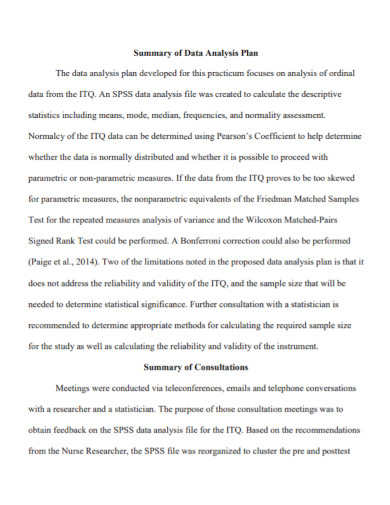
9. Summary of Data Analysis Plan
10. Professional Data Analysis Plan
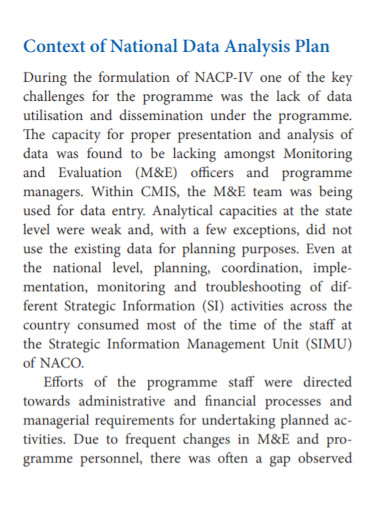
11. National Data Analysis Plan
Data Analysis Plan Definition
A data analysis plan is a roadmap that tells you the process on how to properly analyze and organize a particular data. It starts with the three main objectives. First, you have to answer your researched questions. Second, you should use questions that are more specific so that it can easily be understood. Third, you should segment respondents to compare their opinions with other groups.
Data Analysis Methods
Some data analysts would use a specific method. They usually work on both the qualitative data and quantitative data. Below are some of the methods used.
1. Regression Analysis
This is commonly used when you are going to determine the relationship of the variables. You are looking into the correlation of the dependent variable and independent variable. This aims to give an estimation of how an independent variable may impact the dependent variable. This is essential when you are going to make predictions and forecasts.
2. Monte Carlo Simulation
Expect different outcomes when you are making a decision. As individuals, we tend to weigh what’s better. Is it the pros or the cons? However, we cannot easily take which journey should we be going. We have to calculate all the potential risks. In the Monte Carlo Simulation, you are going to generate potential outcomes. This is usually used when you have to conduct a risk analysis that allows you to have a better forecast of what might happen in the future.
3. Factor Analysis
This is a kind of technique used to reduce large numbers to smaller ones. It works whenever multiple observable variables tend to correlate with each other. This is proven useful for it tends to uncover some hidden patterns. This would allow you to explore more concepts that are not easy to measure.
4. Cohort Analysis
A cohort analysis allows you to divide your users into small groups. You are going to monitor these groups from time to time. It is like examining their behavior which can lead you to identify patterns of behavior in a customer’s lifecycle. This is useful especially in business companies because it will serve as their avenue to tailor their service to their specific cohorts.
5. Cluster Analysis
This type of method identifies structures within the set of data. Its aim is to sort data into groups within clusters that are similar to each other and dissimilar to another cluster. This will help you gain insight as to how your data should be distributed.
6. Time Series Analysis
This is a statistical method that is used to determine trends. They measure the same variable to forecast how these variables would fluctuate in the future. There are three main patterns when conducting time series analysis. They are the trends, seasonality, and cyclic patterns.
7. Sentiment Analysis
There are insights that you can learn from what other people write about you. Using a sentiment analysis, you will be able to sort and understand data. Its goal is to interpret emotions that are being conveyed in the data. This may let you know about how other people feel about your brand or service.
FAQs
What do you mean by aspect-based sentiment analysis?
An aspect-based sentiment analysis allows you to determine the type of emotion a customer writes that pertains to a featured product or campaign.
What is NLP?
NLP stands for Natural Language Processing. This is helpful in sentiment analysis because they use systems which are trained to associate inputs with outputs.
Why does identifying demographic groupings important?
This helps you understand the significance of your data and figure out what steps you need to perform to improve.
There have been a lot of methods to be used in data analysis plan, but it is also a good start to familiarize with the kind of data you have. It goes the same thing with the insights that are considered useful in the analysis. Having a good data plan can actually save your entire research. You just have to think logically to avoid errors before they can actually happen. One more thing to tell is that there have been a lot of data collection records among students. The moment you forgot about your variables and your data, your plan will become absolutely useless.


![10+ Data Analysis Plan Examples [ Statistical, Survey, Scientific ]](https://images.examples.com/wp-content/uploads/2021/05/10-Data-Analysis-Plan-Examples-Statistical-Survey-Scientific-.jpg)
