50+ Quantitative Data Examples to Download
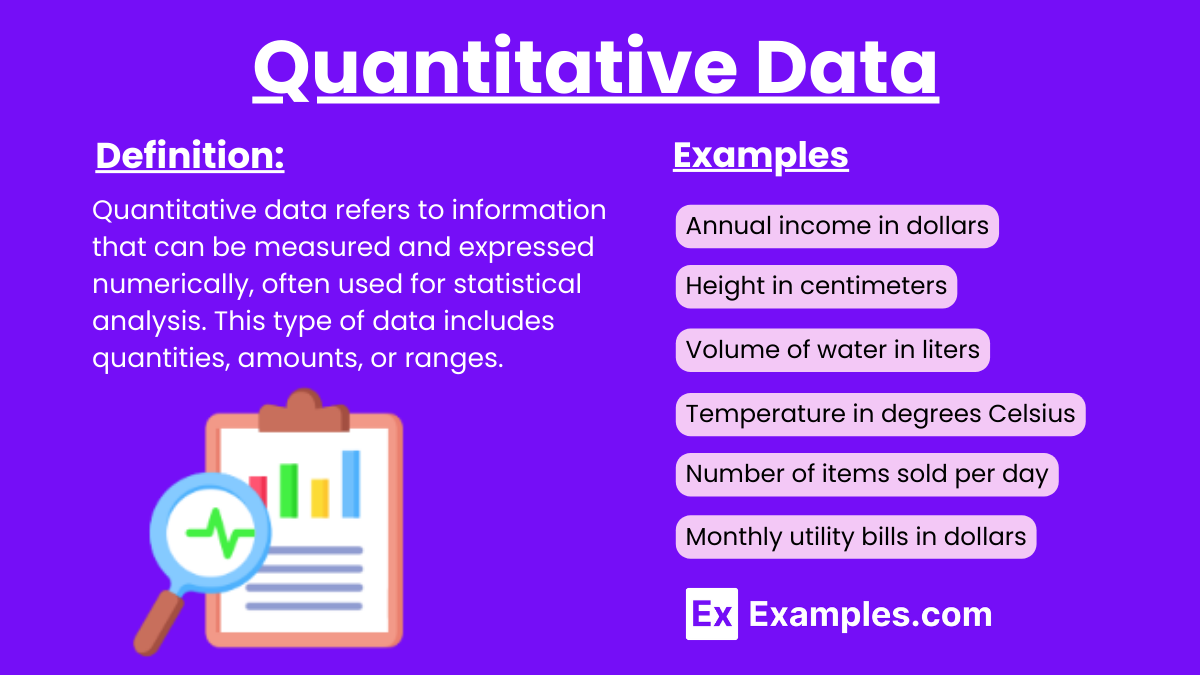
Quantitative data refers to information that can be measured and expressed numerically. This type of data is crucial for performing quantitative analysis, a method used to evaluate numerical data to uncover patterns, correlations, and trends. In fields like finance, economics, and the natural sciences, quantitative risk analysis is utilized to assess potential risks by quantifying their probability and impact. The precision and objectivity of quantitative data make it essential for making data-driven decisions and forming the basis for statistical analysis.
What is Quantitative Data?
Quantitative data is numerical information that can be measured and analyzed statistically. It represents quantities and allows for objective comparison and analysis.
Examples of Quantitative Data
- Age in years
- Height in centimeters
- Weight in kilograms
- Temperature in degrees Celsius
- Number of siblings
- Annual income in dollars
- Distance in miles
- Test scores in percentages
- Number of books read in a year
- Time in minutes
- Number of employees in a company
- Population of a city
- Speed in miles per hour
- Number of students in a class
- Price of a product in dollars
- Volume of water in liters
- Number of steps taken in a day
- Daily calorie intake
- Frequency of visits to the gym per month
- Number of social media followers
- Hours of sleep per night
- Number of pages in a book
- Length of a movie in minutes
- Number of items sold per day
- Score in a game
- Number of cars in a parking lot
- Monthly utility bills in dollars
- Number of courses completed
- Quantity of rainfall in millimeters
- Number of products in inventory
- Blood pressure readings
- Number of phone calls made per day
- Distance run in a week in kilometers
- Number of website visits per month
- Number of pets owned
- Number of countries visited
- Monthly rent in dollars
- Number of clients served
- Weight of luggage in pounds
- Number of trees in a park
- Annual sales revenue in dollars
- Number of hours worked per week
- Quantity of milk produced by a cow in liters
- Number of concerts attended per year
- Number of patients treated in a hospital
- Number of goals scored in a season
- Monthly savings in dollars
- Number of chapters in a novel
- Frequency of meetings per week
- Number of assignments submitted
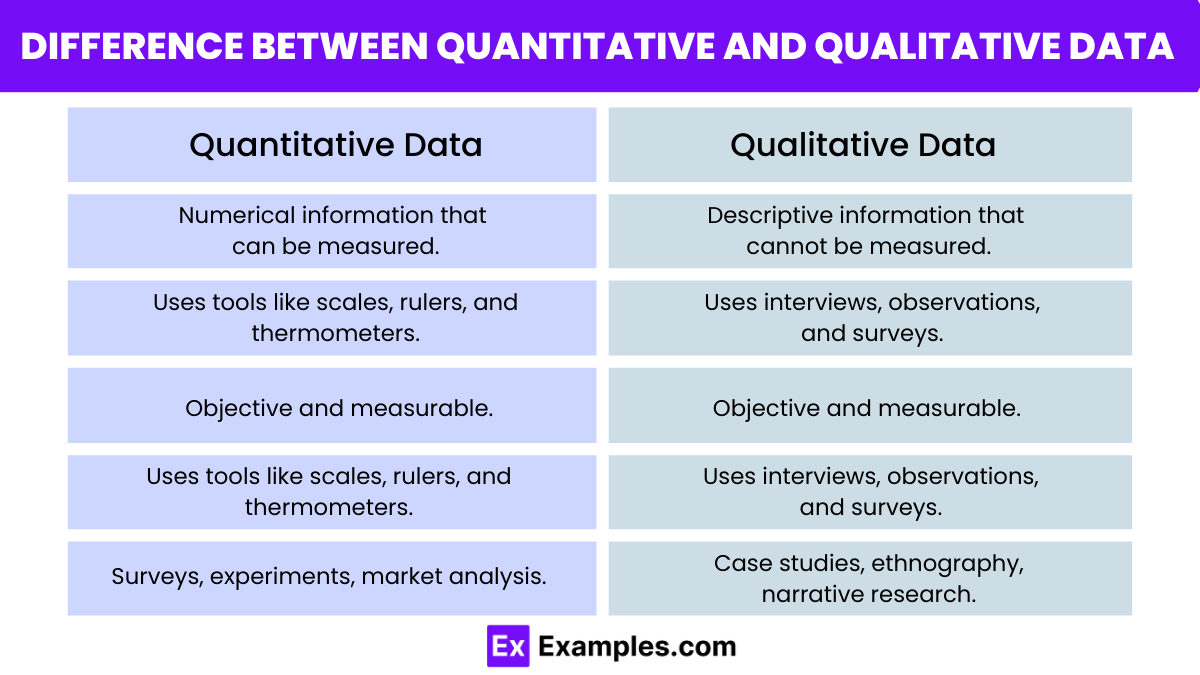
What is the Difference Between Quantitative and Qualitative Data?
| Aspect | Quantitative Data | Qualitative Data |
|---|---|---|
| Definition | Numerical information that can be measured. | Descriptive information that cannot be measured. |
| Nature | Objective and measurable. | Subjective and interpretive. |
| Examples | Height, weight, age, income. | Opinions, feelings, experiences, colors. |
| Data Type | Numbers and statistics. | Words, images, symbols. |
| Measurement | Uses tools like scales, rulers, and thermometers. | Uses interviews, observations, and surveys. |
| Analysis Method | Statistical and mathematical analysis. | Thematic and content analysis. |
| Purpose | To quantify variables and analyze relationships. | To understand concepts, thoughts, and experiences. |
| Results | Specific and can be generalized. | Detailed and rich in context, not easily generalized. |
| Examples of Use | Surveys, experiments, market analysis. | Case studies, ethnography, narrative research. |
| Data Representation | Graphs, charts, tables. | Narratives, quotes, descriptions. |
What are the Different Types of Quantitative Data?
1. Discrete Data
Discrete data represents countable items. It is often whole numbers and does not include fractions or decimals. This type of data is used in scenarios where items can only be counted in whole units.
Examples:
- Number of students in a classroom
- Number of cars in a parking lot
- Number of books in a library
2. Continuous Data
Continuous data can take any value within a range. This type of data includes fractions and decimals, making it suitable for measurements that require precision.
Examples:
- Height in centimeters
- Weight in kilograms
- Temperature in degrees Celsius
Application in Research:
- Data Analysis: Both discrete and continuous data are fundamental in data analysis, allowing researchers to perform statistical tests, create models, and derive insights from numerical information.
- Historical Research: Quantitative data in historical research helps in understanding trends over time, such as population growth, economic changes, and social developments.
- Quantitative Research: This Quantitative research method relies heavily on quantitative data to test hypotheses, establish patterns, and predict outcomes, making it vital for scientific, economic, and social research.
How is Quantitative Data Collected?
1. Surveys and Questionnaires
These tools gather numerical information by asking people questions. Respondents choose from set options, making it easy to count and compare answers.
2. Experiments
Researchers conduct experiments by changing variables to see how they affect other variables. This helps in understanding cause and effect.
3. Observations
In this method, data is collected by watching and recording events or behaviors as they happen. For example, counting how many people enter a store.
4. Existing Records and Databases
Quantitative data can also be found in existing sources like government reports, academic studies, or company records. Researchers use this data for analysis.
5. Sensors and Instruments
Devices like thermometers, scales, and GPS units measure physical quantities and provide precise numerical data.
6. Structured Interviews
Interviewers ask a set list of questions to gather numerical responses from participants. This method ensures consistency in the data collected.
Interval vs. ratio data
| Feature | Interval Data | Ratio Data |
|---|---|---|
| Definition | Data with equal intervals between values but no true zero point. | Data with equal intervals between values and a true zero point. |
| Examples | Temperature in Celsius or Fahrenheit, IQ scores | Height, weight, age, income, temperature in Kelvin |
| Zero Point | Arbitrary zero (e.g., 0°C does not mean “no temperature”) | True zero (e.g., 0 kg means “no weight”) |
| Mathematical Operations | Addition and subtraction are meaningful (e.g., difference in temperature). | All arithmetic operations are meaningful (e.g., you can multiply and divide). |
| Measurement | Measures differences between values | Measures differences and ratios between values |
| Example of Usage | Measuring temperature changes between cities | Comparing heights of different individuals |
How is quantitative data analyzed?
1. Data Collection
Before analysis, ensure that data is accurately and reliably collected through methods such as surveys, experiments, or existing records.
2. Data Cleaning
Clean the data by removing any errors, duplicates, or inconsistencies. This step ensures that the data set is accurate and ready for analysis.
3. Descriptive Statistics
Use descriptive statistics to summarize and describe the main features of the data. This includes measures such as:
- Mean: The average value.
- Median: The middle value when data is ordered.
- Mode: The most frequently occurring value.
- Standard Deviation: A measure of the amount of variation or dispersion in the data.
4. Data Visualization
Visualize the data to identify patterns, trends, and outliers. Common visualization techniques include:
- Histograms: Show the distribution of data.
- Bar Charts: Compare different groups.
- Line Graphs: Show trends over time.
- Scatter Plots: Identify relationships between variables.
5. Inferential Statistics
Apply inferential statistics to make predictions or inferences about a population based on a sample of data. This involves:
- Hypothesis Testing: Determining if there is enough evidence to support a specific hypothesis.
- Confidence Intervals: Estimating the range within which a population parameter lies.
- Regression Analysis: Examining the relationship between variables.
6. Data Interpretation
Interpret the results to draw conclusions and make informed decisions. This step involves understanding the implications of the statistical findings and how they relate to the research question or problem.
7. Reporting Results
Present the findings in a clear and concise manner. This may involve writing reports, creating presentations, or publishing research papers. Ensure that the results are communicated effectively to the target audience.
What’s the Difference Between Descriptive and Inferential Analysis of Quantitative Data?
| Aspect | Descriptive Analysis | Inferential Analysis |
|---|---|---|
| Definition | Summarizes and describes the main features of a data set. | Makes predictions or inferences about a population based on a sample of data. |
| Purpose | Provides an overview and understanding of the current data. | Extends findings from a sample to a larger population, estimating population parameters. |
| Techniques | – Mean, median, mode<br>- Standard deviation<br>- Range<br>- Frequency distribution<br>- Percentiles<br>- Data visualization (e.g., charts, graphs) | – Hypothesis testing<br>- Confidence intervals<br>- Regression analysis<br>- ANOVA (Analysis of Variance)<br>- Chi-square tests |
| Data Use | Uses all data points in the data set. | Uses a sample of data to make generalizations about a larger population. |
| Example | Calculating the average age of students in a class. | Using a sample to estimate the average age of all students in a school district. |
| Outcome | Provides summaries such as central tendency and variability. | Provides insights about population parameters, including margins of error. |
| Application | Suitable for initial data exploration and presentation. | Suitable for testing hypotheses and making predictions. |
What are the Advantages and Disadvantages of Quantitative Data?
Advantages
Objectivity and Reliability: Quantitative data is based on measurable values, which makes it more objective and less prone to bias. The results are replicable, allowing for consistent verification of findings.
Precision and Consistency: Quantitative data allows for precise measurement and quantification. This precision helps in making accurate comparisons and analyzing trends over time.
Statistical Analysis: The numerical nature of quantitative data enables the use of statistical analysis to identify patterns, relationships, and causal effects. Advanced statistical methods can be applied to test hypotheses and make predictions.
Generalizability: Large sample sizes and standardized data collection methods enable findings to be generalized to larger populations, enhancing the external validity of the research.
Efficient Data Collection: Quantitative data collection methods, such as surveys and experiments, can be more efficient and quicker to administer to large groups compared to qualitative methods.
Clear Data Presentation: Quantitative data can be easily presented using graphs, charts, and tables, making it easier to communicate findings clearly and effectively.
Disadvantages
Limited Flexibility: Standardized data collection methods can be rigid, not allowing for flexibility in exploring unexpected results or new avenues of inquiry.
Potential for Misinterpretation: Without proper understanding of statistical methods and the context of the data, there is a risk of misinterpreting the results. Misleading conclusions can be drawn from incorrect or incomplete analysis.
Resource Intensive: Collecting large amounts of quantitative data can be resource-intensive, requiring significant time, effort, and financial investment for surveys, experiments, and data analysis.
Measurement Errors: Errors in measurement tools or data entry can affect the accuracy and reliability of quantitative data. Small errors can lead to significant deviations in the results.
Limited Depth: Quantitative data typically does not provide in-depth insights into complex issues or human experiences, which may require qualitative data to fully understand.
Should I use Quantitative in my Research?
You Need to Measure and Quantify: If your research aims to quantify variables, measure frequencies, or make numerical comparisons, quantitative data is suitable.
Example: Measuring the average income level of a population.
You Aim for Objectivity: When you require objective data that can be statistically analyzed to test hypotheses and identify patterns, trends, or correlations.
Example: Analyzing the correlation between hours of study and exam scores.
You Want Generalizable Results: If you aim to generalize findings from a sample to a larger population, quantitative methods allow for this, provided you have a sufficiently large and representative sample.
Example: Conducting a survey to estimate the percentage of people who prefer online shopping over in-store shopping.
You Have Large Populations: When dealing with large populations where collecting and analyzing numerical data is more feasible and efficient.
Example: National health surveys to track prevalence of diseases.
You Need Statistical Analysis: When your research requires the application of statistical tests, quantitative data is essential.
Example: Using regression analysis to predict future sales based on past trends.
What are Some Common Quantitative Analysis Tools?
1. Microsoft Excel
- Description: Spreadsheet software for organizing and analyzing data.
- Features: Formulas, charts, pivot tables.
- Use Case: Basic to intermediate data analysis.
2. SPSS
- Description: Software for statistical analysis.
- Features: Descriptive statistics, regression analysis, ANOVA.
- Use Case: Social sciences and health research.
3. R
- Description: Programming language for statistics and graphics.
- Features: Statistical techniques, data manipulation, extensive packages.
- Use Case: Advanced statistical analysis and data science.
4. SAS
- Description: Software suite for advanced analytics.
- Features: Statistical procedures, predictive modeling, data mining.
- Use Case: Business, healthcare, government.
5. Stata
- Description: Software for data analysis and visualization.
- Features: Data management, statistical analysis, graphics.
- Use Case: Economics, sociology, epidemiology.
6. MATLAB
- Description: Language and environment for numerical computation.
- Features: Mathematical functions, algorithm development, data visualization.
- Use Case: Engineering, finance, scientific research.
7. Tableau
- Description: Data visualization software.
- Features: Interactive dashboards, real-time analysis, visual analytics.
- Use Case: Business intelligence and reporting.
8. Minitab
- Description: Statistical software for data analysis.
- Features: Descriptive statistics, hypothesis testing, control charts.
- Use Case: Manufacturing, quality improvement, Six Sigma projects.
9. Google Data Studio
- Description: Tool for creating interactive dashboards and reports.
- Features: Data integration, customizable reports, real-time updates.
- Use Case: Marketing, sales, performance tracking.
10. Python (with libraries like Pandas, NumPy, Matplotlib)
- Description: Programming language with data analysis libraries.
- Features: Data manipulation (Pandas), numerical computations (NumPy), plotting (Matplotlib).
- Use Case: Data science and machine learning.
11. IBM Watson Analytics
- Description: Cloud-based analytics service.
- Features: Automated data visualization, predictive modeling.
- Use Case: Business intelligence and data-driven decision-making.
Quantitative Data Examples for Students
Academic Performance
- Test scores (e.g., 85%, 90%)
- GPA (e.g., 3.5, 4.0)
- Number of assignments completed
- Attendance records (e.g., number of days present)
- Hours spent studying per week
Classroom Activities
- Number of books read in a semester
- Number of extracurricular activities participated in
- Number of homework problems solved
- Participation points earned in class
- Time taken to complete a test (in minutes)
Personal Life
- Age (in years)
- Height (in centimeters or inches)
- Weight (in kilograms or pounds)
- Daily screen time (in hours)
- Number of steps taken per day
Technology Usage
- Number of text messages sent per day
- Number of emails received per day
- Hours spent on social media per week
- Number of apps downloaded on a phone
- Battery life percentage at the end of the day
Health and Fitness
- Daily calorie intake
- Number of push-ups completed in one session
- Distance run in kilometers or miles
- Heart rate (beats per minute)
- Hours of sleep per night
What is quantitative data?
Quantitative data is numerical information that can be measured and analyzed statistically.
How is quantitative data collected?
It is collected through surveys, experiments, observations, existing records, and sensors.
Why use quantitative data?
It provides objective, measurable, and comparable results for statistical analysis and decision-making.
What are examples of quantitative data?
Examples include test scores, height, weight, income, and temperature.
What tools analyze quantitative data?
Common tools are Microsoft Excel, SPSS, R, SAS, and Tableau.
How is quantitative data visualized?
It is visualized using charts, graphs, histograms, and scatter plots.
What is descriptive statistics?
Descriptive statistics summarize and describe data features, such as mean and standard deviation.
What is inferential statistics?
Inferential statistics make predictions or inferences about a population based on a sample.
What is the difference between interval and ratio data?
Interval data has no true zero point, while ratio data has a true zero.
What are the advantages of quantitative data?
Advantages include objectivity, reliability, precision, and the ability to perform statistical analysis.
Share :
