31+ Quantitative Research Examples to Download

Quantitative research is a systematic method of collecting and analyzing numerical data to identify patterns, relationships, and trends. It relies on structured tools like surveys, experiments, and statistical analysis to produce objective and measurable results. Businesses, academics, and scientists use this approach to make data-driven decisions. Unlike qualitative research, which focuses on subjective insights, quantitative research provides precise, replicable findings that help validate theories and predict outcomes
What is Quantitative Research?


Quantitative Research Examples Bundle
Quantitative Research Format
Title
The research begins with a clear and concise title that reflects the study’s focus.
Abstract
A brief summary of the research, including the purpose, methods, key findings, and conclusions.
Introduction
Provides background information, research objectives, and the significance of the study.
Literature Review
Discusses previous studies related to the research topic and identifies gaps that the study aims to fill.
Methodology
Explains how data was collected, including the research design, sample size, data collection tools, and statistical analysis methods.
Results
Presents findings using tables, charts, and graphs, with a focus on numerical data and statistical significance.
Discussion
Interprets the results, compares them with previous studies, and explains their implications.
Conclusion
Summarizes key findings, highlights their importance, and suggests areas for future research.
References
Lists all sources cited in the research following a specific citation style.
Quantitative Research Example
Quantitative Research Examples
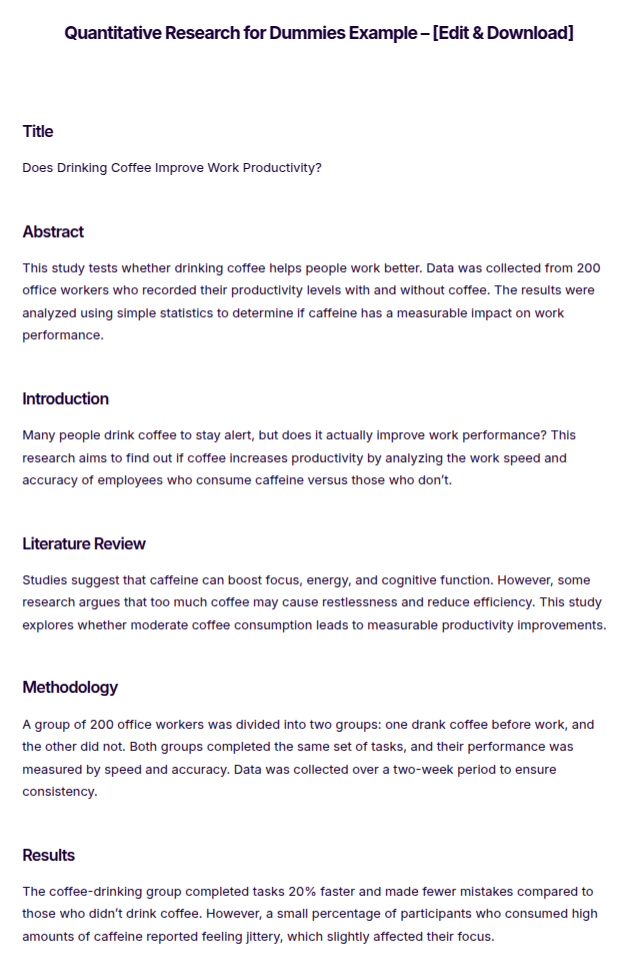
Quantitative Research for Dummies
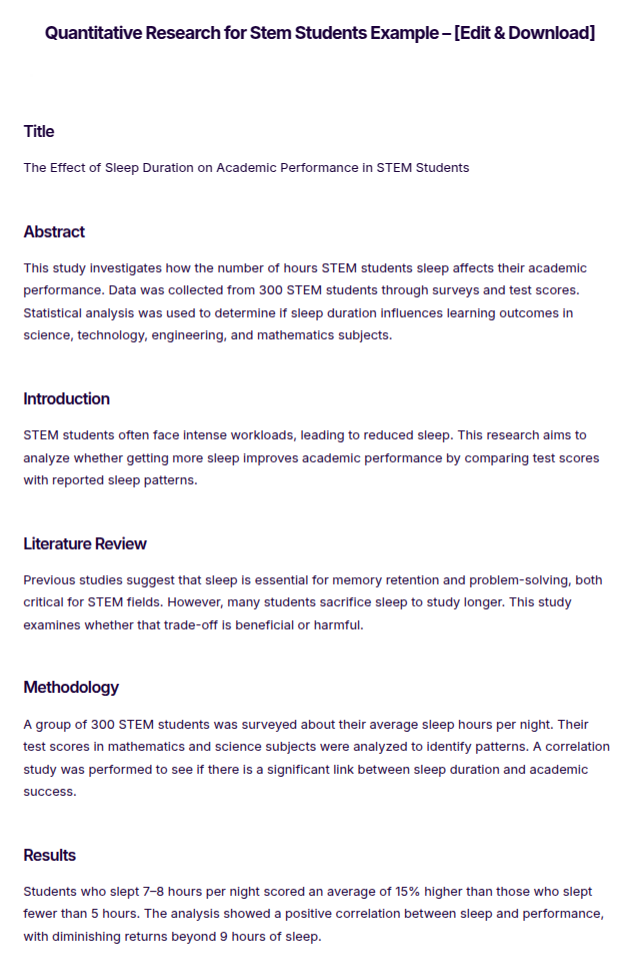
Quantitative Research for Stem Students
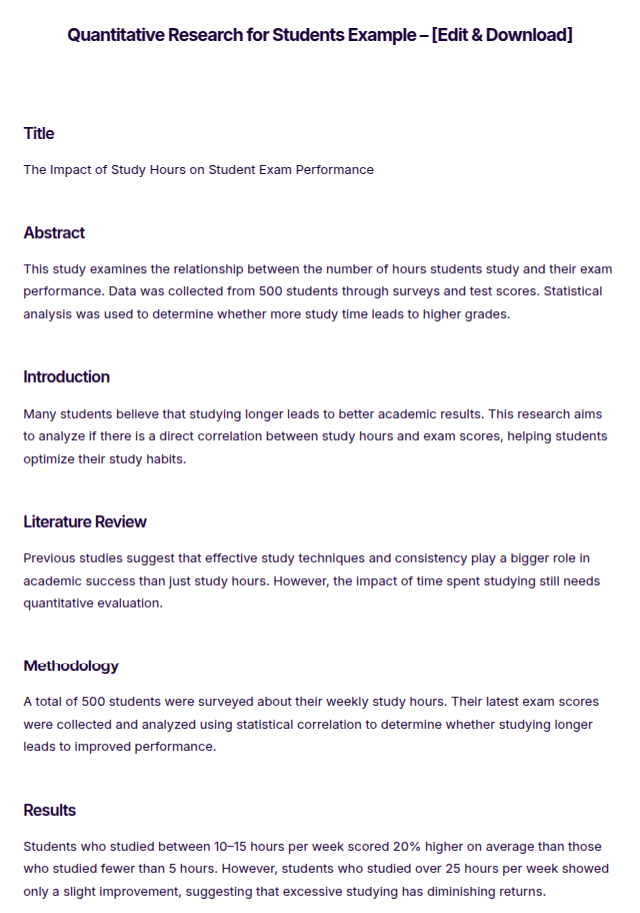
Quantitative Research for Students
More Examples on Quantitative Research
- Quantitative Research for Business
- Quantitative Research for Hums Students
- Quantitative Research for Nursing Students
- Quantitative Research for Practical Theology
- Quantitative Research for Abm Students
- Quantitative Research in School
- Quantitative Research with Hypothesis
- Statistical Treatment for Quantitative Research
- Scope and Delimitation Quantitative Research
- Statement of the Problem Quantitative Research
- Conceptual Framework in Quantitative Research
- Descriptive Quantitative Research
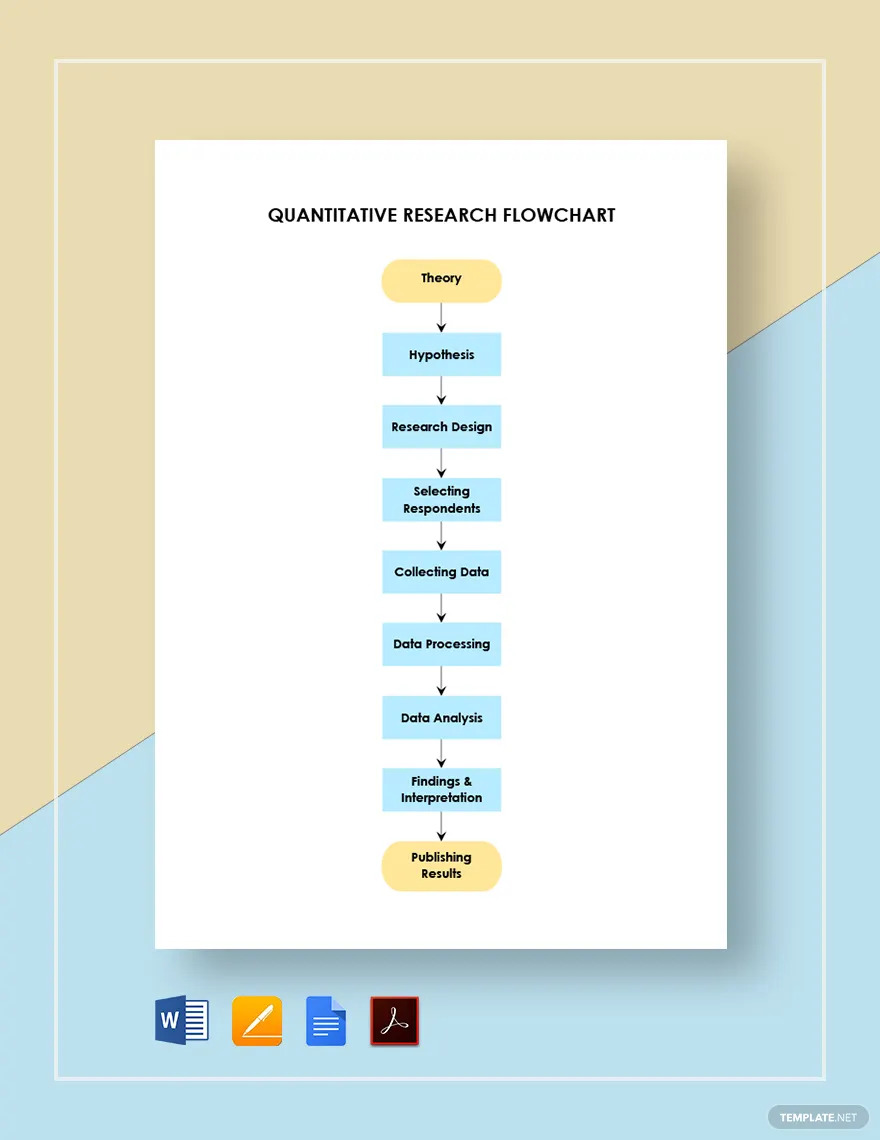
Free Quantitative Research Flowchart Example
Quantitative Research Data Analysis Template

Quantitative Research Literacy Template

Quantitative Research Template
Quantitative Research Report Template
Example of Quantitative Research

Quantitative Research Design Examples
Free Nursing Quantitative Research Proposal Example
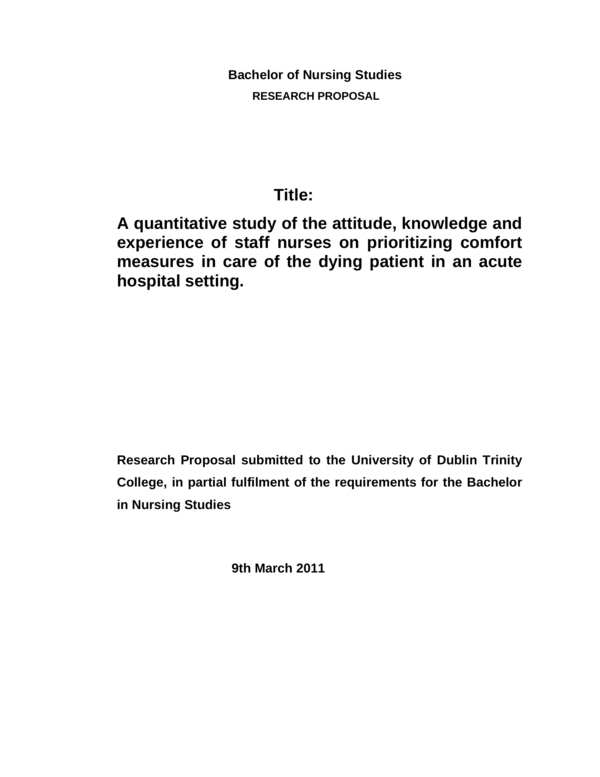
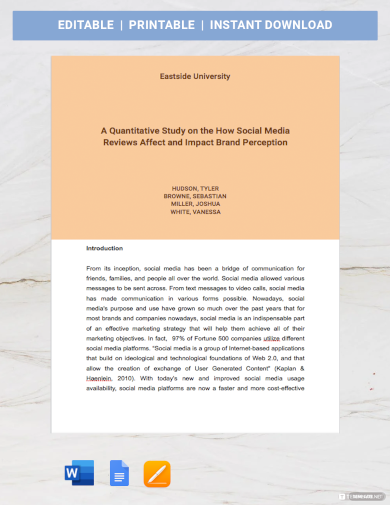
One of a nurse’s primary duties is to assure patients are taken care of and attended to. Their line of work deals with peoples’ lives and health. This also means that they still need to address patients even if they’re close to death. In Ireland, a study called “A Quantitative Study of the Attitude, Knowledge, and Experience of Staff Nurses on Prioritizing Comfort measures in Care of the Dying Patient in an Acute Hospital Setting” was conducted. If you plan on undertaking any medical SWOT analysis, using this study as a guide would be beneficial for you.
Free Effective Teacher Leadership Example
Research projects have to be conducted with precision and accuracy, especially if it’s quantitative research. You need to make sure you get the right numbers to get valid results. In research called “Effective Teacher Leadership: A Quantitative Study of the Relationship Between School Structures and Effective Teacher Leaders,” quantitative data analysis is conducted to look into the school’s management plans. For your research, this would be a useful guide in doing comprehensive qualitative research. You can outline your investigations and even term papers using this as a sample.
Free Qualitative Research Paper Example

Like any research, you must follow a particular format. A poorly organized study might give the impression of having unreliable data and results. You need to make sure your research is detailed and understandable. This applies significantly to quantitative project analysis example. This type of investigation urges researchers to be careful and efficient when gathering and analyzing information and statistics. Getting the wrong value can mess up your whole investigation. For your research, you can make use of this qualitative research paper as an outline. It details all the right parts needed in your research.
Types of Quantitative Research

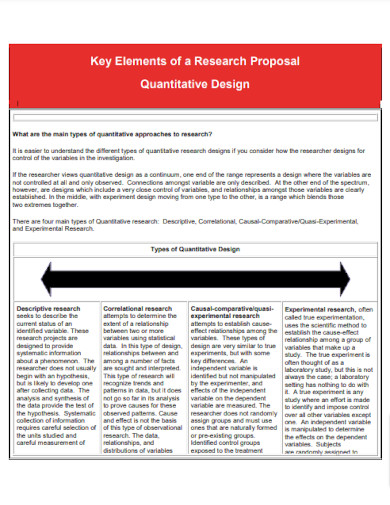
1. Descriptive Research
Descriptive research focuses on gathering numerical data to describe characteristics, behaviors, or trends in a population. It does not establish cause-and-effect relationships but provides a detailed overview of a subject. Surveys, observations, and case studies are commonly used methods.
2. Correlational Research
Correlational research examines the relationship between two or more variables without manipulating them. It identifies whether variables are positively, negatively, or not correlated. This type of research is useful in fields like psychology, business, and education.
3. Experimental Research
Experimental research involves manipulating one or more independent variables to observe their effect on a dependent variable. It uses controlled environments to establish cause-and-effect relationships. This method is commonly used in scientific and medical research.
4. Quasi-Experimental Research
Quasi-experimental research is similar to experimental research but lacks random assignment of participants. It is often used when controlled experiments are not feasible, such as in educational settings where pre-existing groups are studied.
5. Longitudinal Research
Longitudinal research studies the same subjects over a long period to observe changes and trends. It is commonly used in psychology, medicine, and social sciences to track developments and long-term effects.
6. Cross-Sectional Research
Cross-sectional research analyzes data from different groups at a single point in time. It is useful for comparing differences between populations, such as age groups or socioeconomic backgrounds, without tracking changes over time.
Quantitative Research Methods
- Survey Method – Uses questionnaires, interviews, or online forms to collect data from a large group of respondents.
- Experimental Method – Involves controlled testing to determine cause-and-effect relationships between variables.
- Correlational Method – Analyzes the relationship between two or more variables without manipulating them.
- Longitudinal Method – Observes and collects data from the same subjects over an extended period.
- Cross-Sectional Method – Gathers data at a single point in time to compare different groups or variables.
- Quasi-Experimental Method – Similar to experimental research but lacks full control over variables or randomization.
Quantitative Research vs Qualitative Research?
| Aspect | Quantitative Research | Qualitative Research |
|---|---|---|
| Research Focus | Numerical data, measurable variables, and statistics. | Non-numerical data, in-depth understanding, and context. |
| Research Purpose | To quantify, measure, and test hypotheses. | To explore, understand, and describe phenomena. |
| Data Collection Methods | Surveys, experiments, structured observations. | Interviews, focus groups, open-ended observations. |
| Sample Size | Typically larger samples for statistical analysis. | Smaller samples for in-depth exploration. |
| Data Analysis | Statistical analysis (e.g., regression, t-tests). | Thematic analysis, content analysis, coding. |
| Generalizability | Aims to generalize findings to a larger population. | Emphasizes in-depth understanding but limited generalizability. |
| Data Presentation | Numerical data presented in charts, graphs, tables. | Narrative descriptions, quotes, themes. |
| Hypothesis Testing | Focuses on testing and confirming or rejecting hypotheses. | Not necessarily hypothesis-driven; more open-ended. |
| Causality | Often used to establish causal relationships. | Doesn’t establish causation but explores relationships. |
| Researcher’s Role | Typically maintains objectivity and minimizes involvement. | Researchers are actively engaged and part of the study. |
Characteristics of Quantitative research
- Objective and Empirical: Quantitative research is based on objective and empirical observations, focusing on measurable, observable phenomena. It aims to collect data that can be analyzed statistically.
- Numerical Data: It primarily relies on numerical data, such as counts, measurements, percentages, and statistics, to draw conclusions and make comparisons.
- Structured and Controlled: Quantitative research is highly structured and controlled, with predefined methods and data collection procedures. Researchers follow standardized processes to ensure reliability and replicability.
- Large Sample Sizes: It often involves larger sample sizes to ensure statistical significance and generalizability. Sampling techniques are used to select representative samples from the population.
- Hypothesis-Driven: Quantitative research typically begins with a clear hypothesis or research question. Researchers aim to test hypotheses and draw conclusions based on data analysis.
- Quantitative Instruments: Researchers use various quantitative instruments, such as surveys, questionnaires, experiments, and structured observations, to collect data.
- Statistical Analysis: Data collected in quantitative research are subject to statistical analysis. Common statistical techniques include descriptive statistics, inferential statistics, regression analysis, and hypothesis testing.
- Objective Measurement: Measurements are typically objective and standardized to minimize bias and subjectivity. Instruments are designed to ensure consistency and reliability.
- Generalization: Quantitative research aims to generalize findings from a sample to a larger population. The results are often used to make broader conclusions and predictions.
- Numerical Results: Research findings are presented using numerical values, charts, graphs, and tables, making the results easily interpretable and comparable.
- Structured Questioning: Surveys and questionnaires used in quantitative research have structured questions with predefined response options to facilitate data collection and analysis.
- Replicability: Quantitative studies are designed to be replicable, allowing other researchers to conduct similar studies and verify or challenge the findings.
- Causality: While correlation can be established, quantitative research is suited for investigating causal relationships between variables by controlling for extraneous factors.
- Reductionist Approach: It often involves a reductionist approach, breaking down complex phenomena into measurable variables for analysis.
- Predefined Research Design: Quantitative research typically follows a predefined research design, including experimental designs, cross-sectional or longitudinal studies, and surveys.
- Validity and Reliability: Researchers pay careful attention to the validity (the accuracy of measurements) and reliability (the consistency of measurements) of data and instruments.
- Data-Based Conclusions: Conclusions in quantitative research are based on data analysis and statistical significance, emphasizing objectivity and evidence-based decision-making.
Stages of Quantitative Research
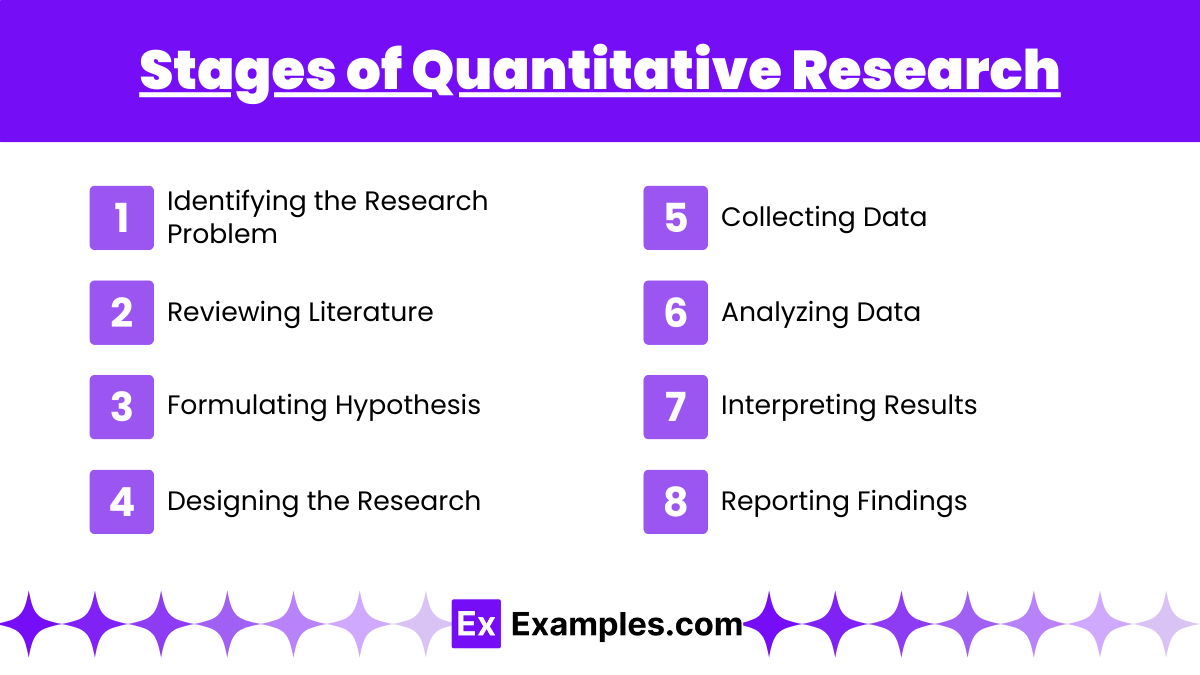
- Identifying the Research Problem – Define the issue or question that needs investigation.
- Reviewing Literature – Gather existing studies and theories related to the research topic.
- Formulating Hypothesis – Develop a clear and testable statement predicting relationships between variables.
- Designing the Research – Choose the research method, sample size, and data collection techniques.
- Collecting Data – Gather numerical data using surveys, experiments, or observations.
- Analyzing Data – Use statistical tools to interpret and evaluate the collected data.
- Interpreting Results – Draw conclusions based on statistical findings and compare them with the hypothesis.
- Reporting Findings – Present the research results in a structured format, including discussions and recommendations.
Benefits of Quantitative Research
- Objective and Reliable – Uses numerical data and statistical analysis, reducing bias.
- Replicable – Research can be repeated to verify results, ensuring consistency.
- Large Sample Size – Allows data collection from a broad population for more generalizable findings.
- Statistical Analysis – Provides measurable and precise results that help in decision-making.
- Clear Comparisons – Enables researchers to compare variables, trends, and relationships effectively.
- Predictive Insights – Helps in forecasting trends and future outcomes based on data patterns.
- Time-Efficient – Data collection and analysis can be automated, making research faster.
- Widely Accepted – Used in various fields like business, healthcare, education, and social sciences.
What are the advantages of quantitative research?
- Objectivity: Quantitative research is often highly structured and relies on empirical data, reducing the potential for bias and subjectivity. This enhances the objectivity of the research.
- Measurability: It allows for precise measurement of variables, making it easier to quantify and analyze data. This facilitates the comparison of findings across studies.
- Generalizability: Large sample sizes and statistical analysis enable researchers to generalize findings to a larger population, enhancing the external validity of the results.
- Replicability: Quantitative research is designed to be replicable, allowing other researchers to conduct similar studies and validate or challenge the findings.
- Data Analysis: Statistical analysis provides robust tools for testing hypotheses, identifying patterns, and drawing conclusions from data.
- Causality: It is well-suited for investigating causal relationships, as researchers can manipulate variables and control extraneous factors to establish cause-and-effect links.
- Efficiency: Surveys and questionnaires can collect data from a large number of participants efficiently. This is particularly useful for large-scale studies.
- Quantitative Comparison: It allows for direct comparison between groups or variables, facilitating the identification of differences and relationships.
- Data Precision: The use of standardized instruments and measurements results in precise and consistent data, reducing measurement errors.
- Data Visualization: Numerical data can be presented in charts, graphs, and tables, making it visually accessible and aiding in data interpretation.
- Decision Support: Quantitative research provides empirical evidence that can inform data-driven decision-making in various fields, including business, healthcare, and policy.
- Clear Findings: The structured nature of quantitative research often leads to clear and easily interpretable findings, which can be valuable for making informed conclusions.
- Resource Efficiency: While it may require substantial resources for data collection and analysis, quantitative research can be more cost-effective than qualitative research when dealing with large sample sizes.
FAQs
Why is quantitative research important?
Quantitative research provides objective, measurable, and replicable results, helping researchers make data-driven decisions, identify trends, and predict future outcomes in various fields like business, healthcare, and education.
Where is quantitative research commonly applied?
It is widely used in social sciences, healthcare, business, marketing, and education to measure trends, test hypotheses, and make evidence-based decisions.
How is data collected in quantitative research?
Data is collected through surveys, experiments, questionnaires, structured observations, and existing databases, ensuring numerical results that can be analyzed statistically.
What are the limitations of quantitative research?
It may lack depth in understanding emotions or motivations, rely on structured responses, and sometimes oversimplify complex human behaviors that qualitative research can explore more effectively.
Can quantitative research be combined with qualitative research?
Yes, this is called a mixed-methods approach, which combines numerical data with qualitative insights to provide a more comprehensive understanding of a research problem.
Share :
