Custom Performance Report Examples to Download

Creating a performance report should include properties and metrics. If you are going to create performance reports, you do not need to include information about the connection of the different types of resources. Oftentimes, reports invalidate incorrect information or result. Performance reports should be able to state information about the performance itself and the properties of the resources. Time interval is also essential in this aspect.
There are a lot of ways on how to specify time interval. It could be by selecting a time unit or select performance metrics. As you go along into this article, you will be able to deepen your knowledge about custom performance report.
3+ Custom Performance Report Examples
1. Custom Annual Performance Report
2. Clients Custom Performance Report
3. Custom Performance Summary Report
4. Custom Performance Status Report
What is a Custom Performance Report?
Custom performance reports are the type of report that you usually have to incorporate with dimensions such as city and browser, metrics, and the procedure on how they should be displayed. It also allows you to explore report templates yourself based on a specific criteria. It has format to follow but it depends on you on what you are going to use. Format may include the heading, columns, graphs and more. You may also consider having one or two levels of metrics. This type of report can be explored into a particular software application and then schedule for a program run.
How to Create a Custom Performance Report?
When you are going to create a custom report, this is usually what is being displayed:
Style Tab – in this part, you are going to pick your desired output style. You can pick any of the following:
- Columns – you are to place one issue per row. Issue data are the ones that should be placed in fixed columns.
- Wrapped – you can use line breaks to wrap your data into multiple rows. Styles are useful especially when it comes to printing report.
- Metrics and Graphics – you may create custom metrics and graphs. Based on what you have read earlier, one and two levels of metrics are also supported.
- Export – this means that you are to export data to a text file which can be compatible to your local desktop. when being saved.
- Metrics – the column and wrapped reports may also have metric charts and graphs.
Heading Tab – you should be able to define what items should be included in the heading. This may include the title of the report, time and date, name of the workspace, and the logo.
- Title of the report – this should be placed at the top of your report.
- Time and date – this refers to the time and date that the report has been made effective.
- Name of the workspace
- Logo – this refers to the logo used by your current workspace. See examples of logos.
Formatting tab – this includes column and wrapped reports and other metric reports.
- Column and Wrapped Reports – you are going to select only the issue information that should be displayed in your report. This is made available to all styles, but metrics are not included in it.
- Line Break
- Description – decide what type of description you are going to include in the report and the time that you are to wrap a data.
- Multi-line Field Wrapping
- Phase Voting Details
Filter Voting History – make sure that the voting history is checked and to be displayed from the drop down field.
Metrics – you should be able to create custom metrics and graphs in which this option is available for column and wrapped style and metric style.
FAQs
What is the purpose of performance reports?
Performance reports provide clear management through decoding performance levels, setting goals and finding ways to improve weakness.
Why do most employers need to measure performance?
Measuring performances can help in calibrating goals and to encourage a someone more if they are doing well.
What should performance reports depict?
Just like any other reports, they should depict a clear and concise information.
All kinds of report must show a clear and concise and exact information. It is not just about the cost, scope of work and schedule but it is also about the quality of the performance as well. Reports like this must have an appropriate content for the recommendation section and implementation of proposed action.
Share :

Custom Performance Report Examples to Download
Creating a performance report should include properties and metrics. If you are going to create performance reports, you do not need to include information about the connection of the different types of resources. Oftentimes, reports invalidate incorrect information or result. Performance reports should be able to state information about the performance itself and the properties of the resources. Time interval is also essential in this aspect.
There are a lot of ways on how to specify time interval. It could be by selecting a time unit or select performance metrics. As you go along into this article, you will be able to deepen your knowledge about custom performance report.
3+ Custom Performance Report Examples
1. Custom Annual Performance Report
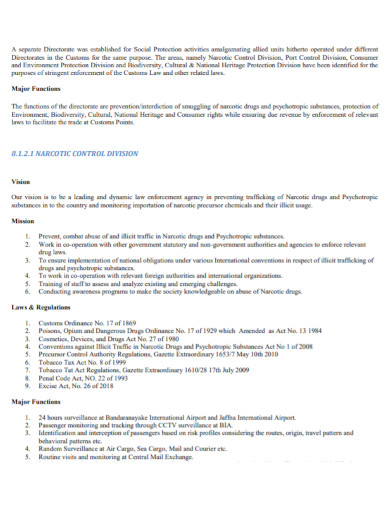
parliament.lk
Details
File Format
PDF
Size: 3 MB
2. Clients Custom Performance Report
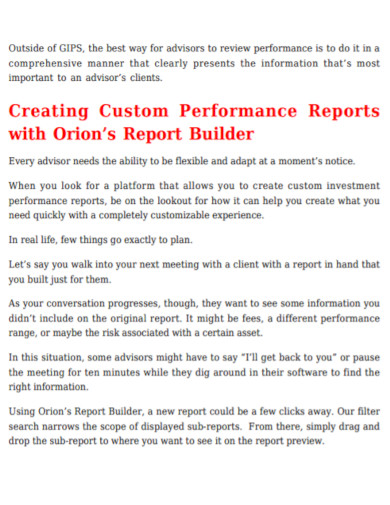
orionadvisortech.com
Details
File Format
PDF
Size: 127 KB
3. Custom Performance Summary Report
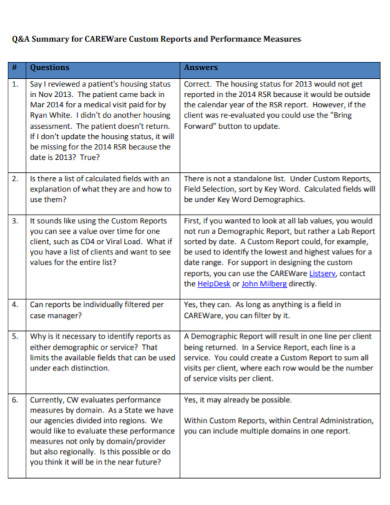
targethiv.org
Details
File Format
PDF
Size: 407 KB
4. Custom Performance Status Report
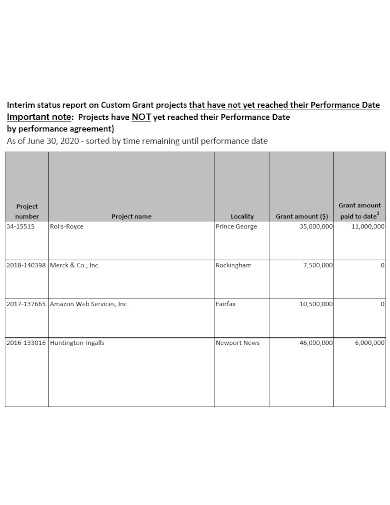
vedp.org
Details
File Format
PDF
Size: 109 KB
What is a Custom Performance Report?
Custom performance reports are the type of report that you usually have to incorporate with dimensions such as city and browser, metrics, and the procedure on how they should be displayed. It also allows you to explore report templates yourself based on a specific criteria. It has format to follow but it depends on you on what you are going to use. Format may include the heading, columns, graphs and more. You may also consider having one or two levels of metrics. This type of report can be explored into a particular software application and then schedule for a program run.
How to Create a Custom Performance Report?
When you are going to create a custom report, this is usually what is being displayed:
Style Tab – in this part, you are going to pick your desired output style. You can pick any of the following:
Columns – you are to place one issue per row. Issue data are the ones that should be placed in fixed columns.
Wrapped – you can use line breaks to wrap your data into multiple rows. Styles are useful especially when it comes to printing report.
Metrics and Graphics – you may create custom metrics and graphs. Based on what you have read earlier, one and two levels of metrics are also supported.
Export – this means that you are to export data to a text file which can be compatible to your local desktop. when being saved.
Metrics – the column and wrapped reports may also have metric charts and graphs.
Heading Tab – you should be able to define what items should be included in the heading. This may include the title of the report, time and date, name of the workspace, and the logo.
Title of the report – this should be placed at the top of your report.
Time and date – this refers to the time and date that the report has been made effective.
Name of the workspace
Logo – this refers to the logo used by your current workspace. See examples of logos.
Formatting tab – this includes column and wrapped reports and other metric reports.
Column and Wrapped Reports – you are going to select only the issue information that should be displayed in your report. This is made available to all styles, but metrics are not included in it.
Line Break
Description – decide what type of description you are going to include in the report and the time that you are to wrap a data.
Multi-line Field Wrapping
Phase Voting Details
Filter Voting History – make sure that the voting history is checked and to be displayed from the drop down field.
Metrics – you should be able to create custom metrics and graphs in which this option is available for column and wrapped style and metric style.
FAQs
What is the purpose of performance reports?
Performance reports provide clear management through decoding performance levels, setting goals and finding ways to improve weakness.
Why do most employers need to measure performance?
Measuring performances can help in calibrating goals and to encourage a someone more if they are doing well.
What should performance reports depict?
Just like any other reports, they should depict a clear and concise information.
All kinds of report must show a clear and concise and exact information. It is not just about the cost, scope of work and schedule but it is also about the quality of the performance as well. Reports like this must have an appropriate content for the recommendation section and implementation of proposed action.