Analyzing balance sheets is a fundamental aspect of financial statement analysis, offering insights into a company’s financial position at a specific point in time. The balance sheet presents a snapshot of assets, liabilities, and equity, allowing investors and analysts to assess liquidity, solvency, and financial stability. By evaluating metrics such as current and quick ratios, debt-to-equity, and asset turnover, one can gauge operational efficiency and potential financial risks. Understanding balance sheet dynamics is essential for making informed investment decisions and assessing a company’s long-term financial health.
Learning Objectives
In studying Analyzing Balance Sheets for the CFA Exam, you should learn to understand the components and structure of a balance sheet, including assets, liabilities, and equity. Analyze the methods used to assess liquidity, solvency, and financial leverage through ratios such as the current ratio, quick ratio, and debt-to-equity ratio. Evaluate the significance of asset quality, inventory management, and accounts receivable turnover in determining a company’s financial health. Additionally, explore how these metrics highlight potential financial risks or strengths, and apply your understanding to interpret balance sheet data and evaluate corporate financial stability in practice questions.
1. Purpose and Structure of the Balance Sheet
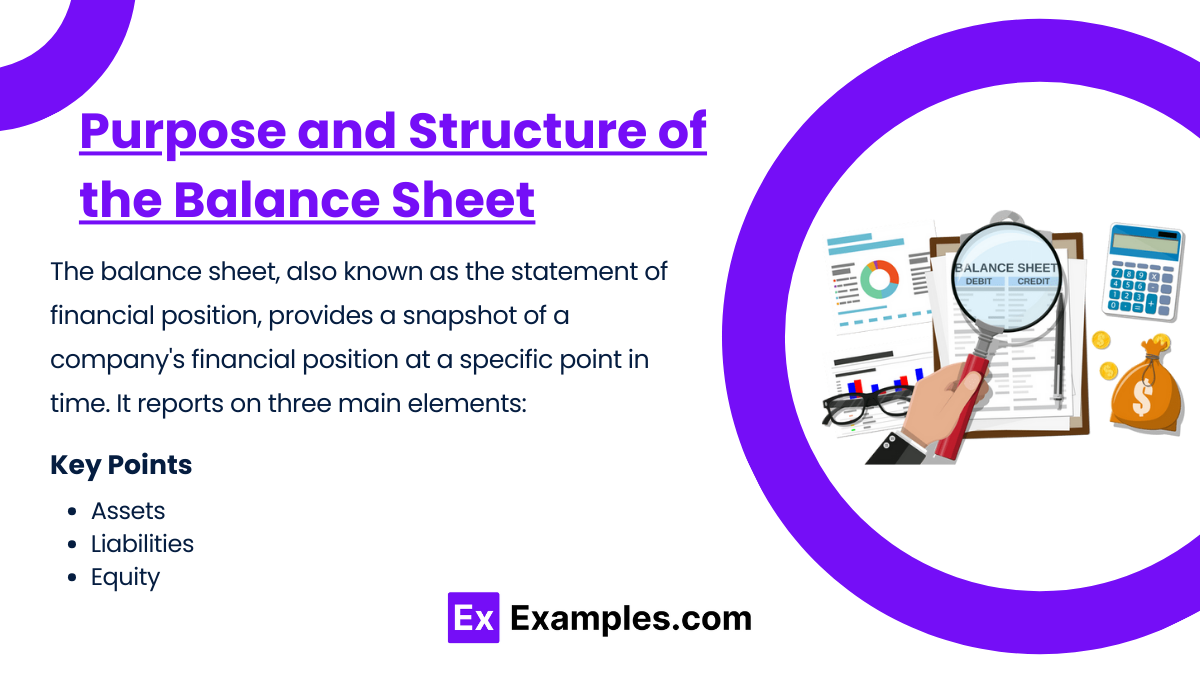
The balance sheet, also known as the statement of financial position, provides a snapshot of a company’s financial position at a specific point in time. It reports on three main elements:
- Assets: What the company owns or controls.
- Liabilities: What the company owes.
- Equity: The residual interest in the company’s assets after deducting liabilities (Assets – Liabilities = Equity).
2. Key Components of the Balance Sheet
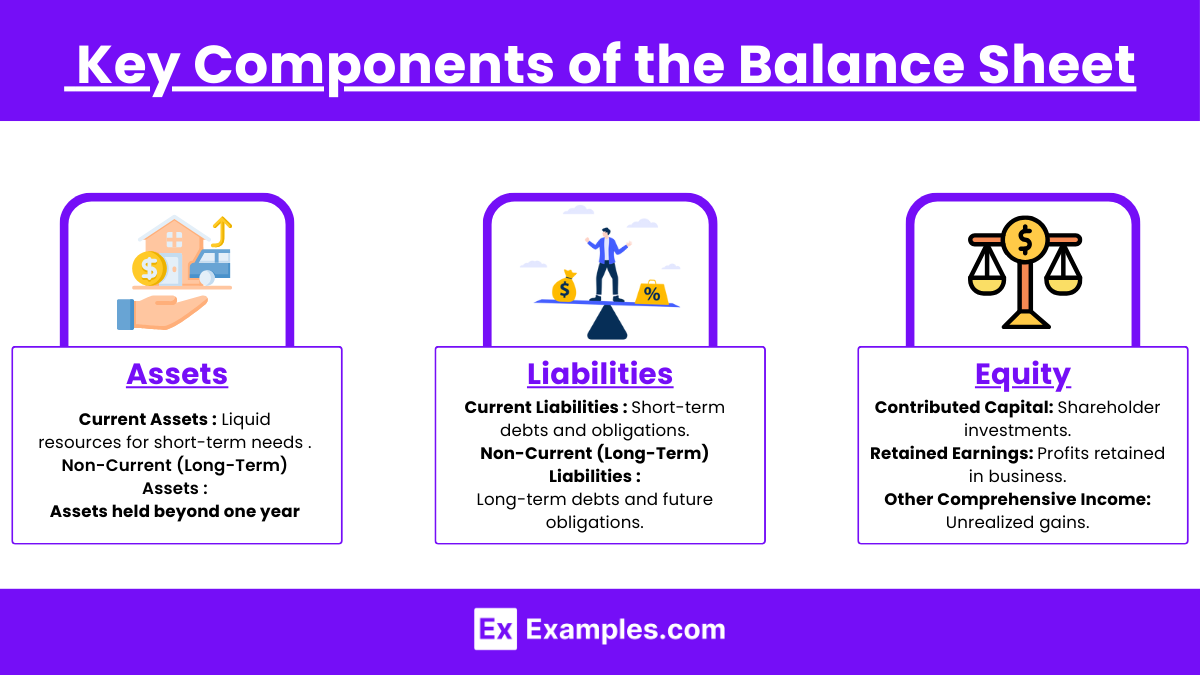
- Assets:
- Current Assets: Expected to be converted to cash or used within one year, including cash, accounts receivable, inventory, and short-term investments.
- Non-Current (Long-Term) Assets: Expected to provide value over more than one year, such as property, plant, and equipment (PP&E), intangible assets, and long-term investments.
- Liabilities:
- Current Liabilities: Obligations due within one year, such as accounts payable, accrued expenses, and short-term debt.
- Non-Current (Long-Term) Liabilities: Obligations due beyond one year, including long-term debt, deferred tax liabilities, and pension obligations.
- Equity:
- Contributed Capital: Amounts invested by shareholders.
- Retained Earnings: Cumulative net income retained in the business.
- Other Comprehensive Income: Gains and losses that haven’t been realized on the income statement, like foreign currency translation adjustments.
3. Analytical Techniques for Balance Sheet Assessment
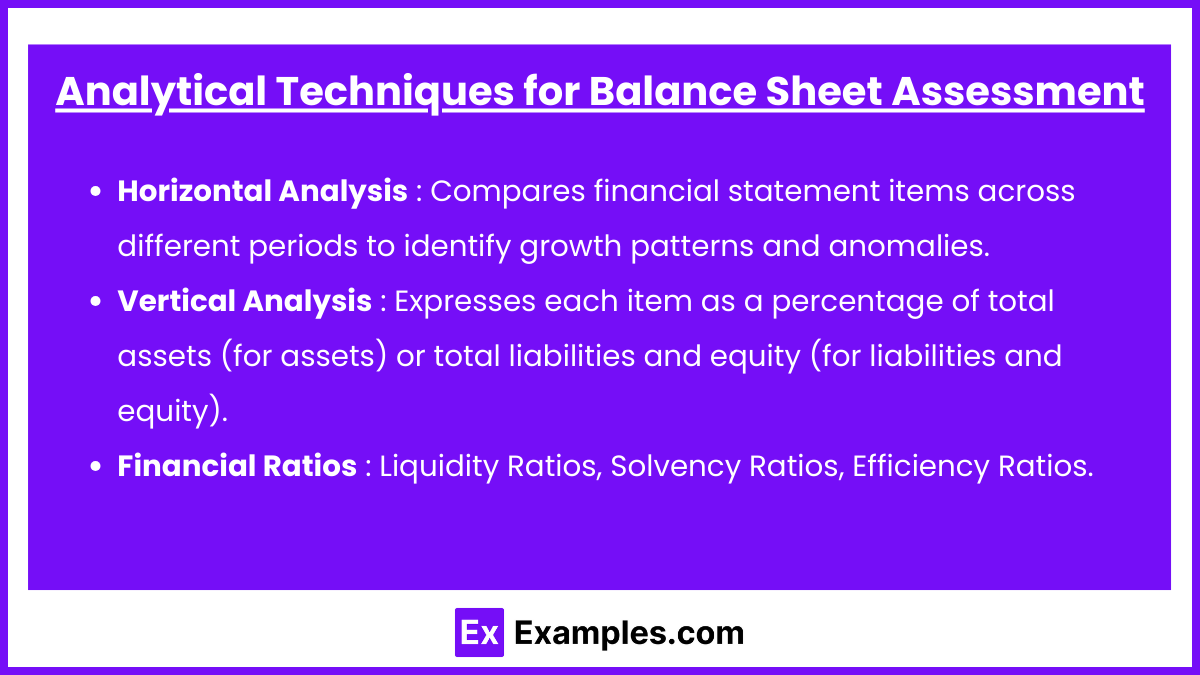
- Horizontal Analysis: Compares financial statement items across different periods to identify growth patterns and anomalies. For example, if assets or liabilities are growing faster than revenue, it may indicate potential issues in asset management or debt levels.
- Vertical Analysis: Expresses each item as a percentage of total assets (for assets) or total liabilities and equity (for liabilities and equity). This analysis helps compare companies of different sizes and see each item’s relative weight on the balance sheet.
- Financial Ratios:
- Liquidity Ratios:
- Current Ratio:
 . Assets: Measures the ability to pay short-term obligations.
 - Quick Ratio (Acid-Test Ratio) :
 . giving a more stringent liquidity measure.
 - Solvency Ratios:
- Debt to Equity Ratio:
 : Indicates the degree of financial leverage.
 - Interest Coverage Ratio:
 EBIT: Assesses the ability to meet interest payments on debt.
- Debt to Equity Ratio:
- Efficiency Ratios:
- Asset Turnover Ratio:
 : Indicates how effectively a company uses its assets to generate sales.
 - Inventory Turnover Ratio:
 : Measures how quickly inventory is sold, affecting liquidity.
- Asset Turnover Ratio:
- Current Ratio:
- Liquidity Ratios:
4. Analyzing Asset Quality and Utilization
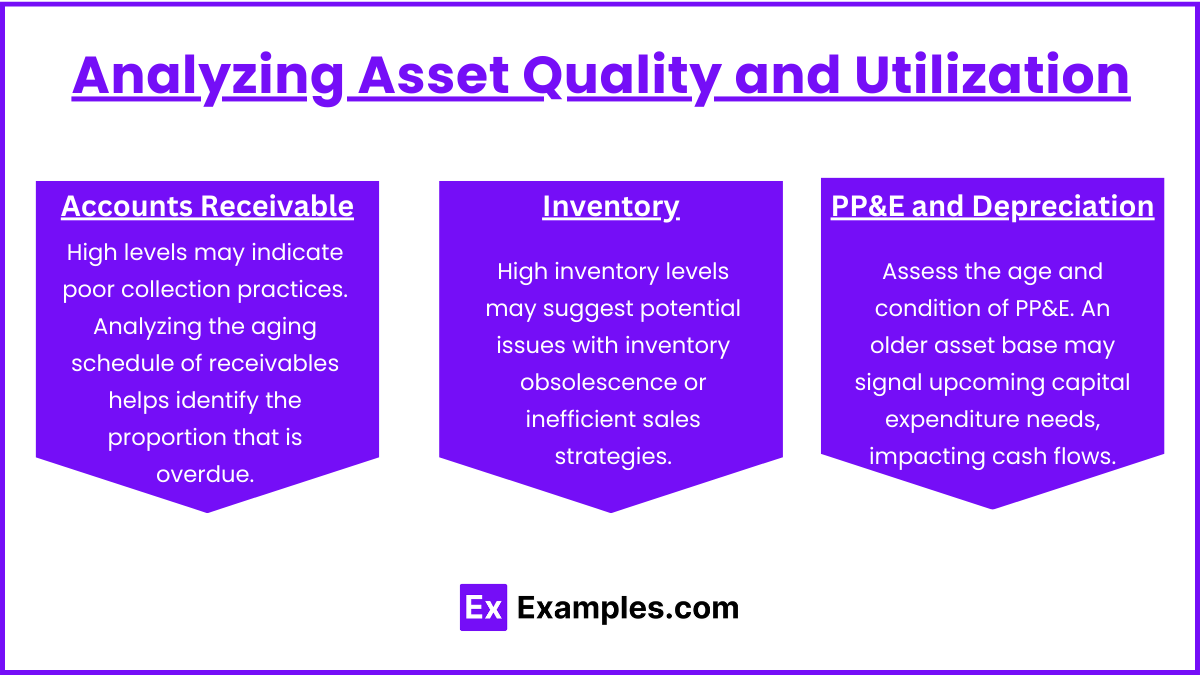
- Accounts Receivable: High levels may indicate poor collection practices. Analyzing the aging schedule of receivables helps identify the proportion that is overdue.
- Inventory: High inventory levels may suggest potential issues with inventory obsolescence or inefficient sales strategies. Monitoring inventory turnover can provide insights into inventory management.
- PP&E and Depreciation: Assess the age and condition of PP&E. An older asset base may signal upcoming capital expenditure needs, impacting cash flows.
Examples
Example 1: Assessing Liquidity through Current and Quick Ratios
When analyzing a company’s liquidity, the current ratio and quick ratio are essential indicators. For example, if Company A has current assets of 500,000 dollars and current liabilities of 250,000 dollars, its current ratio is 2.0, indicating it has twice the assets needed to cover short-term liabilities. If the company’s inventory is 100,000 dollars, the ![]() , showing the company’s ability to meet obligations without depending heavily on inventory. This analysis is crucial in assessing short-term financial stability, especially in industries with fluctuating demand cycles.
, showing the company’s ability to meet obligations without depending heavily on inventory. This analysis is crucial in assessing short-term financial stability, especially in industries with fluctuating demand cycles.
Example 2: Evaluating Leverage through Debt-to-Equity Ratio
A high debt-to-equity ratio can signal potential financial risk. Suppose Company B has total liabilities of 1 million dollar and shareholders’ equity of 500,000 dollars, resulting in a debt-to-equity ratio of 2.0. This ratio suggests that for every dollar of equity, there are two dollars of debt. Such a level of leverage may imply a significant risk if revenue declines or interest rates increase, as debt repayment obligations could strain cash flow. For conservative investors, a lower debt-to-equity ratio, perhaps below 1.0, is generally preferable, depending on industry standards.
Example 3: Analyzing Asset Utilization with Asset Turnover Ratio
Asset turnover ratio helps assess how efficiently a company uses its assets to generate revenue. If Company C has annual revenue of $3 million and average total assets of 1 dollar million, its asset turnover ratio would be 3.0, meaning it generates 3 dollars for every 1 dollar of assets. This efficiency might reflect effective management and high demand for the company’s products. However, if industry standards show an asset turnover ratio of 4.0, Company C may need to enhance operational efficiency or increase sales to match industry performance.
Example 4: Understanding Capital Structure through Shareholders’ Equity Components
Examining the components of shareholders’ equity, such as retained earnings and common stock, reveals insights into capital structure. For instance, if Company D has 200,000 dollars in contributed capital and 300,000 dollars in retained earnings, the equity structure suggests a balance between capital contributions and earnings retention. A high level of retained earnings can indicate stability and the potential for reinvestment, but may also hint at conservative dividend policies. For growth-oriented investors, a balance favoring retained earnings might imply future expansion without external financing.
Example 5: Identifying Red Flags in Accounts Receivable and Inventory Levels
An unusually high accounts receivable balance relative to revenue may suggest poor collection practices or relaxed credit policies. If Company E has accounts receivable totaling 400,000 dollars against annual revenue of 1 million dollar, this 40% ratio could indicate slower collections, which may impact cash flow. Similarly, if inventory levels are rising faster than sales, there may be an excess inventory issue, leading to potential obsolescence or discounting. These red flags can hint at underlying operational issues or demand constraints, necessitating further investigation into sales and collection processes.
Practice Questions
Question 1
A company’s current assets total 600,000 dollars and its current liabilities amount to 300,000 dollars. The company also has inventory valued at $150,000. What is the company’s quick ratio?
A) 1.0
B) 1.5
C) 2.0
D) 2.5
Answer: B) 1.5
Explanation :The quick ratio is calculated by excluding inventory from current assets to focus on the company’s most liquid assets.
The formula is:
![]()
Substituting the values given:
![]()
This quick ratio of 1.5 means that for every dollar of current liabilities, the company has $1.50 in quick assets, indicating a strong liquidity position without relying heavily on inventory.
Question 2
A company reports total liabilities of 800,000 dollars and shareholders’ equity of 400,000 dollars. What does the debt-to-equity ratio indicate about the company’s capital structure?
A) The company has a conservative capital structure with low leverage.
B) The company’s debt levels are high relative to its equity, indicating significant leverage.
C) The company has equal amounts of debt and equity, suggesting balanced leverage.
D) The company has no significant financial leverage.
Answer: B) The company’s debt levels are high relative to its equity, indicating significant leverage.
Explanation:
The debt-to-equity ratio is calculated as:
![]()
Substituting the values: ![]()
A debt-to-equity ratio of 2.0 means that for every dollar of equity, there are two dollars of debt. This ratio indicates that the company is significantly leveraged, which may pose risks, especially if interest rates increase or if the company faces a downturn in revenue. In general, high leverage can lead to greater financial risk and affects the company’s solvency profile.
Question 3
If a company’s accounts receivable turnover ratio is significantly lower than the industry average, what might this suggest?
A) The company is more efficient than its peers in collecting payments from customers.
B) The company has stricter credit policies than its peers.
C) The company may have lenient credit policies or issues with customer collections.
D) The company has higher levels of inventory compared to its peers.
Answer: C) The company may have lenient credit policies or issues with customer collections.
Explanation:
The accounts receivable turnover ratio is calculated by dividing net credit sales by the average accounts receivable. A low accounts receivable turnover ratio compared to the industry average suggests that the company is slower at collecting payments from customers. This could be due to:
- Lenient Credit Policies: The company may extend generous credit terms, allowing customers more time to pay, which could delay cash inflows.
- Collection Issues: The company might have difficulty collecting receivables from customers, which could lead to an increased risk of bad debt.
Both factors may negatively impact cash flow and liquidity, and potential investors would need to examine the company’s credit and collection policies closely.

