Analyzing income statements is a fundamental aspect of financial statement analysis, providing insights into a company’s profitability, revenue generation, and expense management. The income statement, also known as the profit and loss statement, details revenues, costs of goods sold, operating expenses, and net income over a specific period. By examining trends in these areas, analysts can assess a company’s financial health, efficiency, and growth potential. Understanding how each component impacts overall profitability is essential for investors, creditors, and stakeholders when making informed financial and investment decisions.
Learning Objectives
In studying ” Analyzing Income Statements ” for the CFA Exam, you should learn to understand the core components of an income statement, including revenue, cost of goods sold (COGS), operating expenses, and net income. Analyze how these elements reflect a company’s profitability, efficiency, and growth potential. Evaluate the principles behind ratios such as gross profit margin, operating margin, and net profit margin, which help assess financial performance. Additionally, explore how vertical and horizontal analyses provide insights into trends and expense structures, and apply your understanding to interpret income statement data in CFA-style scenarios and practice questions.
The income statement, also known as the profit and loss statement, provides a summary of a company’s revenues, expenses, and profits over a specific period. Analyzing income statements helps assess a company’s profitability, efficiency, and overall financial performance. This analysis is vital for investors, creditors, and other stakeholders in understanding whether a company can sustain its growth, meet its debt obligations, and generate shareholder value.
Key Components of the Income Statement
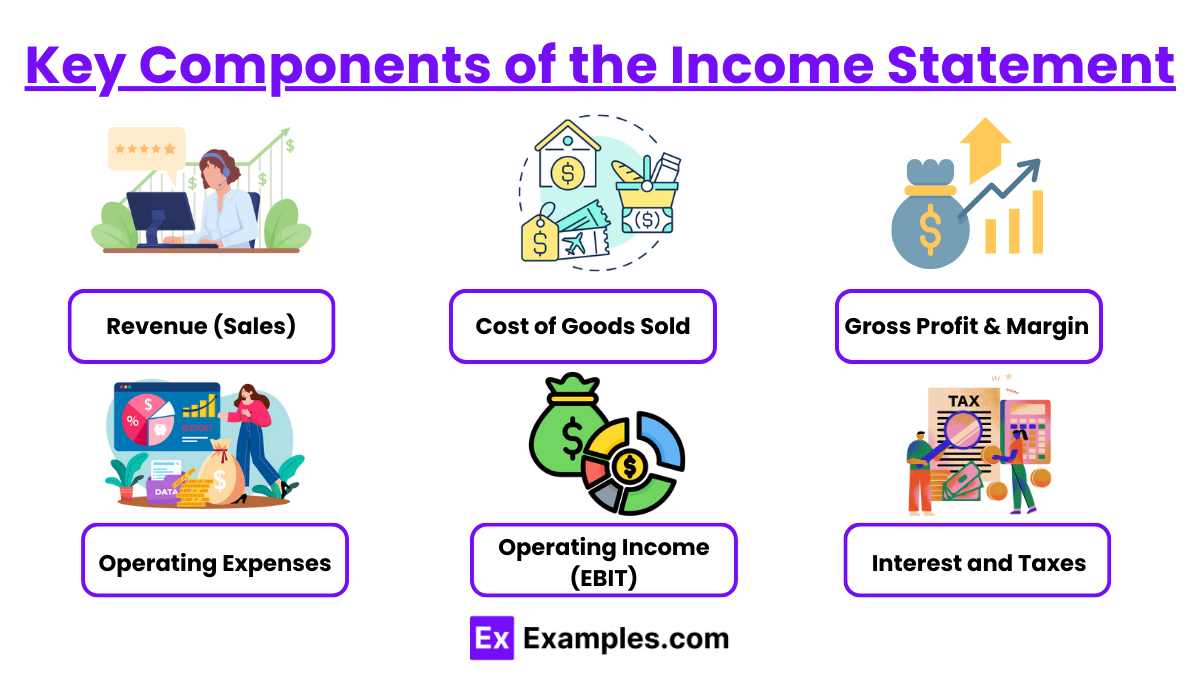
- Revenue (Sales): Revenue represents the total amount earned from goods sold or services rendered. Analyzing revenue trends helps determine the company’s growth rate and demand for its offerings. Revenues can be classified as operating (core business) or non-operating (secondary activities).
- Cost of Goods Sold (COGS): COGS includes direct costs related to the production of goods or services. It is subtracted from revenue to calculate gross profit. A lower COGS relative to revenue indicates efficient production processes or favorable input costs.
- Gross Profit and Gross Margin: Gross profit is the difference between revenue and COGS, reflecting the profitability from core operations. Gross margin (Gross Profit ÷ Revenue) shows what percentage of revenue remains after covering production costs and is a key indicator of operational efficiency.
- Operating Expenses: These include selling, general, and administrative (SG&A) expenses, research and development (R&D) costs, and other expenses not directly tied to production. Operating expenses affect the company’s operating income and overall profitability. Analyzing trends in operating expenses can reveal potential cost management issues.
- Operating Income (EBIT): Also known as earnings before interest and taxes, operating income represents profit from core business activities after deducting operating expenses. EBIT is crucial for understanding the company’s ability to generate profit from operations, excluding financing and tax impacts.
- Interest and Taxes: Interest expenses arise from debt financing, while tax expenses are based on pre-tax income. These costs are deducted from EBIT to arrive at net income.
Types of Income Statement Analysis
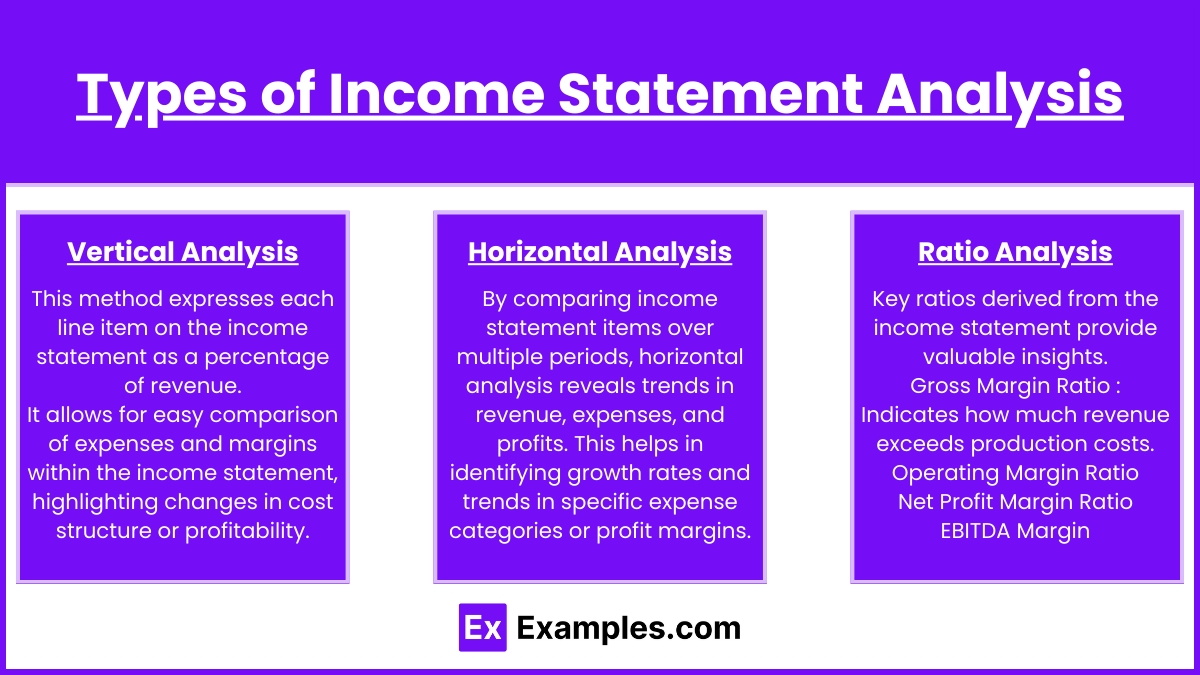
- Vertical Analysis: This method expresses each line item on the income statement as a percentage of revenue. It allows for easy comparison of expenses and margins within the income statement, highlighting changes in cost structure or profitability.
- Horizontal Analysis: By comparing income statement items over multiple periods, horizontal analysis reveals trends in revenue, expenses, and profits. This helps in identifying growth rates and trends in specific expense categories or profit margins.
- Ratio Analysis: Key ratios derived from the income statement provide valuable insights:
- Gross Margin Ratio: Indicates how much revenue exceeds production costs.
- Operating Margin Ratio: Shows the proportion of revenue left after covering operating expenses.
- Net Profit Margin Ratio: Assesses the bottom-line profitability.
- EBITDA Margin: EBITDA (earnings before interest, taxes, depreciation, and amortization) as a percentage of revenue helps measure core operational profitability without non-operational factors.
Importance of Analyzing Income Statements
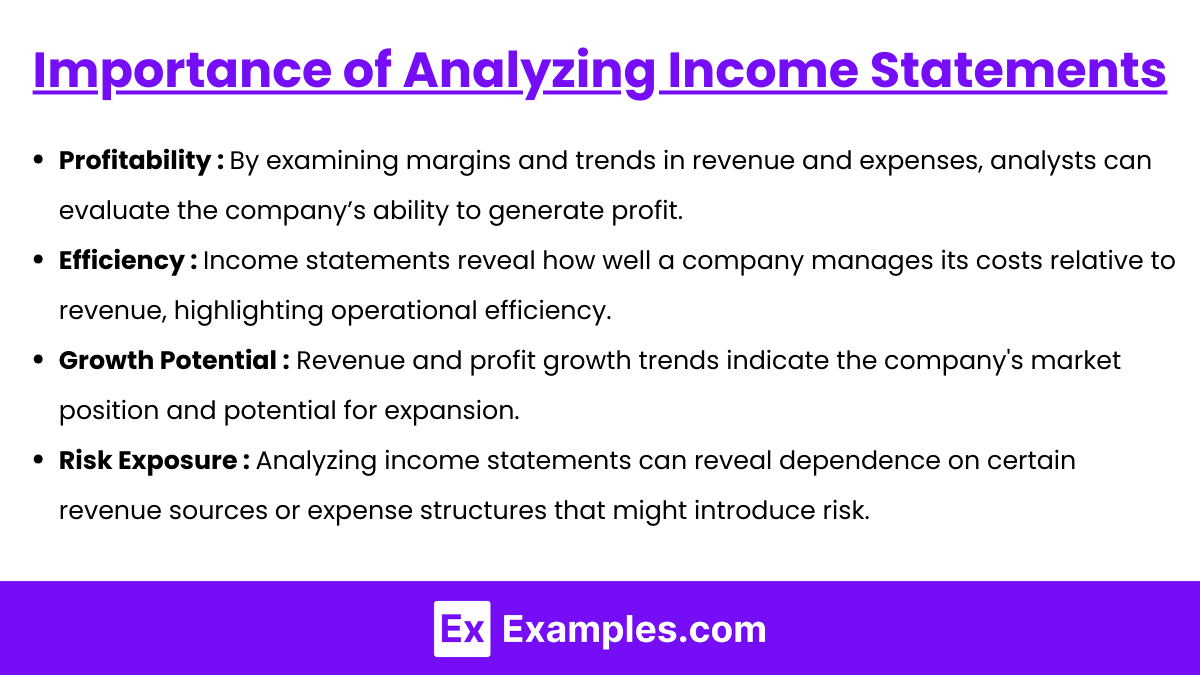
Income statement analysis helps stakeholders understand:
- Profitability: By examining margins and trends in revenue and expenses, analysts can evaluate the company’s ability to generate profit.
- Efficiency: Income statements reveal how well a company manages its costs relative to revenue, highlighting operational efficiency.
- Growth Potential: Revenue and profit growth trends indicate the company’s market position and potential for expansion.
- Risk Exposure: Analyzing income statements can reveal dependence on certain revenue sources or expense structures that might introduce risk.
Limitations of Income Statement Analysis
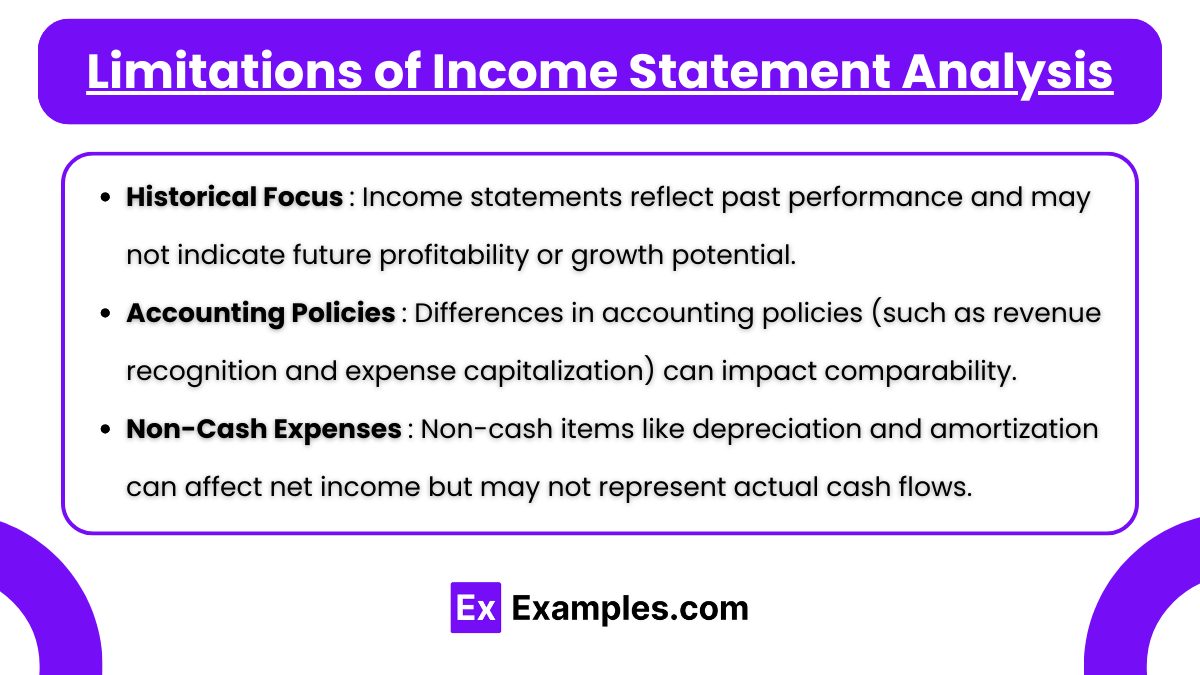
While analyzing income statements is essential, it has some limitations:
- Historical Focus: Income statements reflect past performance and may not indicate future profitability or growth potential.
- Accounting Policies: Differences in accounting policies (such as revenue recognition and expense capitalization) can impact comparability.
- Non-Cash Expenses: Non-cash items like depreciation and amortization can affect net income but may not represent actual cash flows.
Examples
Example 1: Evaluating Profit Margins
An analyst examines a company’s income statement to calculate its gross profit margin and net profit margin over the last three years. The analyst finds that while the gross profit margin has remained stable, the net profit margin has declined. This suggests that while production costs are stable, there may be an increase in operating expenses, interest, or tax burdens. The analyst investigates further to identify areas of cost control, particularly within selling, general, and administrative (SG&A) expenses, to understand what is driving the reduction in net income.
Example 2: Analyzing Revenue Growth
In analyzing the income statements of a retail company, an analyst notices steady annual growth in revenue over the past five years. By performing a horizontal analysis, the analyst calculates year-over-year revenue growth rates, observing a consistent upward trend. However, the analyst also finds that the cost of goods sold (COGS) has been growing at a slightly faster rate than revenue. This trend raises a concern that rising production or supply costs may be compressing profit margins, prompting the analyst to recommend strategies for optimizing inventory or renegotiating supplier contracts.
Example 3: Assessing Operating Efficiency with EBIT
A manufacturing company’s EBIT (Earnings Before Interest and Taxes) has declined despite an increase in revenue. By analyzing the income statement, the analyst observes that operating expenses, particularly in R&D and administrative costs, have risen sharply. This increase in expenses suggests potential inefficiencies in operations or a shift in strategy that may impact profitability. The analyst uses operating margin (EBIT ÷ Revenue) as a key metric to evaluate the impact of these rising expenses on profitability, ultimately recommending a review of discretionary spending to improve operating efficiency.
Example 4: Identifying Trends in Expense Structure
Using vertical analysis, an analyst evaluates the income statement of a technology firm to understand how each line item contributes to total revenue. The analysis reveals that while revenue has increased, marketing expenses as a percentage of revenue have grown disproportionately. This shift in expense structure could indicate that the company is investing heavily in customer acquisition. The analyst assesses whether this investment aligns with increased market share or improved revenue growth, providing insights into the company’s strategic choices and potential for long-term profitability.
Example 5: Analyzing Non-Operating Income and Expenses
An analyst examines the income statement of a diversified company with substantial investments in other businesses. The income statement shows significant non-operating income from these investments, which has bolstered overall net income. However, the analyst also finds that interest expenses from increased debt financing have grown. By examining the ratio of non-operating income to total income, the analyst determines the degree to which the company relies on non-core business activities for profitability. This analysis helps in assessing the sustainability of earnings and understanding risks associated with debt-financed expansion.
Practice Questions
Question 1
If a company’s gross profit margin has remained steady while its net profit margin has been declining, what is the most likely cause?
A) An increase in cost of goods sold
B) A decrease in revenue
C) An increase in operating expenses
D) A reduction in gross profit
Answer: C) An increase in operating expenses.
Explanation: The gross profit margin is calculated as (Revenue – Cost of Goods Sold) ÷ Revenue and measures profitability after accounting for production costs. A steady gross profit margin indicates that the cost of goods sold relative to revenue has not significantly changed. However, a declining net profit margin (Net Income ÷ Revenue) suggests that after deducting additional expenses (like operating expenses, interest, or taxes), profitability has decreased. The most likely cause here is an increase in operating expenses, which affects net profit without impacting gross profit. Therefore, option C is correct.
Question 2
Which of the following would be the best indicator that a company is generating profit from its core operations?
A) Net Income
B) Gross Profit
C) Operating Income (EBIT)
D) Earnings Per Share (EPS)
Answer: C) Operating Income (EBIT).
Explanation: Operating Income (EBIT), also known as earnings before interest and taxes, is calculated as revenue minus cost of goods sold and operating expenses. It reflects the profit generated from the company’s core business operations, excluding the effects of financing (interest) and taxes. Gross profit reflects profitability only after production costs, net income includes all expenses, and EPS is net income per share. Thus, EBIT is the most direct measure of core operational profitability, making option C the correct answer.
Question 3
An analyst notices a sharp increase in a company’s non-operating income on the income statement. What should the analyst consider when interpreting this increase?
A) The company has improved its core business operations.
B) The increase may not be sustainable in the long term.
C) The company’s operating expenses have decreased significantly.
D) The increase is likely due to a reduction in tax expenses.
Answer: B) The increase may not be sustainable in the long term.
Explanation: Non-operating income typically includes earnings from sources outside the company’s core business operations, such as investment gains, interest income, or one-time events like asset sales. While this income can positively impact net profit, it may not be a reliable or recurring source of revenue. Therefore, the analyst should consider that such income may not be sustainable over the long term, as it does not directly relate to the company’s operational performance. This makes option B the correct answer.

