Big Data Projects

- Notes
For CFA Level 2 candidates, understanding how to manage and analyze big data is crucial as the financial industry increasingly relies on large volumes of information to make informed decisions. Big data projects involve complex processes that encompass data collection, management, analysis, and interpretation, essential skills in the Quantitative Methods section of the exam.
Learning Objectives
In studying “Big Data Projects” for the CFA exam, you should aim to understand the comprehensive scope of big data initiatives, including the tools and techniques used to handle and analyze vast datasets. You will learn to appreciate the power of big data in extracting actionable insights that can lead to better decision-making in finance. Additionally, the course will cover the ethical considerations and best practices in managing data privacy and security, ensuring candidates are prepared to undertake big data projects responsibly.
1. Scope and Scale of Big Data
- Definition and Importance: Understanding what constitutes big data—volume, velocity, and variety—and its significance in financial analysis.
- Data Sources: Identifying and aggregating diverse data sources including transaction records, social media feeds, and economic indicators.
2. Data Management
- Storage Solutions: Exploring options for data storage such as data lakes, warehouses, and cloud-based solutions.
- Data Cleaning: Techniques for ensuring data quality and integrity by removing inaccuracies and processing anomalies.
3. Data Analysis and Tools
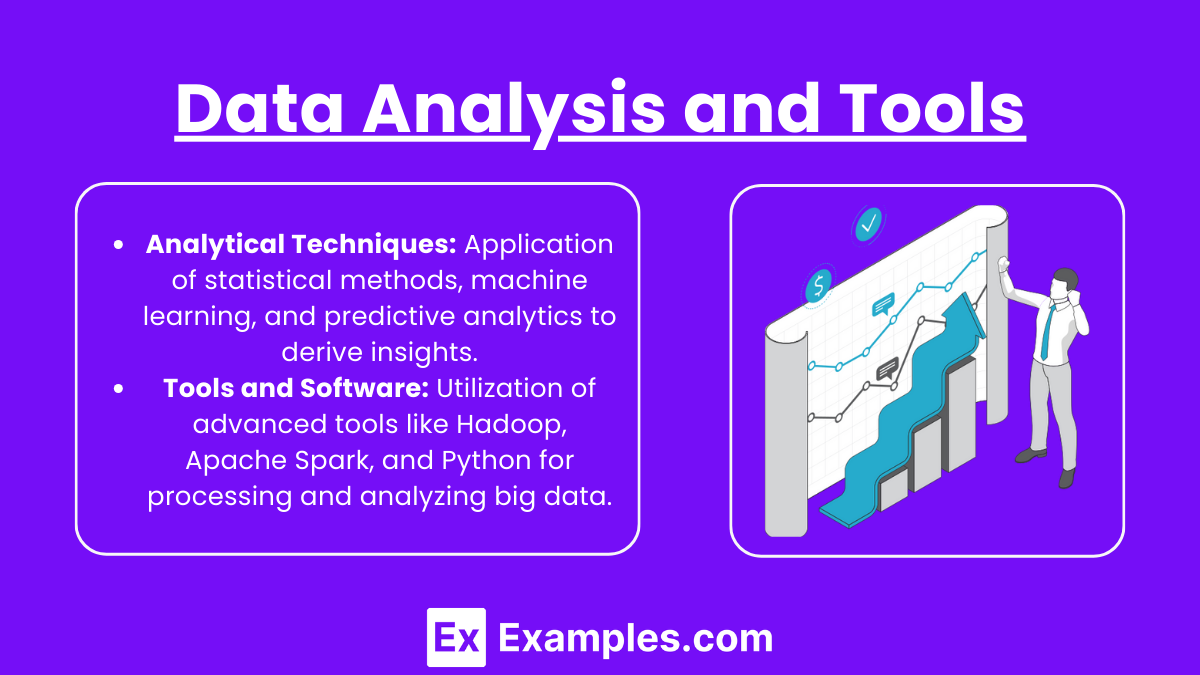
- Analytical Techniques: Application of statistical methods, machine learning, and predictive analytics to derive insights.
- Tools and Software: Utilization of advanced tools like Hadoop, Apache Spark, and Python for processing and analyzing big data.
4. Visualization and Interpretation
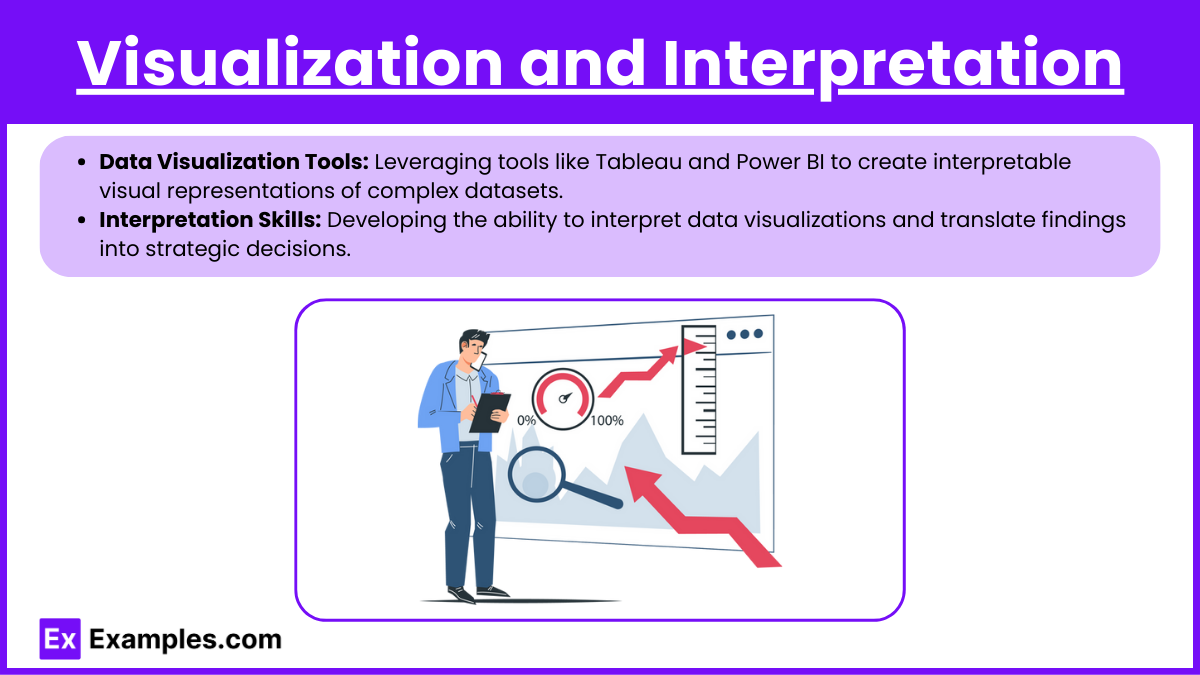
- Data Visualization Tools: Leveraging tools like Tableau and Power BI to create interpretable visual representations of complex datasets.
- Interpretation Skills: Developing the ability to interpret data visualizations and translate findings into strategic decisions.
5. Ethical and Regulatory Considerations
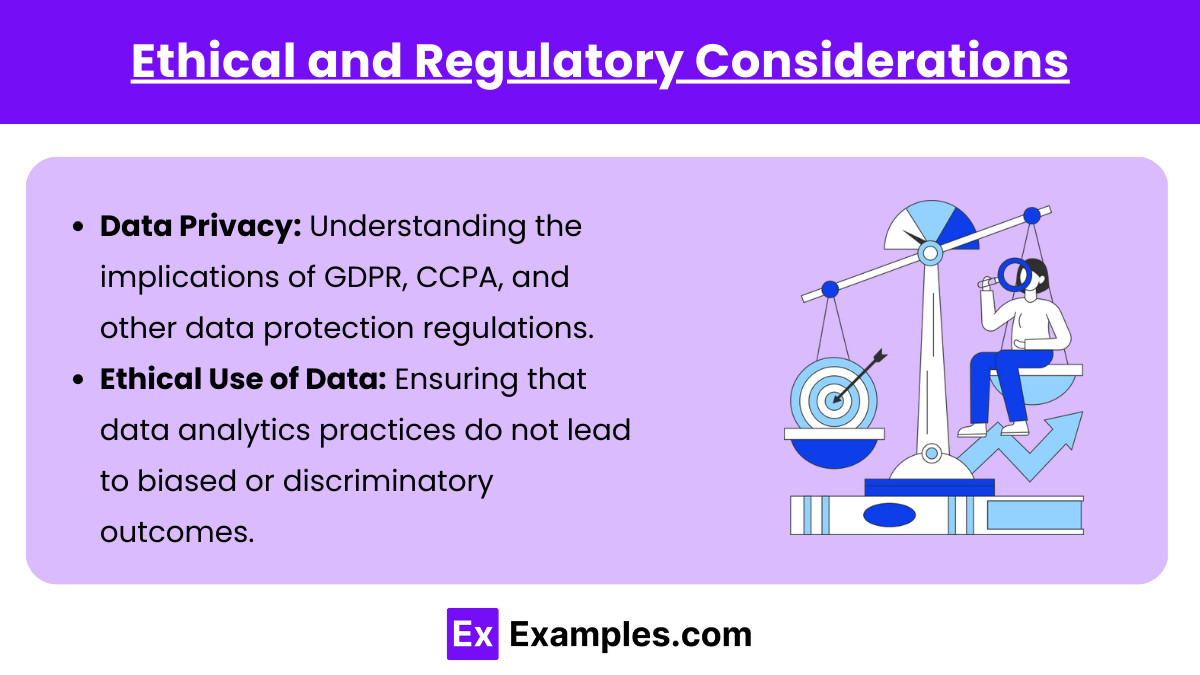
- Data Privacy: Understanding the implications of GDPR, CCPA, and other data protection regulations.
- Ethical Use of Data: Ensuring that data analytics practices do not lead to biased or discriminatory outcomes.
Examples
Example 1: Market Sentiment Analysis
- Analysts use natural language processing (NLP) techniques on social media data to gauge public sentiment and predict market movements.
Example 2: Transaction Pattern Analysis
- Utilizing big data tools to analyze transaction patterns that help in detecting fraudulent activities and assessing risk.
Example 3: Customer Segmentation
- Financial institutions analyze large datasets to segment customers based on behavior, preferences, and financial history to tailor marketing strategies.
Example 4: Algorithmic Trading
- Traders implement complex algorithms that process high-frequency trading data to make automated trading decisions based on market conditions.
Example 5: Risk Management
- Risk managers integrate big data analytics to monitor and predict various financial risks, enhancing the effectiveness of risk mitigation strategies.
Practice Questions
Question 1:
What is a primary challenge in managing big data projects in finance?
A) Data storage
B) Low data variety
C) Simple data analysis
D) Lack of data sources
Answer: A) Data storage
Explanation: One of the primary challenges in managing big data projects is effectively storing vast amounts of data, which requires robust and scalable storage solutions to ensure data is accessible and secure.
Question 2:
Which tool is commonly used for big data processing in financial analytics?
A) Microsoft Excel
B) Apache Hadoop
C) Adobe Photoshop
D) Microsoft Word
Answer: B) Apache Hadoop
Explanation: Apache Hadoop is widely used for processing large datasets in big data projects due to its powerful data handling capabilities, making it suitable for financial analytics that requires processing voluminous data.
Question 3:
What does the visualization step in a big data project primarily help with?
A) Reducing data volume
B) Increasing data complexity
C) Simplifying the interpretation of complex data
D) Decreasing data variety
Answer: C) Simplifying the interpretation of complex data
Explanation: The visualization step in a big data project helps simplify the interpretation of complex data by translating intricate datasets into graphical representations that are easier to understand and analyze.

