Discounted Dividend Valuation (DDM) is a key approach in equity valuation, primarily used to determine the intrinsic value of dividend-paying stocks. This model calculates a stock’s value based on the present value of anticipated future dividends, aligning with the belief that dividends represent a core return for investors. DDM is particularly effective for valuing stable, mature companies with predictable dividend growth. By estimating future cash flows and discounting them to today’s value, analysts use DDM to assess whether a stock is fairly priced, overvalued, or undervalued.
Learning Objectives
In studying “Discounted Dividend Valuation” for the CFA Exam, you should learn to analyze the principles and application of the discounted dividend model (DDM) for valuing equity. Understand various models, including the Gordon Growth Model, two-stage, and H-model, and evaluate how each estimates the intrinsic value of dividend-paying stocks. Assess key inputs like dividend growth rates, required rates of return, and the stability of dividends. Explore scenarios where DDM is most appropriate, including mature companies with stable dividends, and apply your knowledge to CFA exam-style questions that require selecting or calculating the most accurate valuation approach.
1. Introduction to Discounted Dividend Valuation
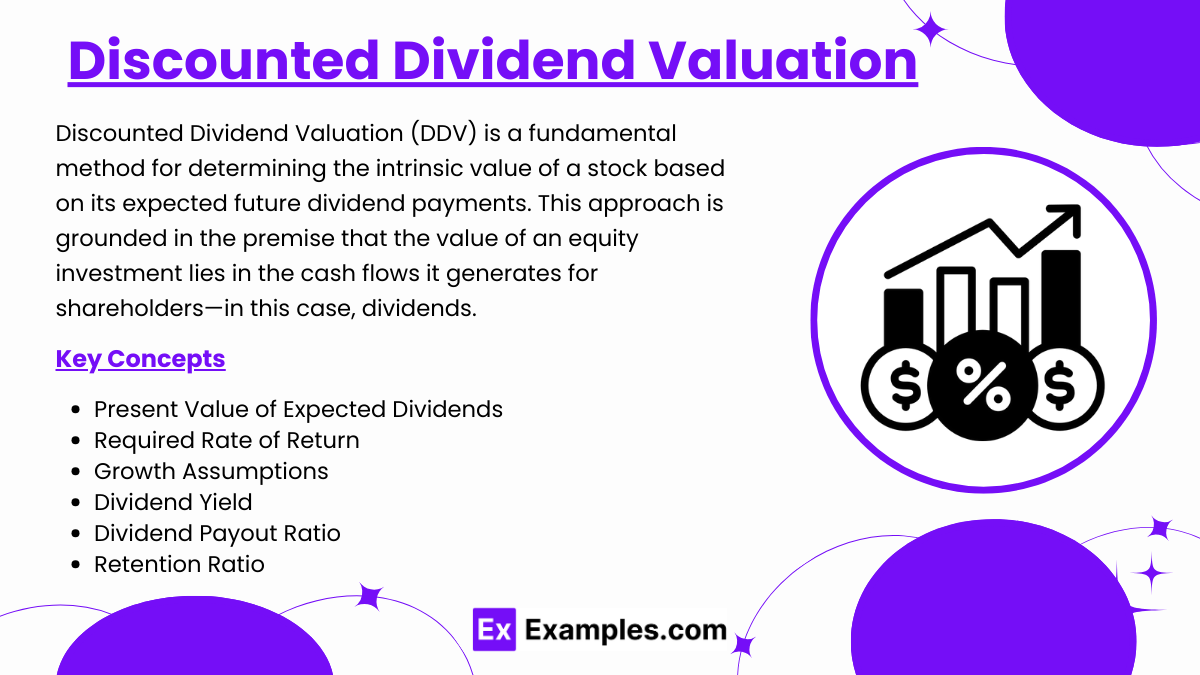
Discounted Dividend Valuation (DDV) is a fundamental method for determining the intrinsic value of a stock based on its expected future dividend payments. This approach is grounded in the premise that the value of an equity investment lies in the cash flows it generates for shareholders—in this case, dividends. By forecasting future dividends and discounting them back to their present value, the DDV model provides a measure of what the stock is worth today, based on its ability to pay dividends in the future.
Key Concepts in Discounted Dividend Valuation
- Present Value of Expected Dividends: DDV focuses on estimating the present value of future dividends, which are treated as the primary source of returns for shareholders. Dividends are projected over a certain period and then discounted at a rate that reflects the required rate of return, capturing both the time value of money and the risk associated with the investment.
- Required Rate of Return: In DDV, the discount rate used is the investor’s required rate of return, often calculated based on the Capital Asset Pricing Model (CAPM) or an equivalent measure of expected return. This rate reflects the risk profile of the stock and the return investors demand for holding it.
- Growth Assumptions: One of the critical inputs in DDV is the expected growth rate of dividends. Different types of DDV models handle growth assumptions differently:
- Gordon Growth Model (Constant Growth Model): Assumes dividends will grow at a constant rate indefinitely, suitable for mature companies with stable growth prospects.
- Multi-Stage Dividend Discount Model: Allows for different growth rates in different stages, typically involving an initial high-growth phase followed by a stable growth phase. This model is useful for companies transitioning from a high-growth period to more predictable, long-term growth.
- Dividend Yield: The annual dividend per share divided by the stock price, representing the income return component.
- Dividend Payout Ratio: The portion of earnings paid out as dividends, indicating the company’s dividend policy and sustainability.
- Retention Ratio: The percentage of earnings retained by the company for reinvestment, impacting future dividend growth.
2. Types of Dividend Discount Models (DDM)
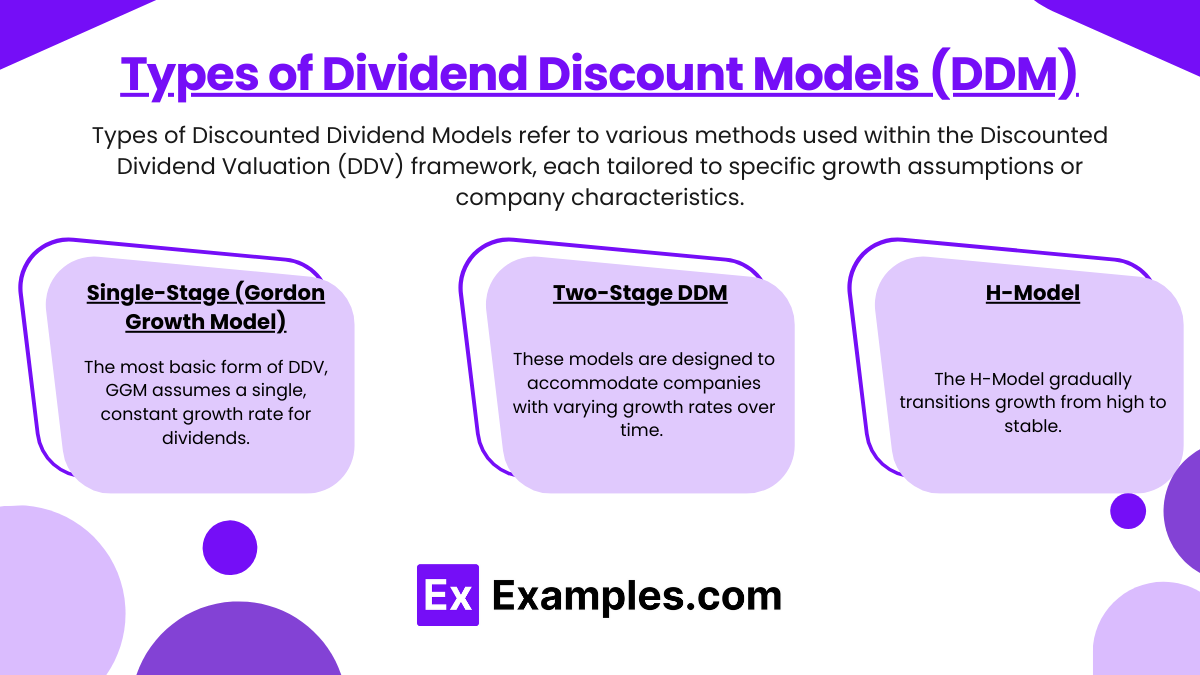
Types of Discounted Dividend Models refer to various methods used within the Discounted Dividend Valuation (DDV) framework, each tailored to specific growth assumptions or company characteristics. Here are the primary types:
- Single-Stage (Gordon Growth Model): The most basic form of DDV, GGM assumes a single, constant growth rate for dividends. It is ideal for valuing companies with stable, predictable dividend growth, often used for mature firms with established dividend policies.
- Formula:

- Where:
- P0 = Present value of the stock
- D1 = Dividend expected in the next period
- r = Required rate of return on equity
- g = Growth rate of dividends
- This model assumes dividends grow at a constant rate indefinitely. It is ideal for companies with a stable growth rate, typically mature firms.
- Dividends are assumed to grow at a high rate for an initial period before stabilizing at a lower, constant rate.
- Useful for firms with an initial high-growth period, followed by long-term stable growth.
- Formula (for two stages) involves calculating the present value of dividends in the high-growth phase and the terminal value (Gordon Growth Model) for the stable phase.
- Formula:
- Two-Stage DDM: These models are designed to accommodate companies with varying growth rates over time. They begin with an initial phase of high growth and then transition to a stable growth rate. This approach is useful for high-growth companies expected to mature over time, such as tech firms.
- H-Model (for Gradual Transition from High to Stable Growth): A variation of the multi-stage model that gradually transitions from a high initial growth rate to a stable rate over time, the H-Model is helpful for firms where growth rates taper off gradually rather than sharply.
- Assumes a gradual decline in growth rate over a transition period, which eventually stabilizes.
- The formula uses an average growth rate to approximate the decline in growth.
3. Estimation of Key Inputs for DDM
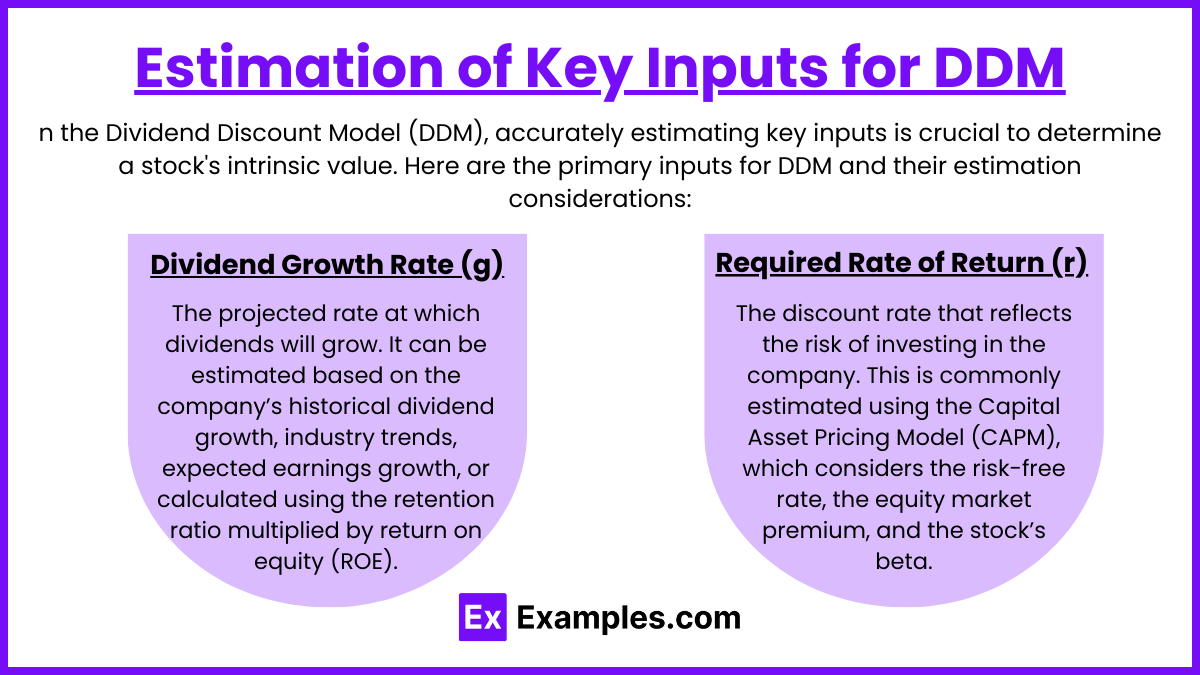
- Dividend Growth Rate (g): The projected rate at which dividends will grow. It can be estimated based on the company’s historical dividend growth, industry trends, expected earnings growth, or calculated using the retention ratio multiplied by return on equity (ROE).
- Commonly estimated using historical growth rates, analysts’ forecasts, or the sustainable growth rate formula:
- g = ROE × (1 − Dividend Payout Ratio).
- This represents a firm’s ability to reinvest earnings and grow.
- Required Rate of Return (r): The discount rate that reflects the risk of investing in the company. This is commonly estimated using the Capital Asset Pricing Model (CAPM), which considers the risk-free rate, the equity market premium, and the stock’s beta.
- Often estimated using the Capital Asset Pricing Model (CAPM):
- r = Rf + β × (Rm − Rf)
- Where:
- Rf = Risk-free rate
- β = Sensitivity of the stock to market returns
- Rm = Expected return on the market
- Reflects the return demanded by investors for the risk they assume.
4. Limitations of Discounted Dividend Valuation
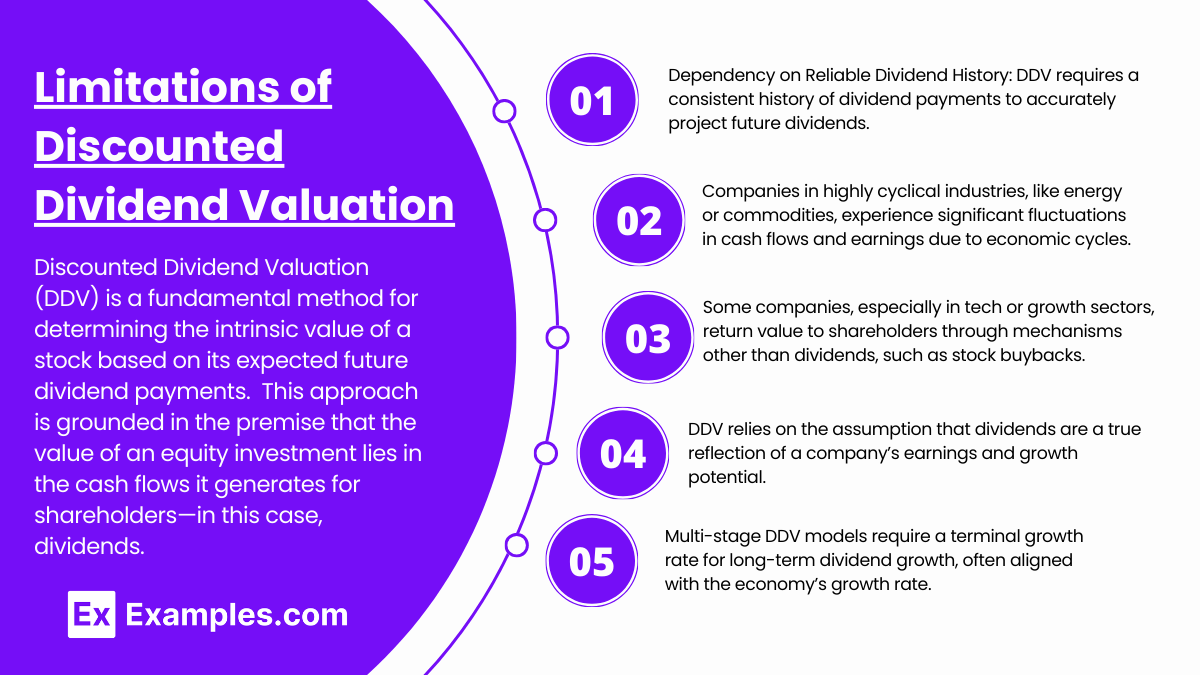
- Dependency on Reliable Dividend History: DDV requires a consistent history of dividend payments to accurately project future dividends. Companies with sporadic or recently initiated dividends pose a challenge, as there is limited data to predict future growth reliably.
- Challenges with Cyclical Industries: Companies in highly cyclical industries, like energy or commodities, experience significant fluctuations in cash flows and earnings due to economic cycles. This volatility makes it difficult to apply a stable growth rate in DDV, as dividend payouts may vary significantly across business cycles.
- Inapplicability to Firms with Alternative Capital Returns: Some companies, especially in tech or growth sectors, return value to shareholders through mechanisms other than dividends, such as stock buybacks. DDV does not account for these alternative methods of capital return, potentially undervaluing companies that prioritize share repurchases over dividends.
- Assumes Dividends Reflect Earnings and Growth: DDV relies on the assumption that dividends are a true reflection of a company’s earnings and growth potential. However, dividend payments are subject to management discretion and may not accurately represent the company’s financial health or profitability.
- Difficulty in Estimating Terminal Growth Rates: Multi-stage DDV models require a terminal growth rate for long-term dividend growth, often aligned with the economy’s growth rate. However, projecting this rate over the long term introduces uncertainty, especially for companies in volatile sectors or with uncertain growth prospects.
Examples
Example 1: Gordon Growth Model for Utility Companies
A utility company has a steady dividend payout with predictable growth. Using the Gordon Growth Model, analysts can calculate its stock value by assuming a constant growth rate in dividends. This model is especially effective for utility companies due to their regulated earnings and stable dividend policies, allowing for accurate intrinsic value estimates.
Example 2: Two-Stage DDM for Technology Firms
For a growing tech company, analysts might use a two-stage DDM. In the initial stage, dividends grow rapidly as the firm expands, then stabilize at a slower rate as it matures. This model captures the high-growth potential and eventual stable dividend payout, reflecting the company’s life cycle more accurately than a single growth model.
Example 3: H-Model for Gradual Transition Firms
Some companies, like consumer goods firms, experience gradual transitions from high growth to stability. The H-Model estimates value by allowing for a declining growth rate over time. This model is useful for firms that slowly shift from aggressive expansion to a more mature, steady state, capturing the gradual change in their growth pattern.
Example 4: Three-Stage DDM for Cyclical Industries
Cyclical industries, such as manufacturing, often experience multiple growth phases. The three-stage DDM accounts for initial growth, a middle transitional phase, and eventual stable growth. This model is valuable for valuing cyclical stocks, as it considers different growth rates that correspond with economic cycles and company-specific factors.
Example 5: Sensitivity Analysis for Financial Institutions
When valuing a financial institution with DDM, analysts often conduct sensitivity analysis. They adjust key inputs, like the growth rate and required return, to assess how changes impact the stock’s value. This analysis helps manage the risk of input sensitivity in DDM, providing a range of potential valuations based on different economic and market conditions.
Practice Questions
Question 1
A stock is expected to pay a dividend of $2.50 next year, and dividends are expected to grow at a constant rate of 5% per year. If the required rate of return on the stock is 10%, what is the estimated value of the stock using the Gordon Growth Model?
A) $20.00
B) $25.00
C) $50.00
D) $52.50
Answer: B) $25.00
Explanation: The Gordon Growth Model (also known as the Dividend Discount Model for constant growth) values a stock based on the formula:
![]()
Where:
- P0 = Current price of the stock
- D1 = Dividend expected next year ($2.50)
- r = Required rate of return (10% or 0.10)
- g = Dividend growth rate (5% or 0.05)
Plugging in the values:
![]()
Thus, the estimated value of the stock is $25.00.
Question 2
An investor is considering a stock that currently pays a $3 dividend, expected to grow at 6% for the next 5 years before stabilizing at a growth rate of 3%. If the required rate of return is 8%, what type of Dividend Discount Model (DDM) should the investor use?
A) Single-Stage DDM
B) Two-Stage DDM
C) Three-Stage DDM
D) H-Model
Answer: B) Two-Stage DDM
Explanation: A Two-Stage DDM is appropriate when a stock is expected to have two distinct growth phases: an initial high-growth phase followed by a stable growth phase. In this case, the stock’s dividends are expected to grow at 6% for the first 5 years and then at a lower, stable rate of 3% thereafter. This setup aligns with the characteristics of a Two-Stage DDM, as it allows for calculating dividends separately for each growth phase and discounting them to the present value. A Single-Stage DDM wouldn’t account for the change in growth rates, while a Three-Stage DDM would be more complex than necessary.
Question 3
Which of the following is a limitation of the Gordon Growth Model in valuing stocks?
A) It can only be used for companies that do not pay dividends.
B) It assumes dividends grow at a variable rate.
C) It is most suitable for valuing companies with unstable dividend policies.
D) It assumes a constant growth rate that may not be realistic for all companies.
Answer: D) It assumes a constant growth rate that may not be realistic for all companies.
Explanation: The Gordon Growth Model (Single-Stage DDM) assumes that dividends grow at a constant rate indefinitely. This can be a limitation because many companies do not have predictable or stable dividend growth. For example, companies in high-growth industries may experience fluctuating growth rates due to varying business cycles or reinvestment needs. While the Gordon Growth Model is suitable for mature companies with stable dividends, it is less effective for companies with unpredictable dividends or multiple growth phases, where a multi-stage model would be more appropriate.

