Preparing for the CFA Exam requires a solid grasp of equity valuation, a fundamental aspect of investment analysis. Understanding the core concepts and tools, including valuation models, intrinsic value assessment, and financial forecasting, is essential. Mastery of these areas is vital for accurately assessing stock value and making informed investment decisions.
Learning Objective
In studying "Equity Valuation: Concepts and Basic Tools" for the CFA Exam, you should aim to understand the fundamental approaches to valuing equities, including the dividend discount model, free cash flow models, and relative valuation methods. Learn how to assess intrinsic value by applying these models and analyzing assumptions related to growth rates, discount rates, and financial forecasts. Evaluate the impact of various economic factors, market trends, and company-specific attributes on equity valuation. Additionally, explore the strengths and limitations of each method, and apply your understanding to real-world scenarios, preparing for rigorous CFA-level valuation questions and analyses.
What is Equity Valuation?

Equity Valuation is the process of determining the intrinsic or fair value of a company's stock. This involves analyzing a company's financial performance, growth potential, and risk factors to assess whether its shares are overvalued, undervalued, or fairly priced in the market. Various models and techniques are used in equity valuation, including the dividend discount model, free cash flow models, and relative valuation methods, to estimate the future cash flows or dividends a company is expected to generate, discounting them to present value. Accurate equity valuation is essential for making informed investment decisions
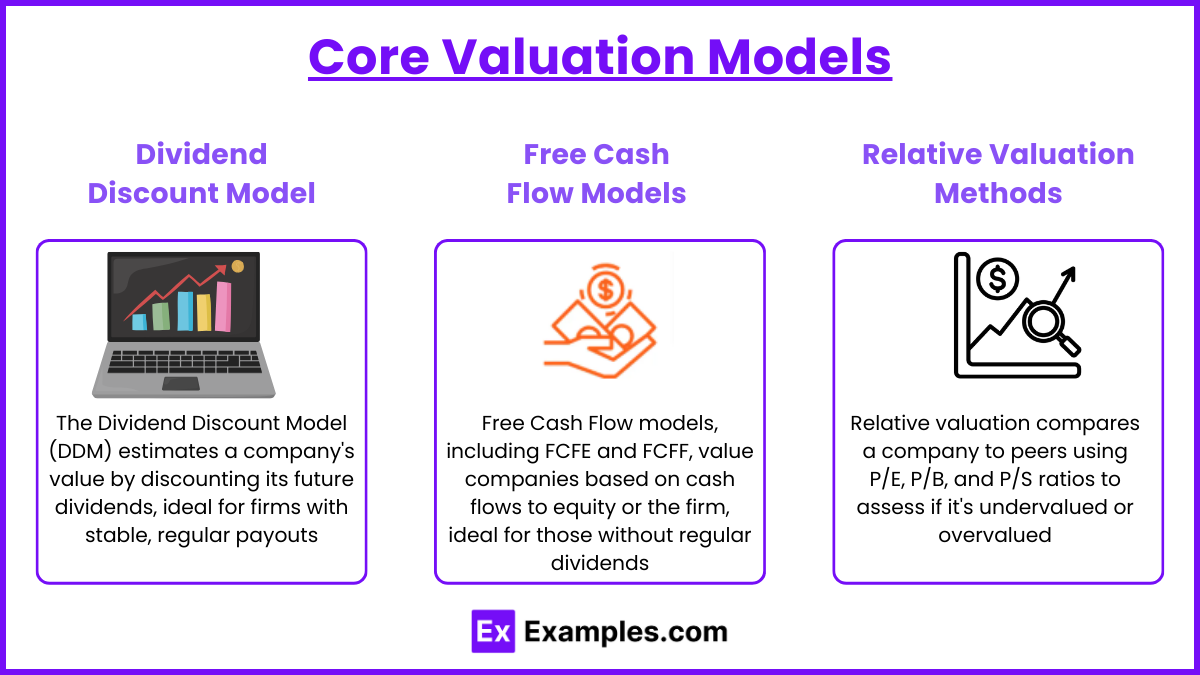
Core Valuation Models
Dividend Discount Model (DDM)
The Dividend Discount Model values a company by estimating the present value of its future dividend payments. This model is based on the idea that the value of a stock is the sum of all future dividends, discounted to reflect their present value. The most common form, the Gordon Growth Model, assumes a constant growth rate in dividends, making it ideal for companies with stable, predictable dividend payouts. While DDM is simple and widely used, it is limited to dividend-paying companies.Free Cash Flow Models
Free Cash Flow (FCF) models, such as Free Cash Flow to Equity (FCFE) and Free Cash Flow to the Firm (FCFF), assess a company's value based on cash flows available to either equity shareholders or the firm as a whole. FCFE considers cash available after covering expenses, taxes, and debt obligations, whereas FCFF represents cash flows before debt repayments. These models are useful when dividends are not paid consistently, as they rely on cash flow forecasts rather than dividend payments.Relative Valuation Methods
Relative valuation compares a company to similar firms within its industry by using valuation multiples such as the Price-to-Earnings (P/E), Price-to-Book (P/B), and Price-to-Sales (P/S) ratios. This approach helps investors quickly assess if a company is undervalued or overvalued relative to peers. Relative valuation is particularly useful when estimating value in sectors with consistent metrics across companies, though it may not capture unique attributes of individual firms.
Intrinsic Value Assessment
Intrinsic value assessment is the process of estimating a stock's true or fundamental value, based on factors like future cash flows, earnings potential, and the financial health of the company. This approach contrasts with market value, which can be influenced by investor sentiment, market conditions, and short-term trends. Intrinsic value assessment helps investors determine if a stock is overvalued, undervalued, or fairly priced by comparing the estimated intrinsic value with its current market price.
To assess intrinsic value, analysts use various valuation models—such as the Dividend Discount Model (DDM) or Free Cash Flow (FCF) models—to project future financial performance, discounting these cash flows to their present value using an appropriate discount rate. This rate typically reflects the required rate of return or the company’s cost of capital, accounting for the risk associated with the investment
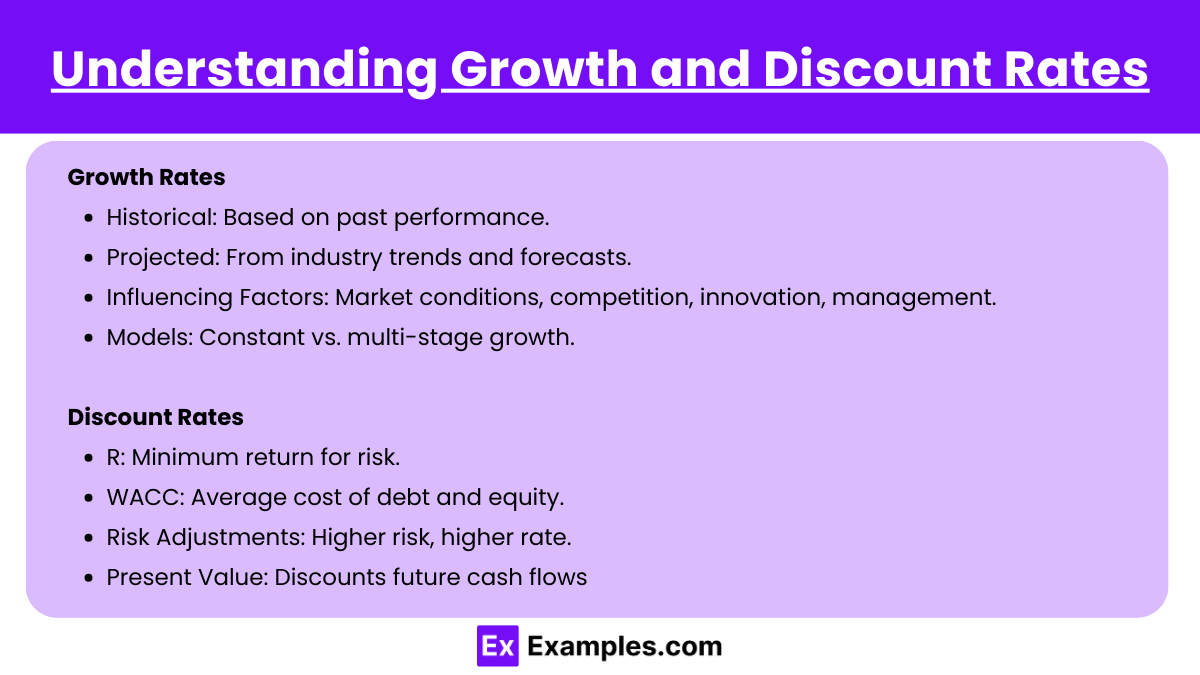
Understanding Growth and Discount Rates
Growth Rates
Historical Growth: Calculated based on past performance, offering a baseline for future growth assumptions.
Projected Growth: Estimated based on industry trends, company forecasts, and economic factors to predict future performance.
Factors Influencing Growth: Includes market conditions, competitive environment, innovation, and management quality, impacting both short- and long-term growth potential.
Types of Growth Models: Constant growth (e.g., in the Dividend Discount Model) assumes a steady rate, while multi-stage models allow for changing growth rates over time.
Discount Rates
Required Rate of Return (RRR): The minimum return investors expect, accounting for risk; often used as the discount rate in equity valuations.
Weighted Average Cost of Capital (WACC): Used for firm-wide valuation, representing the average cost of both debt and equity financing, adjusted for risk.
Risk Adjustments: Higher-risk investments typically require higher discount rates to compensate for uncertainty.
Role in Present Value Calculations: Discount rates adjust future cash flows to present value, critical for assessing a stock’s intrinsic value accurately
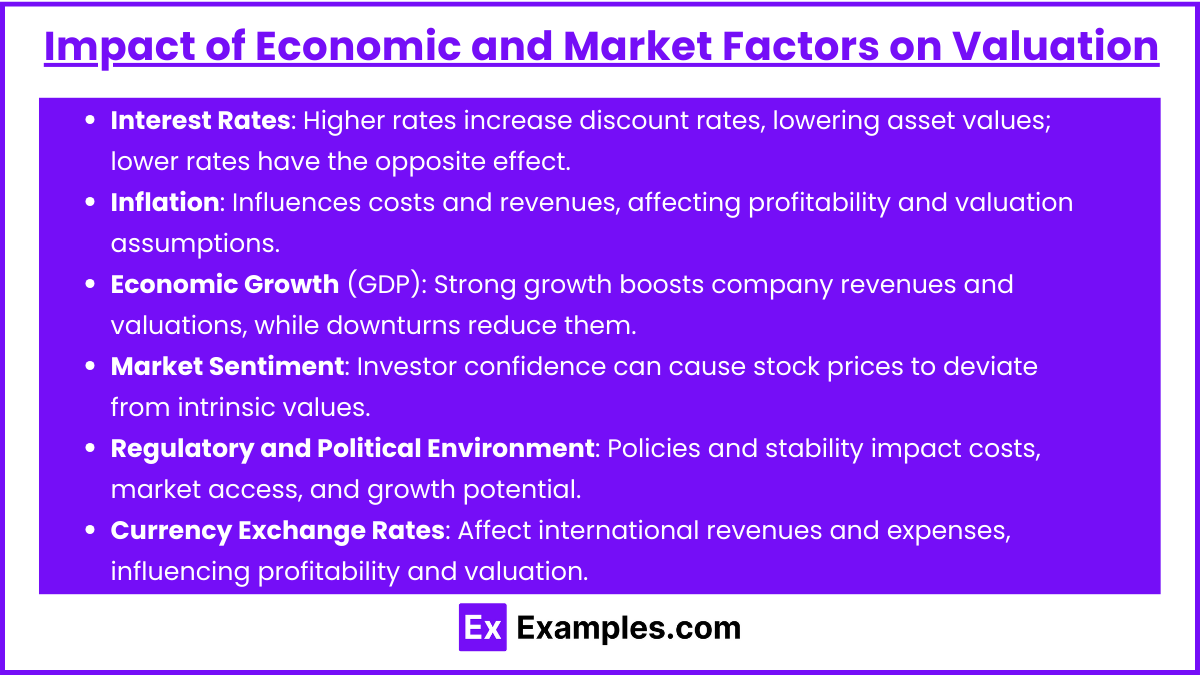
Impact of Economic and Market Factors on Valuation
Interest Rates
Changes in interest rates impact the cost of capital, affecting the discount rate used in valuation models. Higher interest rates generally increase discount rates, leading to lower present values of future cash flows. Conversely, lower interest rates reduce the discount rate, increasing asset valuations.
Inflation
Inflation influences both costs and revenues, affecting profitability and cash flows. Higher inflation can lead to higher costs, reducing net income, while also potentially boosting revenues in inflation-sensitive industries. Inflation expectations often factor into valuation assumptions, especially for growth rates and discount rates.
Economic Growth and GDP
Economic growth affects demand across sectors. Strong GDP growth can signal increased revenues for companies, positively impacting valuations. Conversely, during economic downturns, lower consumer spending and investment may negatively impact company performance and, thus, valuation estimates.
Market Sentiment and Investor Confidence
Investor sentiment impacts stock prices, sometimes leading to overvaluation or undervaluation relative to intrinsic value. Positive sentiment during economic booms may drive prices up, while negative sentiment during downturns or recessions may depress prices even if fundamentals remain strong.
Regulatory and Political Environment
Policies and regulations (e.g., tax laws, trade policies, environmental standards) can impact operational costs and market access. Political stability and government policies on trade and industry support also influence long-term growth potential, impacting valuations, especially for multinational companies.
Currency Exchange Rates
For companies with international operations, exchange rates can impact revenues and expenses. A stronger domestic currency may reduce foreign revenue when converted, while a weaker currency could enhance revenues from overseas, affecting overall profitability and valuation
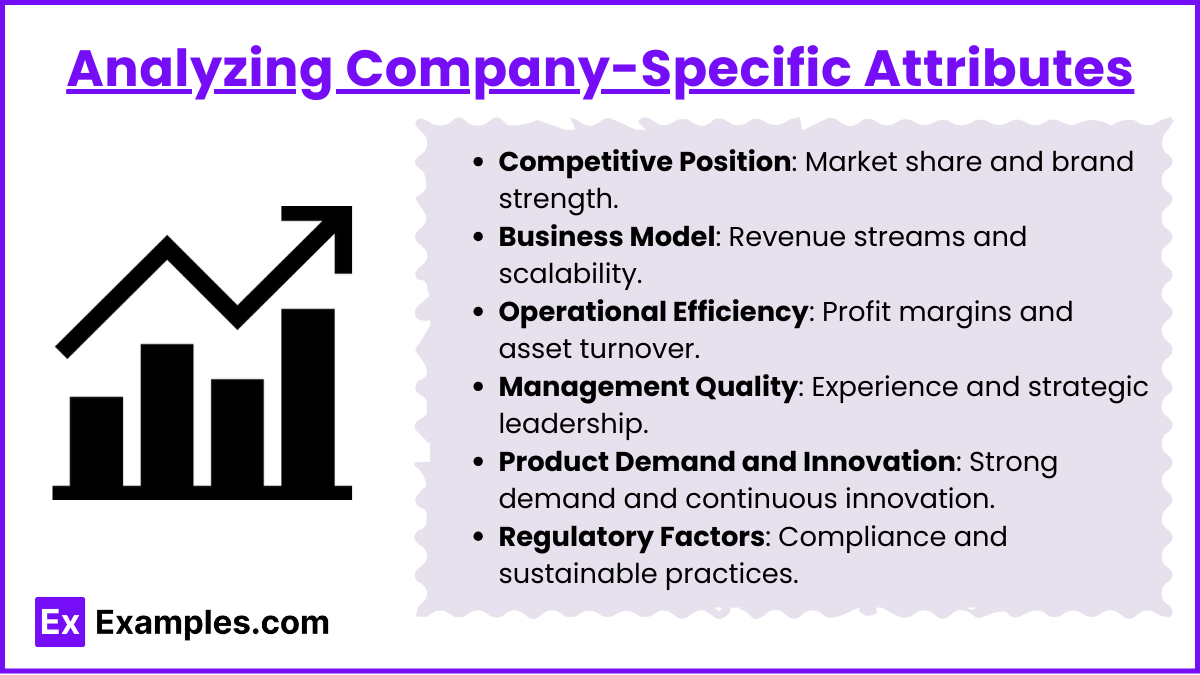
Analyzing Company-Specific Attributes
Competitive Position
Assess a company's market share, brand strength, and industry standing. Strong competitive positioning often supports higher valuations due to sustainable revenue and profitability advantages.
Business Model
Evaluate the company’s revenue streams, cost structure, and scalability. A resilient and adaptable business model enhances valuation by providing consistent income and growth potential.
Operational Efficiency
Analyze metrics like profit margins, return on assets, and asset turnover. Efficient operations lead to better profitability, making the company more attractive to investors.
Management Quality
Strong, experienced management can drive effective strategy, innovation, and risk management, increasing investor confidence and positively impacting valuation.
Product Demand and Innovation
Companies with high demand for products or strong innovation pipelines are valued more favorably, as they indicate potential for sustained growth and market relevance.
Regulatory and Environmental Factors
Compliance with regulations and sustainable practices can influence long-term profitability and risk. Companies proactive in these areas often enjoy more favorable valuations due to lower future liabilities
Examples
Example 1: Valuing a Dividend-Paying Utility Company Using the Dividend Discount Model (DDM)
A utility company with stable dividend payouts may be valued using the Dividend Discount Model. Suppose the company pays an annual dividend of $4 per share, and the dividend is expected to grow at a constant rate of 2% per year. If the required rate of return is 6%, the intrinsic value of the stock would be calculated as follows:
This valuation indicates that, at $102, the stock is fairly valued for an investor seeking a 6% return.
Example 2: Applying Free Cash Flow to Equity (FCFE) for a Technology Firm
For a technology company with no dividends but strong growth potential, Free Cash Flow to Equity (FCFE) is often used. Assume the company has forecasted FCFE of $50 million, with an expected growth rate of 10% for the next five years, followed by a terminal growth rate of 3%. Using a required rate of return of 8%, the intrinsic value can be calculated by discounting future cash flows, providing insights into the value of the company based on its future cash generation potential.
Example 3: Using Relative Valuation for a Retail Chain
A retail chain can be valued using relative valuation metrics such as the Price-to-Earnings (P/E) ratio. If industry competitors trade at an average P/E of 15, and the retail chain’s earnings per share (EPS) is $3, its relative valuation would be:
This implies that, based on industry standards, the stock would be fairly valued at $45. Relative valuation provides a quick benchmark against similar companies.
Example 4: Asset-Based Valuation for a Real Estate Investment Trust (REIT)
A Real Estate Investment Trust (REIT) with significant tangible assets can be valued using an asset-based approach. By calculating the market value of its real estate holdings and subtracting liabilities, investors can determine the Net Asset Value (NAV). Suppose the REIT’s assets are worth 100 million in liabilities, the NAV per share (if 10 million shares are outstanding) would be:
This provides a baseline valuation based on tangible assets, often used to assess REITs and other asset-heavy businesses.
Example 5: Incorporating Economic Factors in Valuation During a Low-Interest Rate Environment
When valuing companies in a low-interest rate environment, discount rates are adjusted downward, often resulting in higher valuations. For example, if a pharmaceutical company is expected to generate $20 million in free cash flow annually with a discount rate of 5% (reflecting lower interest rates), the present value of its cash flows is:
This higher valuation, resulting from the lower discount rate, underscores the influence of economic conditions on intrinsic value, as investor expectations adjust to reflect broader market trends
Practice Question
Question 1
Which of the following valuation models is most appropriate for valuing a company that does not pay dividends but has stable and predictable cash flows?
A) Dividend Discount Model (DDM)
B) Free Cash Flow to Equity (FCFE) Model
C) Price-to-Earnings (P/E) Ratio
D) Price-to-Sales (P/S) Ratio
Answer: B) Free Cash Flow to Equity (FCFE) Model
Explanation: The Free Cash Flow to Equity (FCFE) model is suitable for companies that do not pay dividends but have stable and predictable cash flows. Unlike the Dividend Discount Model, which requires regular dividends, FCFE focuses on cash flows available to equity shareholders, making it more appropriate for non-dividend-paying companies.
Question 2
If a company’s dividend is expected to grow at a constant rate indefinitely, which valuation model is best suited for estimating its intrinsic value?
A) Free Cash Flow to the Firm (FCFF) Model
B) Dividend Discount Model (DDM)
C) Price-to-Earnings (P/E) Ratio
D) Net Asset Value (NAV)
Answer: B) Dividend Discount Model (DDM)
Explanation: The Dividend Discount Model (DDM) is ideal for valuing a company whose dividends are expected to grow at a constant rate indefinitely. This model calculates the present value of an infinite series of dividends that are growing at a constant rate, making it suitable for stable, dividend-paying companies.
Question 3
Which of the following is NOT typically used as a multiple in relative valuation?
A) Price-to-Earnings (P/E) Ratio
B) Price-to-Book (P/B) Ratio
C) Free Cash Flow to Equity (FCFE) Ratio
D) Price-to-Sales (P/S) Ratio
Answer: C) Free Cash Flow to Equity (FCFE) Ratio
Explanation: Free Cash Flow to Equity (FCFE) is not commonly used as a multiple in relative valuation. Commonly used multiples include the Price-to-Earnings (P/E) ratio, Price-to-Book (P/B) ratio, and Price-to-Sales (P/S) ratio. FCFE is used in discounted cash flow (DCF) valuation rather than as a market multiple.

