Preparing for the CFA Exam requires proficiency in “Estimation and Inference,” which involves statistical methods used to draw conclusions about populations based on sample data. Key topics include point estimation, interval estimation, and hypothesis testing. Mastery of these concepts enables candidates to make informed, data-driven decisions regarding investment strategies and financial forecasting, which are essential for success on the CFA Exam.
Learning Objectives
In studying “Estimation and Inference” for the CFA exam, you should learn to understand the fundamental statistical concepts that underpin financial decision-making. This area focuses on using sample data to make inferences about a population, allowing analysts to assess risk and return characteristics of investments. Key topics include point estimation, confidence intervals, and hypothesis testing. Learn to apply these concepts to evaluate investment opportunities and perform risk assessments.
Key Concepts in Estimation and Inference

1. Point Estimation
- Definition: A point estimate provides a single best guess of a population parameter (e.g., mean, variance).
- Application: Financial analysts use point estimates to forecast asset returns or assess market volatility.
- Techniques: Mean, median, and mode are common measures in point estimation.
2. Interval Estimation
- Definition: Interval estimation calculates a range (interval) within which the population parameter is likely to lie.
- Significance: Provides a range with a specified level of confidence (e.g., 95%) that the actual parameter lies within this range.
3. Confidence Intervals
- Purpose: A confidence interval for a parameter, such as the mean, allows analysts to assess the reliability of their estimates.
- Focus: It often ask candidates to calculate and interpret confidence intervals, which is critical for gauging investment risk and return.
4. Hypothesis Testing
- Definition: Hypothesis testing evaluates if the sample data supports a specific assumption about a population parameter.
- Types of Tests:
- One-tailed test: Tests if a parameter is greater or less than a specific value.
- Two-tailed test: Tests if a parameter is equal to a specified value.
- Common Hypotheses:
- Mean difference: Testing if the average return of one asset differs from another.
- Significance Levels: Common levels are 5% and 1% in the context, indicating the likelihood of observing a result under the null hypothesis.
5. Type I and Type II Errors
- Type I Error: Incorrectly rejecting a true null hypothesis (false positive).
- Type II Error: Failing to reject a false null hypothesis (false negative).
- Application in Finance: Misestimating the risk of Type I and Type II errors affects decision-making, especially in risk management and portfolio optimization.
Estimation and Inference Process

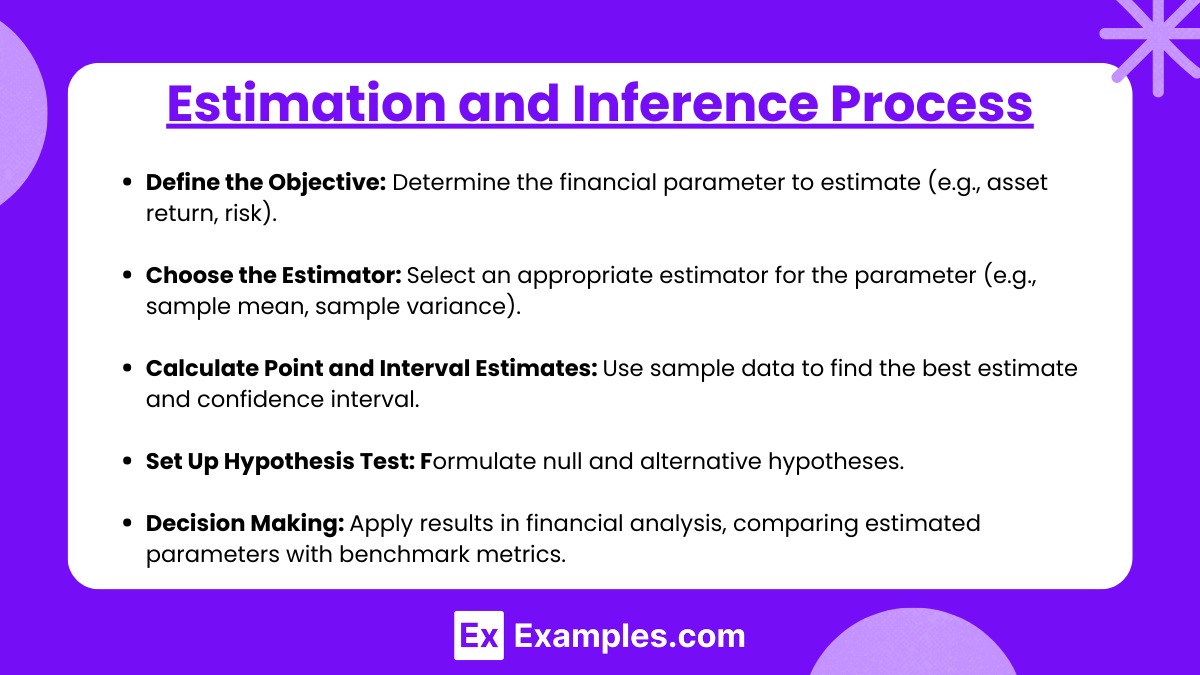
- Define the Objective: Determine the financial parameter to estimate (e.g., asset return, risk).
- Choose the Estimator: Select an appropriate estimator for the parameter (e.g., sample mean, sample variance).
- Calculate Point and Interval Estimates: Use sample data to find the best estimate and confidence interval.
- Set Up Hypothesis Test: Formulate null and alternative hypotheses.
- Decision Making: Apply results in financial analysis, comparing estimated parameters with benchmark metrics.
Applications of Estimation and Inference

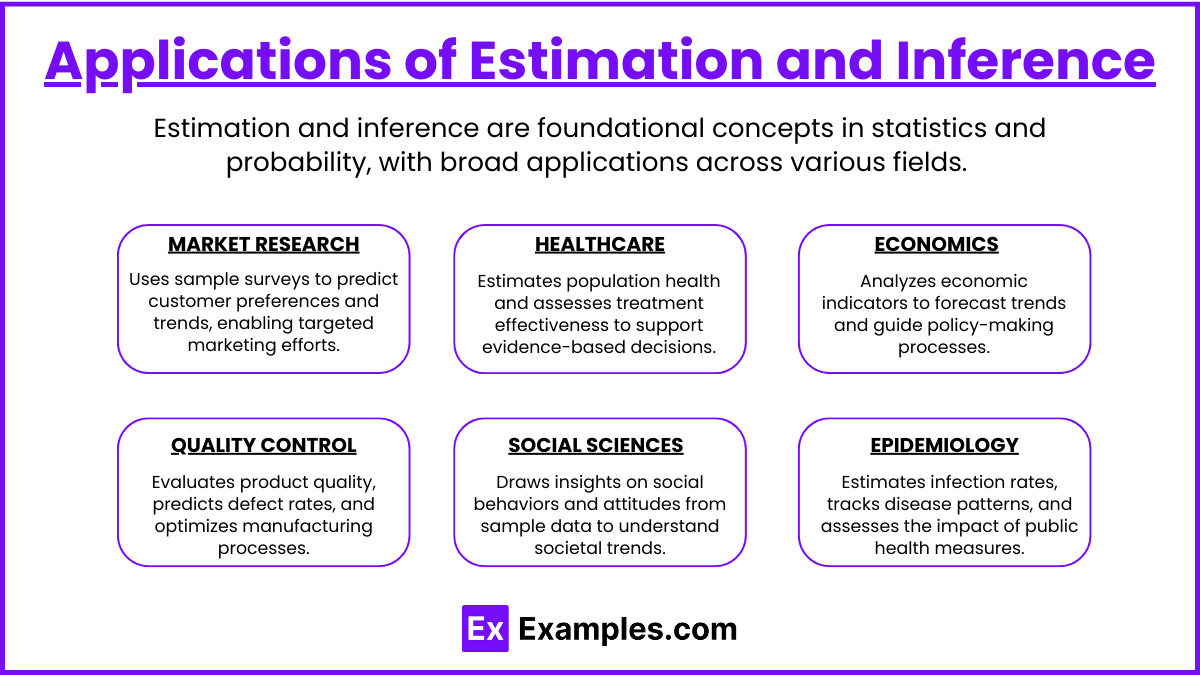
- Market Research: Estimation and inference help predict customer preferences, trends, and behaviors based on sample surveys, enabling targeted marketing strategies.
- Healthcare: These methods aid in estimating population health statistics, assessing treatment efficacy, and making evidence-based medical decisions.
- Economics: Economists use estimation and inference to analyze economic indicators, forecast trends, and guide policy-making.
- Quality Control: In manufacturing, estimation and inference assess product quality, predict defect rates, and improve processes.
- Social Sciences: Researchers use these techniques to draw insights from sample data on social behaviors, attitudes, and societal trends.
- Epidemiology: Estimation and inference allow scientists to estimate infection rates, evaluate disease trends, and assess the impact of public health interventions.
Examples
Example 1. Market Research Analysis
In market research, estimation and inference are used to understand consumer behavior and predict future trends. Analysts collect data from a sample group, then use estimation techniques to make inferences about the broader population’s preferences. For example, if 60% of a sample group prefers online shopping, analysts can estimate that a similar proportion of the general population may share this preference, which can guide marketing strategies.
Example 2. Healthcare Decision-Making
Healthcare professionals rely on estimation and inference to evaluate treatment effectiveness. By observing a sample of patients undergoing a new treatment, researchers estimate the potential benefits and side effects for a larger population. This helps doctors and policymakers make informed decisions about which treatments to recommend or fund, impacting public health at a larger scale.
Example 3. Quality Control in Manufacturing
Manufacturers use estimation and inference to maintain product quality. By sampling a small number of products from a production line, quality control teams can estimate the likelihood of defects in the entire batch. This approach allows companies to implement quality improvements based on the inferences drawn from sample inspections, leading to higher customer satisfaction and reduced returns.
Example 4. Financial Forecasting
In finance, estimation and inference are critical for investment analysis. Financial analysts use historical data to estimate the future performance of assets or portfolios. By analyzing sample data and inferring trends, investors can make educated decisions about stock purchases, risk management, and portfolio allocation. This statistical inference helps investors optimize returns while minimizing risks.
Example 5. Public Policy and Economics
Economists and policymakers use estimation and inference to predict economic outcomes and make policy decisions. For instance, by analyzing unemployment rates within a sample group, economists estimate the potential effects of policy changes on the larger population. These inferences guide decisions on tax policies, minimum wage adjustments, and welfare programs, ensuring that policies are designed to meet the needs of society effectively.
Practice Questions
Question 1
Which of the following best describes the purpose of using estimation in statistics?
A) To predict future events based on patterns
B) To make a guess about an unknown value using sample data
C) To compare two datasets for differences
D) To measure the exact population parameter without error
Answer: B) To make a guess about an unknown value using sample data
Explanation: Estimation is the process of making inferences about a population parameter based on sample data. Since it’s usually impractical to measure every member of a population, statisticians use a sample to estimate characteristics like the population mean or proportion. This answer is correct because estimation provides a way to approximate these unknown values, though there is always some level of uncertainty, known as sampling error.
Question 2
A researcher wants to determine the average time spent on a website by all visitors. She takes a random sample of 100 visitors and calculates the sample mean time. What type of inference is she making?
A) Descriptive inference
B) Statistical inference
C) Parameter estimation
D) Predictive inference
Answer: C) Parameter estimation
Explanation: In this scenario, the researcher is using a sample mean to estimate the average time (a parameter) that all visitors spend on the website. This process is known as parameter estimation, where the sample mean serves as an estimate for the unknown population mean. Statistical inference (Answer B) is a broader term that encompasses both parameter estimation and hypothesis testing, while descriptive inference only involves describing the data. Predictive inference (Answer D) would involve forecasting future outcomes, which is not the goal in this case.
Question 3
Which of the following statements is true about confidence intervals?
A) A 95% confidence interval means the estimated value is within the interval 95% of the time.
B) A confidence interval provides a range within which we are confident the sample mean lies.
C) A 95% confidence interval means that, if we took many samples, approximately 95% of the intervals would contain the population parameter.
D) Increasing the confidence level from 95% to 99% makes the interval narrower.
Answer: C) A 95% confidence interval means that, if we took many samples, approximately 95% of the intervals would contain the population parameter.
Explanation: Confidence intervals represent the range within which we expect the population parameter to fall based on the sample data, with a given level of confidence (e.g., 95%). Answer C is correct because a 95% confidence level means that, across many repeated samples, 95% of the calculated intervals would contain the true population parameter. Answer A is incorrect because the confidence interval does not apply to individual samples but rather to the likelihood of capturing the population parameter. Answer B is incorrect because the interval is for the population parameter, not the sample mean. Answer D is incorrect because increasing the confidence level makes the interval wider, reflecting greater uncertainty in the precise estimate.


