Evaluating the Quality of Financial Reports is essential for understanding the reliability and integrity of financial statements. This topic delves into assessing earnings quality, identifying potential accounting irregularities, and analyzing the transparency of financial disclosures. Key areas include detecting earnings management, understanding the impacts of accounting choices on reported results, and evaluating the consistency of financial reporting practices. Proficiency in these aspects is critical for making informed investment decisions and accurately assessing a company’s financial health, as well as for navigating the complexities of financial analysis.
Learning Objectives
In studying “Evaluating Quality of Financial Reports” for the CFA, you should learn to assess the reliability and accuracy of financial reports by analyzing the quality of earnings, cash flows, and balance sheet components. Understand how to identify red flags in financial statements, such as aggressive revenue recognition, hidden liabilities, and inconsistencies in accounting policies. Evaluate the impact of management’s judgment and accounting choices on financial reports and analyze how these choices can affect reported results. Recognize indicators of earnings management and fraudulent reporting practices. Additionally, develop skills in comparing financial reports across companies and industries to gauge financial health accurately and make informed investment decisions.
Assessing Reliability and Accuracy of Financial Reports
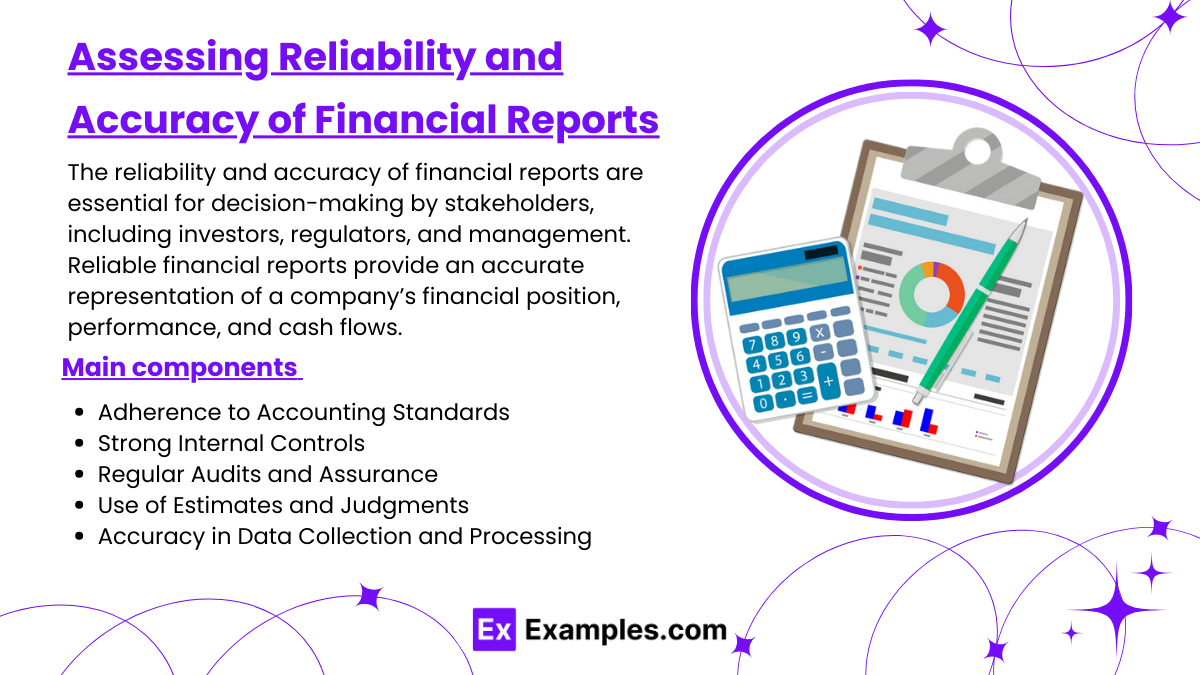
The reliability and accuracy of financial reports are essential for decision-making by stakeholders, including investors, regulators, and management. Reliable financial reports provide an accurate representation of a company’s financial position, performance, and cash flows. Ensuring this accuracy involves strong internal controls, adherence to accounting standards, and regular audits. Here are some of the main components involved in assessing the reliability and accuracy of financial reports.
1. Adherence to Accounting Standards
Following established accounting standards, such as the Generally Accepted Accounting Principles (GAAP) or International Financial Reporting Standards (IFRS), ensures consistency, transparency, and comparability in financial reporting.
- Consistency: By adhering to standardized methods for recording transactions, companies ensure consistent reporting across periods, which improves reliability.
- Transparency: Detailed disclosures required by these standards provide stakeholders with important information on accounting policies, estimates, and assumptions, which enhances report accuracy.
- Comparability: Standardization enables comparison with other companies and industry benchmarks, which helps assess financial reliability across the sector.
Example: A company preparing financial statements according to IFRS must disclose its revenue recognition policy, which helps users understand how revenue figures are derived.
2. Strong Internal Controls
Effective internal controls are crucial in preventing errors and fraud in financial reporting. They provide a structured system for recording, processing, and reporting financial data accurately.
- Segregation of Duties: Dividing responsibilities among employees reduces the risk of error or fraud, as no single person has complete control over financial transactions.
- Approval and Authorization: Requiring proper authorization for significant transactions and expenses helps prevent unauthorized actions and ensures that all transactions are recorded accurately.
- Reconciliation and Review: Regular reconciliations of accounts and reviews by management help identify and correct discrepancies before financial statements are finalized.
Example: Monthly bank reconciliations by the finance team allow the company to verify cash balances and detect any unrecorded transactions or errors, ensuring accuracy in reported cash figures.
3. Regular Audits and Assurance
Independent audits by external auditors provide an objective assessment of the financial statements, helping verify their reliability and accuracy.
- External Audits: An independent auditor reviews the financial statements and issues an opinion on whether they fairly represent the company’s financial position, performance, and cash flows in accordance with accounting standards.
- Internal Audits: Conducted by internal audit teams, these assessments evaluate the effectiveness of internal controls and ensure compliance with policies, providing an additional layer of reliability.
- Audit Committees: The board of directors’ audit committee oversees financial reporting and audits, providing governance and accountability for financial accuracy.
Example: A “clean” or unqualified audit opinion from an external auditor indicates that the financial statements are presented fairly, with no material misstatements.
4. Use of Estimates and Judgments
Many financial figures involve estimates, such as asset valuations, depreciation, and provisions for doubtful accounts. Assessing the reasonableness of these estimates is key to ensuring accuracy.
- Management Assumptions: Estimates rely on management’s assumptions, such as expected credit losses or asset life expectancy. Reliable reports include justifiable and well-documented assumptions.
- Sensitivity Analysis: Evaluating how sensitive estimates are to changes in assumptions helps users understand the potential variability in financial figures.
- Disclosure of Estimates: Accounting standards require companies to disclose key assumptions and judgments, providing transparency into areas where accuracy may be affected by estimation uncertainty.
Example: If a company estimates its allowance for doubtful accounts based on historical data and current economic conditions, detailed disclosure allows stakeholders to understand the accuracy of this estimate.
5. Accuracy in Data Collection and Processing
The methods and systems used to gather, record, and process financial data directly affect report accuracy. Ensuring data integrity is crucial for accurate reporting.
- Data Validation: Implementing validation rules within financial software reduces the risk of entry errors, ensuring the completeness and accuracy of data input.
- Automated Systems: Using automated data processing systems and accounting software minimizes human error and improves the reliability of data processing.
- Periodic Data Review: Regular review of data entries and transactions by management ensures that the information captured is accurate, complete, and aligned with financial reporting objectives.
Example: Automated payroll systems that accurately calculate wages, deductions, and tax withholdings enhance the accuracy of payroll-related figures in financial reports.
Identifying Red Flags in Financial Statements
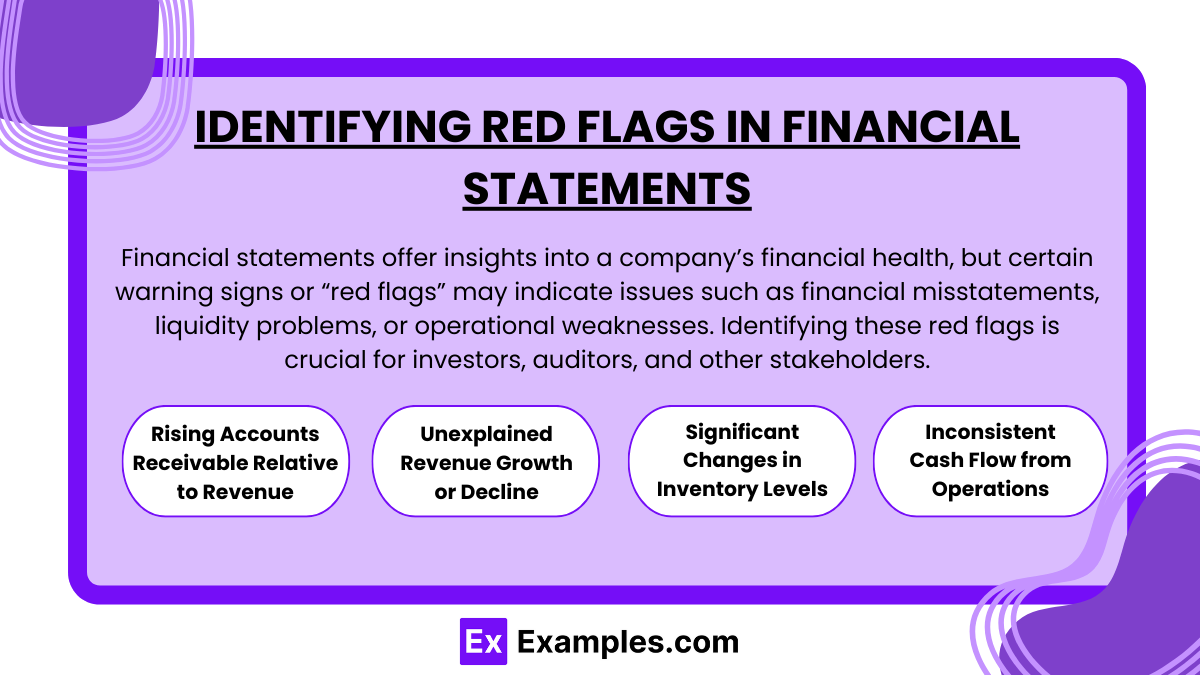
Financial statements offer insights into a company’s financial health, but certain warning signs or “red flags” may indicate issues such as financial misstatements, liquidity problems, or operational weaknesses. Identifying these red flags is crucial for investors, auditors, and other stakeholders in evaluating the credibility and stability of an organization. Here are some common red flags to look out for in financial statements:
Rising Accounts Receivable Relative to Revenue
An increase in accounts receivable (A/R) without corresponding revenue growth may suggest issues with collecting payments or aggressive revenue recognition.
- Higher A/R Turnover Days: If the days sales outstanding (DSO) is increasing, it could mean customers are taking longer to pay, possibly indicating economic challenges or looser credit terms.
- Large A/R Write-Offs: Frequent write-offs or allowances for doubtful accounts may indicate that the company has difficulty collecting receivables, impacting cash flow and profitability.
Example: A company reports a 20% increase in sales but sees a 50% increase in A/R, signaling potential problems with collections or premature revenue booking.
Unexplained Revenue Growth or Decline
Significant, unexplained changes in revenue can signal potential issues, such as inflated revenue figures, over-reliance on specific customers, or underreporting of sales.
- Consistently High Revenue Growth: If revenue growth is significantly higher than industry averages, it may suggest aggressive accounting tactics or premature revenue recognition.
- Sudden Revenue Declines: A rapid decline without explanation might indicate a loss of major clients, product issues, or market challenges.
- Revenue Inconsistencies with Cash Flow: If revenue increases, but cash flow from operations remains flat or negative, it could indicate issues with revenue quality or collection problems.
Example: If a company reports a 50% revenue increase year-over-year but has no major new clients or products, it could be a red flag indicating potential revenue manipulation.
Significant Changes in Inventory Levels
Abnormal inventory fluctuations can reveal issues with demand forecasting, potential obsolescence, or attempts to manipulate reported income.
- Excess Inventory Growth: If inventory grows faster than sales, it may indicate unsold products, overproduction, or declining demand.
- Unusually Low Inventory Levels: Lower-than-normal inventory might suggest supply chain issues, production delays, or attempts to inflate profitability by reducing costs.
- Inventory Write-Downs: Frequent write-downs for obsolete or unsellable inventory are warning signs that the company is struggling with demand management.
Example: A retailer reports increasing inventory while sales decline, potentially signaling overproduction or difficulty selling products.
Inconsistent Cash Flow from Operations
A strong business should show consistent or growing cash flow from operations (CFO). Discrepancies between net income and CFO may indicate financial manipulation or operational issues.
- Low or Negative CFO Despite Profits: If a company reports high profits but consistently shows low or negative CFO, it could be a sign of cash flow issues or revenue inflation.
- Frequent Use of Non-Operating Cash: Excessive reliance on non-operating cash sources, like asset sales or borrowing, to fund operations might indicate cash flow struggles.
- High Working Capital Needs: Increased investment in working capital without a proportional increase in revenue or profits can suggest liquidity problems.
Example: A company shows positive net income but has negative CFO due to rising A/R and inventory levels, which may suggest earnings manipulation or cash collection issues.
Impact of Management’s Judgment and Accounting Choices on Financial Reports
Management’s judgment and accounting choices significantly shape a company’s financial reports. Through the selection of accounting policies, use of estimates, and application of financial reporting practices, management can influence how financial results appear to stakeholders. While judgment is essential for adapting to complex transactions and industry-specific nuances, it can also lead to variations in reported figures, affecting the reliability and comparability of financial statements. Here’s how management’s judgment and accounting choices impact financial reporting:
Revenue Recognition Policies
Revenue recognition involves decisions on when and how to recognize income, directly impacting reported revenue and profitability.
- Timing of Revenue Recognition: Management decides when to recognize revenue, which can accelerate or delay revenue reporting. For example, revenue might be recognized upfront in certain contracts or over time as services are delivered.
- Criteria for Revenue: Management often exercises judgment in determining whether performance obligations have been met, especially for long-term projects or contracts.
- Estimates for Variable Consideration: Management estimates discounts, returns, and rebates when recognizing revenue, which impacts the total revenue reported.
Example: In construction companies, management may choose to recognize revenue based on percentage-of-completion rather than at project completion, impacting revenue visibility and profitability throughout the project.
Depreciation and Amortization Choices
Depreciation and amortization policies, including useful life and method selection, influence expenses and asset values on the balance sheet.
- Useful Life Estimates: Management estimates the useful life of assets, which affects annual depreciation or amortization expenses. Extending useful life reduces annual expense, thereby increasing net income.
- Depreciation Method Selection: Straight-line depreciation results in uniform expense recognition, while accelerated methods, such as double-declining balance, recognize higher expenses early in the asset’s life.
- Amortization of Intangibles: Management’s choices in amortizing intangible assets like patents, licenses, or goodwill can have a substantial impact on reported earnings.
Example: A company may choose a longer useful life for machinery, thereby reducing annual depreciation expense and showing higher profitability in the short term.
Inventory Valuation Methods
Inventory valuation impacts cost of goods sold (COGS) and ending inventory, affecting gross profit and net income.
- First-In, First-Out (FIFO) vs. Last-In, First-Out (LIFO): FIFO assumes that the oldest inventory items are sold first, resulting in lower COGS in times of rising prices and higher profits. Conversely, LIFO leads to higher COGS and lower profits when prices are rising.
- Weighted Average Cost: Management may also opt for the weighted average method, which smooths out cost fluctuations over time.
- Lower of Cost or Market (LCM): Inventory write-downs based on LCM can affect asset values on the balance sheet, and management’s judgment in assessing market values directly impacts reported inventory values.
Example: A retailer choosing LIFO during inflationary periods may report lower earnings, while another retailer using FIFO reports higher profits, even if they hold similar inventory levels.
Recognizing Indicators of Earnings Management and Fraudulent Reporting
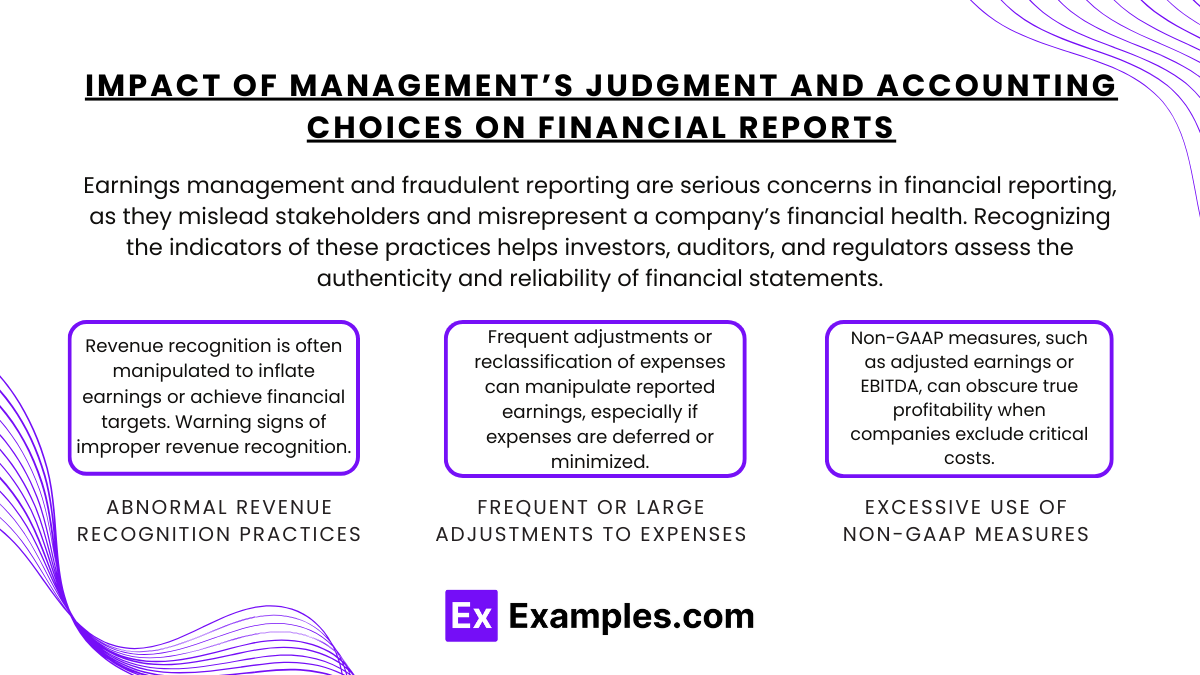
Earnings management and fraudulent reporting are serious concerns in financial reporting, as they mislead stakeholders and misrepresent a company’s financial health. Recognizing the indicators of these practices helps investors, auditors, and regulators assess the authenticity and reliability of financial statements. Below are common indicators of earnings management and fraudulent reporting, with key warning signs to watch for in financial statements.
Abnormal Revenue Recognition Practices
Revenue recognition is often manipulated to inflate earnings or achieve financial targets. Warning signs of improper revenue recognition include:
- Unusual Revenue Growth: Rapid or irregular revenue growth without a clear business reason, such as new products, market expansions, or acquisitions, may signal revenue inflation.
- Recording Revenue Too Early: Recognizing revenue before fulfilling contractual obligations, such as delivering goods or services, artificially boosts current-period earnings.
- Increase in Accounts Receivable Relative to Sales: A growing accounts receivable balance without matching revenue growth may indicate premature revenue recognition or difficulty collecting cash.
Example: A software company recognizing full revenue on a multi-year contract in the first year rather than spreading it over the contract period is a red flag for earnings manipulation.
Frequent or Large Adjustments to Expenses
Frequent adjustments or reclassification of expenses can manipulate reported earnings, especially if expenses are deferred or minimized.
- Delaying Expense Recognition: Shifting expenses, such as maintenance costs, to later periods inflates current-period profits.
- Classifying Ordinary Expenses as Non-Recurring: Labeling recurring costs (e.g., restructuring expenses) as one-time or non-recurring can inflate core earnings.
- Large Write-Offs Following Aggressive Expense Deferrals: Sudden asset write-offs or impairments after periods of deferring expenses may suggest previous periods were manipulated to show inflated profits.
Example: If a company repeatedly labels restructuring costs as “one-time” each year, this indicates potential expense misclassification.
Excessive Use of Non-GAAP Measures
Non-GAAP measures, such as adjusted earnings or EBITDA, can obscure true profitability when companies exclude critical costs, like stock-based compensation or restructuring expenses.
- Frequent Adjustments to “Adjusted” Earnings: Repeated exclusion of regular costs in non-GAAP earnings suggests management may be inflating perceived profitability.
- Large Discrepancies Between GAAP and Non-GAAP Earnings: Significant differences between GAAP and non-GAAP earnings can indicate reliance on subjective adjustments to inflate perceived performance.
- Inconsistent Use of Adjustments: Adjusting items one year but not the next without justification can be a tactic to smooth earnings or meet targets.
Example: A company excluding recurring expenses, like stock-based compensation, from adjusted earnings makes its profitability look better than GAAP earnings would suggest.
Large, Recurring “One-Time” Charges
Frequent use of “one-time” charges, such as restructuring, impairment, or reorganization costs, may signal an attempt to manipulate earnings by excluding expenses from core results.
- Repeated Restructuring Charges: Labeling recurring costs as one-time items distorts the true cost structure and profitability.
- Overuse of Asset Impairments: Frequent impairment of goodwill or other assets may indicate that prior acquisitions were overvalued or that earnings were artificially boosted by deferring write-downs.
- High Level of Non-Recurring Gains: Large gains from asset sales or other non-recurring items can inflate earnings, especially if they are presented as part of core earnings.
Example: A company taking restructuring charges year after year, while calling them “one-time,” may be attempting to normalize inflated core earnings.
Examples
Example 1: Consistency in Accounting Policies
One key aspect of evaluating the quality of financial reports is assessing the consistency of accounting policies over time. For example, if a company changes its method of inventory valuation from FIFO (First In, First Out) to LIFO (Last In, First Out) without adequate disclosure, it raises concerns about the comparability of financial statements across periods. Analysts look for consistent application of accounting principles to ensure that financial results are reliable and can be compared year over year.
Example 2: Transparency and Disclosure
High-quality financial reports provide clear and comprehensive disclosures that enhance the understanding of the company’s financial position and performance. For instance, if a firm includes detailed notes explaining significant accounting estimates, assumptions, and risks, it allows stakeholders to assess the potential impacts on future performance. Evaluating the transparency of disclosures helps investors and analysts gauge the level of risk associated with the company’s financial statements.
Example 3: Adherence to Regulatory Standards
Financial reports must comply with established regulatory frameworks, such as Generally Accepted Accounting Principles (GAAP) or International Financial Reporting Standards (IFRS). For instance, a company that fails to comply with revenue recognition standards might misrepresent its earnings. Evaluating whether financial reports adhere to these standards is crucial for determining their quality and the integrity of the reported information.
Example 4: Analytical Review and Ratios
Analysts often conduct a ratio analysis to evaluate the quality of financial reports. For example, examining the current ratio (current assets divided by current liabilities) can provide insights into a company’s liquidity position. If the reported current ratio is significantly different from industry averages or historical performance, it may prompt further investigation into the quality of the reported figures. This analytical review helps identify potential red flags in financial reporting.
Example 5: Management Discussion and Analysis (MD&A)
The MD&A section of financial reports provides management’s insights into the company’s financial results, strategies, and future outlook. Evaluating this section is important as it can reveal management’s perspective on risks and opportunities. For instance, if management acknowledges challenges and provides a realistic view of the company’s future prospects, it indicates transparency and accountability. Conversely, overly optimistic forecasts without substantiation can raise concerns about the reliability of the financial reports.
Practice Questions
Question 1
Which of the following factors is most indicative of high-quality financial reports?
A) Frequent changes in accounting policies
B) Detailed disclosures about accounting estimates and assumptions
C) Lack of comparison with prior periods
D) Limited management discussion and analysis
Correct Answer: B) Detailed disclosures about accounting estimates and assumptions.
Explanation: High-quality financial reports include comprehensive disclosures that explain the accounting estimates and assumptions used in preparing the financial statements. This level of detail enhances transparency, allowing stakeholders to understand the basis for reported figures and assess the risks involved. In contrast, frequent changes in accounting policies (Option A) can raise concerns about consistency, while limited disclosures (Options C and D) do not provide sufficient context for evaluating the company’s financial health.
Question 2
What is the purpose of conducting ratio analysis when evaluating financial reports?
A) To determine the company’s stock price
B) To compare the company’s performance against industry standards
C) To forecast future sales
D) To assess the company’s marketing strategies
Correct Answer: B) To compare the company’s performance against industry standards.
Explanation: Ratio analysis is a critical tool used to evaluate the quality of financial reports by comparing a company’s financial metrics with industry benchmarks or historical performance. It helps analysts identify trends, assess liquidity, profitability, and solvency, and understand how well the company is performing relative to its peers. Options A, C, and D do not directly relate to the primary purpose of ratio analysis in evaluating financial reports.
Question 3
Which of the following is a potential red flag when assessing the quality of financial reports?
A) Consistent application of accounting principles over time
B) Unexplained fluctuations in revenue and expenses
C) Detailed and clear management discussion and analysis
D) Adherence to relevant accounting standards
Correct Answer: B) Unexplained fluctuations in revenue and expenses.
Explanation: Unexplained fluctuations in revenue and expenses can signal potential issues such as accounting irregularities, mismanagement, or financial manipulation. When significant changes occur without clear justification or context in the financial reports, it raises concerns about the reliability and quality of the information presented. In contrast, consistent application of accounting principles (Option A), detailed management analysis (Option C), and adherence to standards (Option D) are indicators of high-quality financial reporting.

