Evaluating Regression Model Fit and Interpreting Model Results

- Notes
For CFA Level 2 candidates, understanding how to evaluate the fit of a regression model and interpret its results is essential. This proficiency aids in assessing the accuracy and effectiveness of models used in financial forecasting and decision-making, crucial for the Quantitative Methods section of the exam.
Learning Objective
In studying “Evaluating Regression Model Fit and Interpreting Model Results” for the CFA exam, you should aim to master the techniques for assessing the goodness of fit of a regression model and learn the skills to interpret and communicate the results effectively. This includes understanding key metrics such as R-squared, adjusted R-squared, F-statistic, and p-values, and recognizing their implications in real-world financial analysis. Additionally, you’ll explore how to utilize diagnostic plots and tests to validate model assumptions and identify potential issues like heteroscedasticity, autocorrelation, and multicollinearity.
1. Goodness of Fit
- R-squared (R²): Measures the proportion of the total variation in the dependent variable that is explained by the independent variables.
- Adjusted R-squared: Adjusts the R² for the number of predictors in the model, providing a more accurate measure when comparing models with different numbers of independent variables.
2. Model Significance
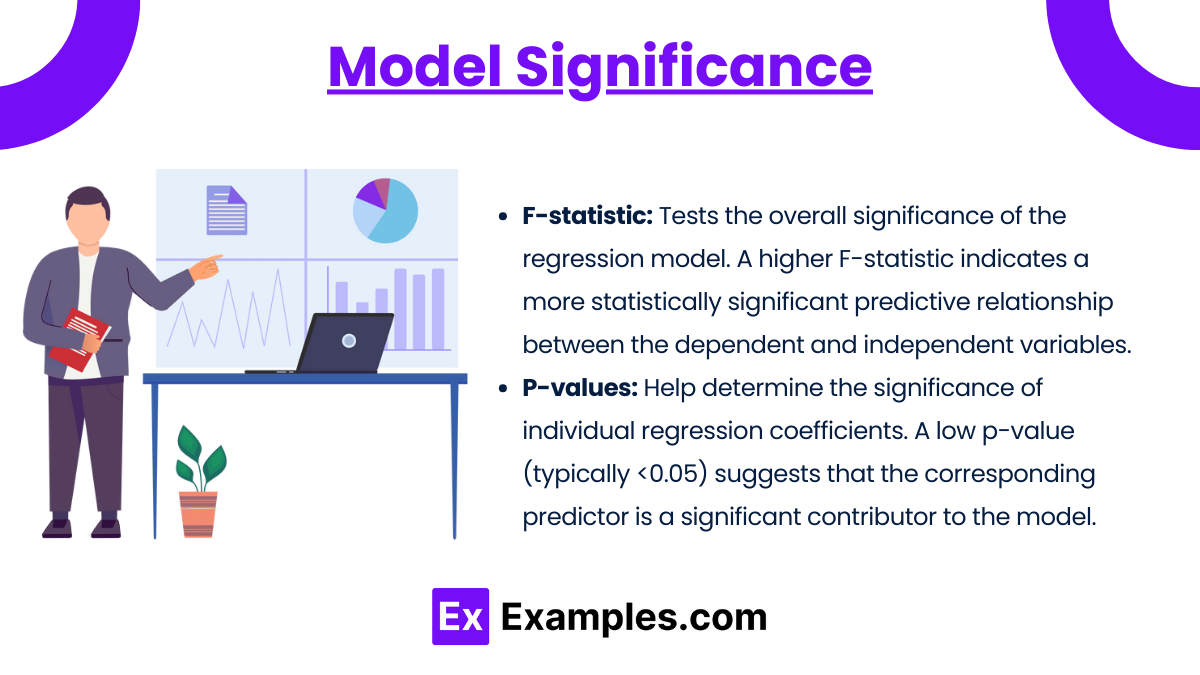
- F-statistic: Tests the overall significance of the regression model. A higher F-statistic indicates a more statistically significant predictive relationship between the dependent and independent variables.
- P-values: Help determine the significance of individual regression coefficients. A low p-value (typically <0.05) suggests that the corresponding predictor is a significant contributor to the model.
3. Diagnostics for Model Assumptions
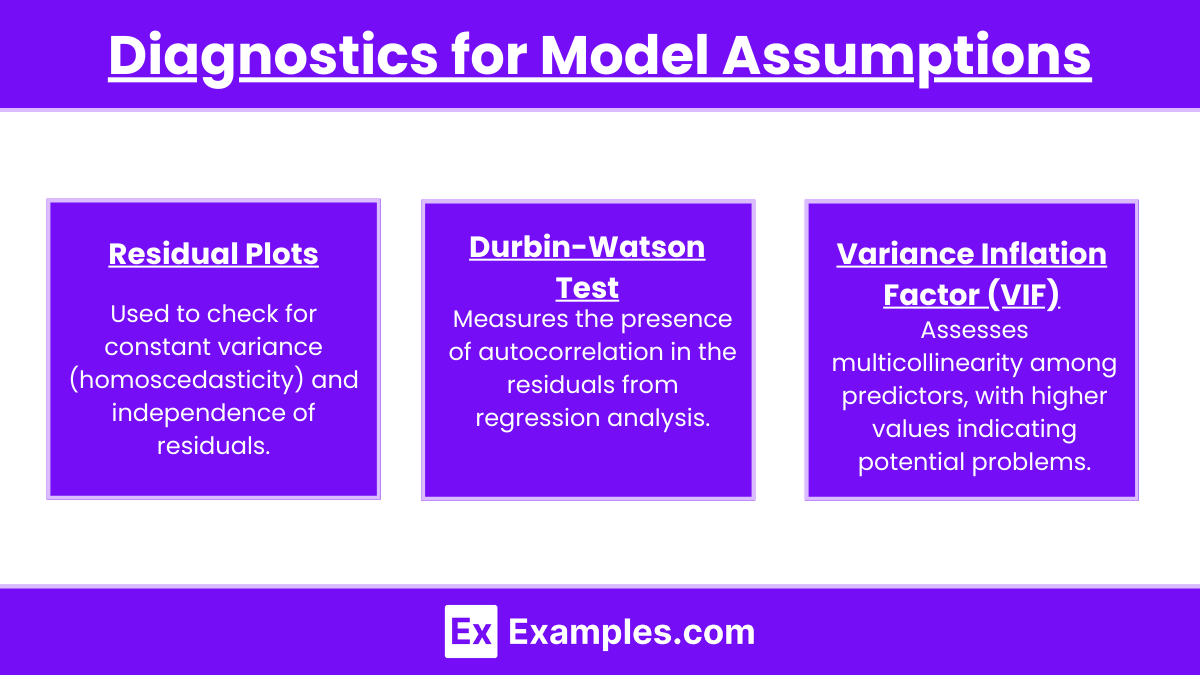
- Residual Plots: Used to check for constant variance (homoscedasticity) and independence of residuals.
- Durbin-Watson Test: Measures the presence of autocorrelation in the residuals from regression analysis.
- Variance Inflation Factor (VIF): Assesses multicollinearity among predictors, with higher values indicating potential problems.
4. Interpretation of Results

- Coefficient Interpretation: Discusses how a unit change in the independent variables affects the dependent variable, considering other predictors remain constant.
- Model Utility: Evaluates whether the regression model provides useful insights for making financial decisions.
Examples
Example 1: Analyzing R-Squared in Financial Modeling
- An analyst evaluates a regression model that predicts stock performance based on economic indicators. An R-squared value of 0.85 suggests that 85% of the variability in stock returns is explained by the model, indicating a strong fit.
Example 2: Importance of Adjusted R-Squared
- Comparing two models, one with an R-squared of 0.80 and five predictors, and another with an R-squared of 0.79 but only three predictors. The adjusted R-squared values show which model more efficiently utilizes its predictors.
Example 3: Interpreting P-Values in Regression Analysis
- A model uses GDP growth, unemployment rates, and consumer confidence to predict market demand. A p-value of 0.03 for GDP growth suggests it is a significant predictor of market demand.
Example 4: Using F-Statistic to Evaluate Model Significance
- A regression model with an F-statistic of 10.76 significantly predicts real estate prices based on location, size, and condition, indicating the model’s reliability in predicting prices.
Example 5: Diagnosing Multicollinearity with VIF
- In a regression analysis assessing the impact of marketing spend on sales, high VIF values for overlapping advertising channels suggest multicollinearity, which may require model adjustment.
Practice Questions
Question 1:
What does a high R-squared value indicate about a regression model?
A) The model explains a small portion of the variance in the dependent variable.
B) The model explains none of the variance in the dependent variable.
C) The model explains a large portion of the variance in the dependent variable.
D) The model is overfit to the data.
Answer: C) The model explains a large portion of the variance in the dependent variable.
Explanation: A high R-squared value indicates that a large proportion of the variance in the dependent variable is explained by the independent variables included in the model, suggesting the model has a good fit.
Question 2:
Which statistic would you use to test for autocorrelation in the residuals of a regression model?
A) R-squared
B) F-statistic
C) Durbin-Watson
D) VIF
Answer: C) Durbin-Watson
Explanation: The Durbin-Watson statistic is used to detect the presence of autocorrelation in the residuals of a regression model. Values significantly different from 2 suggest autocorrelation.
Question 3:
Why is adjusted R-squared considered more reliable than R-squared when comparing regression models with different numbers of predictors?
A) It increases as more predictors are added to the model.
B) It only accounts for the variation explained by the independent variables.
C) It adjusts for the number of predictors in the model, preventing overestimation of the model fit.
D) It decreases as the sample size decreases.
Answer: C) It adjusts for the number of predictors in the model, preventing overestimation of the model fit.
Explanation: Adjusted R-squared is considered more reliable because it adjusts the R-squared value to account for the number of predictors in the model, which helps to prevent the overestimation of the model’s explanatory power that can occur with R-squared as more predictors are added.

