Hypothesis testing is a crucial statistical tool in the CFA curriculum, enabling analysts to make informed decisions about financial data and trends. It involves formulating and evaluating assumptions about population parameters using sample data, helping determine if observed differences or relationships are statistically significant. By understanding hypothesis testing methods—such as t-tests, z-tests, and chi-square tests—CFA candidates can assess investment strategies, validate financial models, and interpret risk metrics. Mastering hypothesis testing allows for confident, data-driven decisions in complex financial environments, an essential skill for CFA exam success.
Learning Objectives
In studying " Hypothesis Testing " for the CFA, you should learn to formulate and test hypotheses about financial data, applying statistical tools to evaluate assumptions about populations based on sample data. Understand the purpose and application of hypothesis tests, including t-tests, z-tests, chi-square tests, and F-tests, to compare means, variances, and relationships. Analyze the concepts of null and alternative hypotheses, p-values, and significance levels, and evaluate the implications of Type I and Type II errors. Additionally, interpret test results to make informed investment decisions, assess market trends, and evaluate financial claims in practical CFA scenarios.
Introduction to Hypothesis Testing
Hypothesis testing is a statistical method used to evaluate assumptions about a population parameter based on sample data, allowing analysts to make inferences and draw conclusions. By setting up a null hypothesis (H₀) and an alternative hypothesis (H₁), hypothesis testing determines if there’s enough evidence to reject H₀ in favor of H₁. Key concepts include significance levels, p-values, and the risks of Type I and Type II errors. In finance, hypothesis testing supports data-driven decisions, enabling professionals to assess investment strategies, market behaviors, and financial models with confidence and rigor.
Key Terms and Concepts
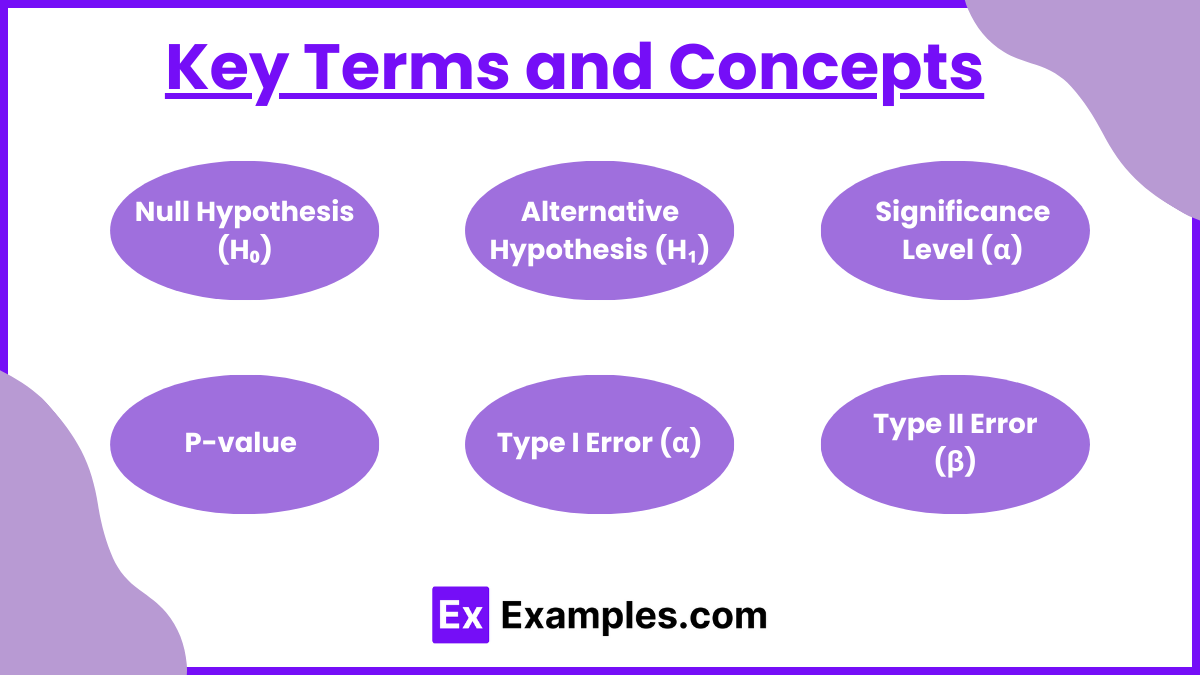
Null Hypothesis (H₀): Represents a statement of no effect or no difference. It’s the hypothesis that analysts aim to test. Typically, H₀ posits that a parameter is equal to a certain value (e.g., μ = μ₀).
Alternative Hypothesis (H₁): Indicates the presence of an effect or a difference. It’s accepted if there is enough evidence to reject H₀.
One-sided hypothesis: Tests for a deviation in one direction (greater or less than a certain value).
Two-sided hypothesis: Tests for a deviation in both directions (not equal to a certain value).
Significance Level (α): The probability threshold for rejecting H₀. Common α values are 0.05 or 0.01, representing a 5% or 1% chance of incorrectly rejecting H₀.
P-value: The probability of obtaining a test result at least as extreme as the one observed, assuming that H₀ is true. A smaller p-value indicates stronger evidence against H₀.
Type I Error (α): Incorrectly rejecting a true null hypothesis.
Type II Error (β): Failing to reject a false null hypothesis.
Steps in Hypothesis Testing
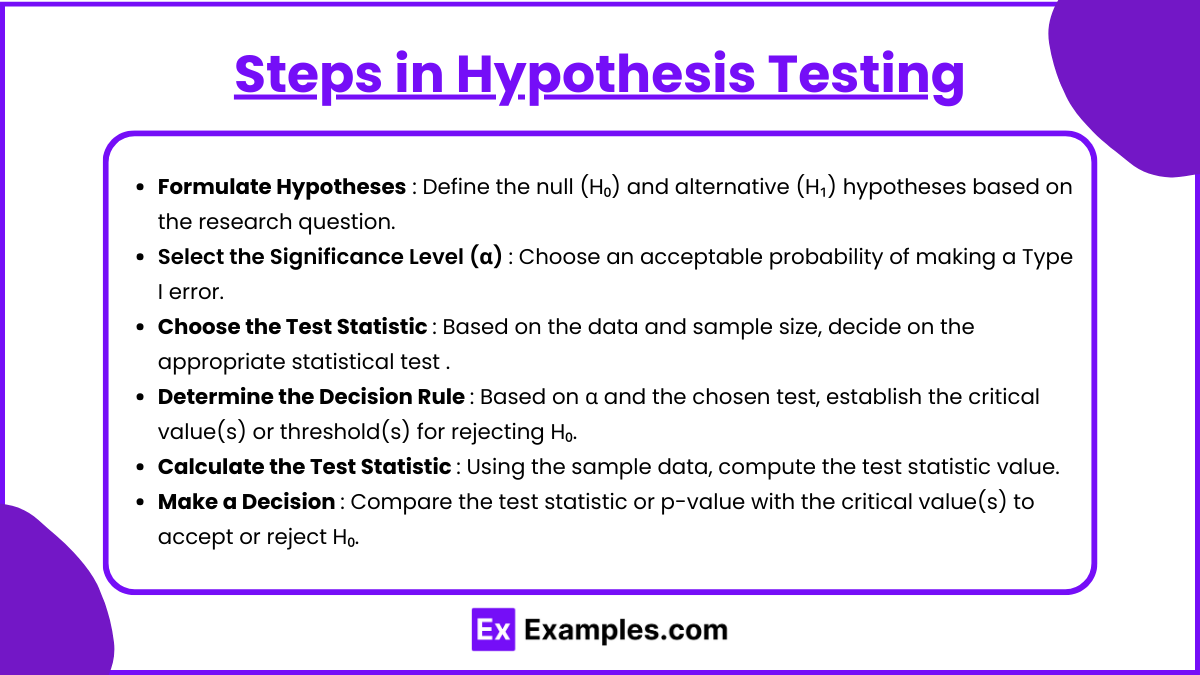
Formulate Hypotheses: Define the null (H₀) and alternative (H₁) hypotheses based on the research question.
Select the Significance Level (α): Choose an acceptable probability of making a Type I error.
Choose the Test Statistic: Based on the data and sample size, decide on the appropriate statistical test (z-test, t-test, chi-square test, etc.).
Determine the Decision Rule: Based on α and the chosen test, establish the critical value(s) or threshold(s) for rejecting H₀.
Calculate the Test Statistic: Using the sample data, compute the test statistic value.
Make a Decision: Compare the test statistic or p-value with the critical value(s) to accept or reject H₀.
Common Hypothesis Tests
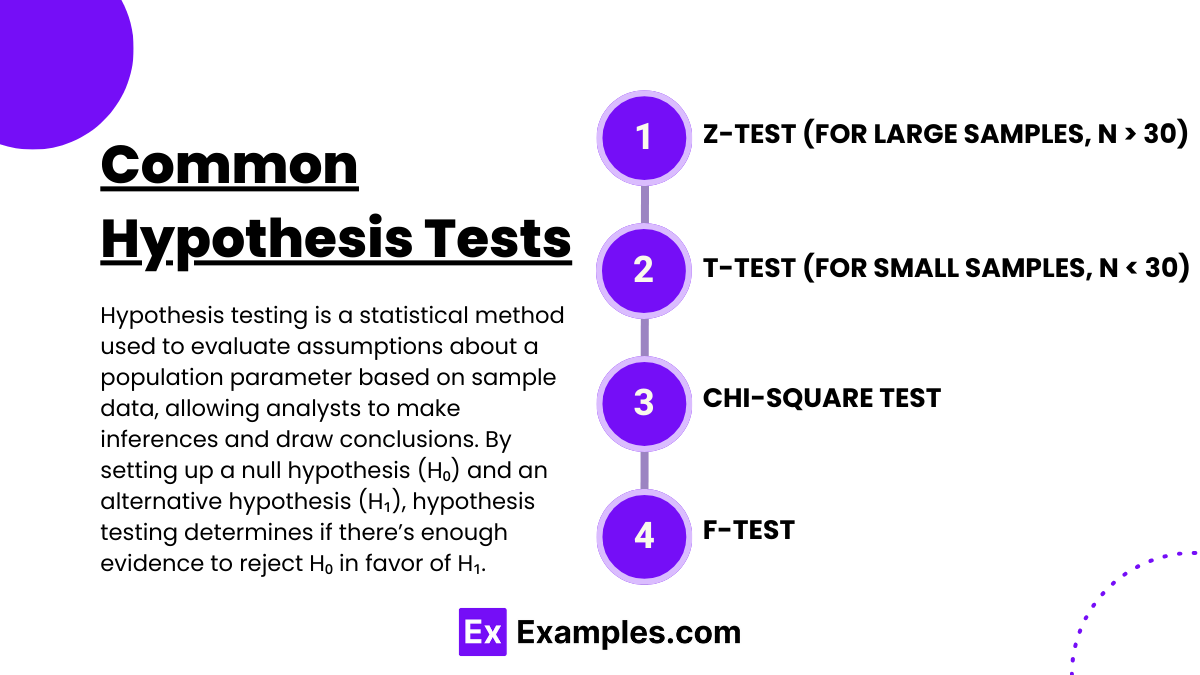
Z-Test (for large samples, n > 30): Used when the sample size is large and the population variance is known.
T-Test (for small samples, n < 30): Used when the sample size is small, and the population variance is unknown.
Chi-Square Test: Evaluates the association between categorical variables or the goodness-of-fit for a distribution.
F-Test: Compares two variances to assess whether they are significantly different.
Examples
Example 1: Testing Portfolio Returns Against a Benchmark
Suppose a portfolio manager claims their portfolio’s average annual return exceeds the S&P 500 benchmark return of 8%. To test this claim, a two-sided hypothesis test is set up where the null hypothesis (H₀) is that the portfolio return equals 8%, and the alternative hypothesis (H₁) is that the portfolio return is different from 8%. A t-test can be used to compare the sample mean return of the portfolio over several years against the benchmark. If the test statistic is significantly greater than the critical value, H₀ is rejected, supporting the manager’s claim.
Example 2: Evaluating a Bond’s Yield Stability Over Time
A fixed-income analyst wants to test if the average yield of a particular bond has remained consistent over the past five years. The null hypothesis (H₀) states that the mean yield is stable (no change over time), while the alternative hypothesis (H₁) suggests that the yield has changed. Using a paired sample t-test, the analyst compares the yields from two different time periods. If the resulting p-value is below the chosen significance level (α), H₀ is rejected, indicating that the yield has statistically changed over the period.
Example 3: Comparing Fund Volatility Between Two Funds
Suppose an investor is comparing two mutual funds to determine if their volatilities (measured by standard deviation of returns) are significantly different. The null hypothesis (H₀) assumes there is no difference in volatility between the two funds, while the alternative hypothesis (H₁) suggests a difference exists. An F-test is employed to compare the variances of the two funds’ returns. If the F-test statistic exceeds the critical value, H₀ is rejected, implying that one fund is more volatile than the other, providing valuable insights for risk assessment.
Example 4: Testing Economic Indicator’s Impact on Stock Prices
An economist hypothesizes that changes in interest rates impact stock prices, with a specific focus on the banking sector. Here, the null hypothesis (H₀) would state that interest rate changes have no effect on banking stock prices, and the alternative hypothesis (H₁) suggests an effect exists. A regression analysis is performed to test the relationship between interest rate changes and banking stock returns, where the p-value of the coefficient for interest rates determines the validity of H₀. If the p-value is low, H₀ is rejected, indicating a significant relationship between interest rates and stock prices.
Example 5: Evaluating Alpha Generation of an Active Portfolio
An asset manager claims that their active portfolio generates positive alpha, meaning the portfolio outperforms its expected return based on the Capital Asset Pricing Model (CAPM). The null hypothesis (H₀) is that the portfolio’s alpha is zero, while the alternative hypothesis (H₁) suggests a positive alpha. A one-sample t-test is used to compare the portfolio’s actual returns to the expected returns predicted by CAPM. If the p-value is lower than the selected significance level, H₀ is rejected, supporting the manager’s claim of consistent outperformance.
Practice Questions
Question 1
A financial analyst wants to determine if the average return of a mutual fund over the last 10 years is different from the market return of 7%. The sample of annual returns has a mean of 8% and a standard deviation of 4%. Assuming a sample size of 10, which of the following hypothesis tests should the analyst use?
A. Z-test for means
B. Paired t-test
C. One-sample t-test
D. Chi-square test
Answer: C. One-sample t-test
Explanation: Since the sample size is small (n < 30) and the population standard deviation is unknown, the appropriate test to use here is the one-sample t-test. The one-sample t-test is used to compare the sample mean to a known population mean when the sample size is small and the standard deviation of the population is unknown. A Z-test would only be appropriate if the sample size were large or if the population standard deviation were known. A paired t-test is used when comparing two related groups, which is not the case here. A chi-square test is used for categorical data, which does not apply to this scenario.
Question 2
An investor wants to test if a particular stock has a different mean return compared to a benchmark index. She sets up the hypothesis as follows:
Null Hypothesis (H₀): The mean return of the stock is equal to the benchmark return.
Alternative Hypothesis (H₁): The mean return of the stock is different from the benchmark return.
If she chooses a significance level of 0.05, what does this imply?
A. There is a 5% chance of incorrectly rejecting the null hypothesis if it is true.
B. There is a 95% probability that the null hypothesis is false.
C. There is a 5% chance that the null hypothesis is true.
D. There is a 95% chance of accepting the null hypothesis if it is true.
Answer: A. There is a 5% chance of incorrectly rejecting the null hypothesis if it is true.
Explanation: The significance level (α) of 0.05 implies that there is a 5% probability of making a Type I error, which is the error of rejecting a true null hypothesis. In this case, setting a 0.05 significance level means the investor is willing to accept a 5% risk of incorrectly concluding that the stock’s mean return differs from the benchmark when, in fact, it does not. This does not imply a 95% probability that the null hypothesis is false, nor does it imply any probability about the null hypothesis being true or false. The significance level is only about the risk of rejecting the null hypothesis when it is actually correct.
Question 3
A portfolio manager believes that his actively managed portfolio has generated an alpha greater than zero. He sets up his hypothesis test as follows:
Null Hypothesis (H₀): Alpha = 0
Alternative Hypothesis (H₁): Alpha > 0
If his test results in a p-value of 0.03, which of the following statements is correct at a 0.05 significance level?
A. The null hypothesis cannot be rejected.
B. The null hypothesis should be rejected.
C. There is a 3% chance that the null hypothesis is true.
D. There is a 5% probability of a Type II error.
Answer: B. The null hypothesis should be rejected.
Explanation: When the p-value (0.03) is less than the significance level (0.05), we reject the null hypothesis. This indicates that there is sufficient statistical evidence to support the alternative hypothesis that the portfolio’s alpha is greater than zero, suggesting the portfolio has outperformed. The statement in option C is incorrect because a p-value does not represent the probability that the null hypothesis is true. Instead, it represents the probability of obtaining a result as extreme as the observed one, assuming the null hypothesis is true. Option D is incorrect because the Type II error probability (β) relates to failing to reject a false null hypothesis, not to the significance level or p-value in this case.

