Integration of Financial Statement Analysis Techniques is essential for a comprehensive understanding of a company’s financial health and performance. This topic combines various analytical methods, including ratio analysis, trend analysis, and cash flow assessment, to evaluate financial statements holistically. It emphasizes the interconnectedness of income statements, balance sheets, and cash flow statements, providing insights into profitability, liquidity, and solvency. Mastering these techniques enables analysts to make well-rounded investment and valuation decisions, equipping them with a robust foundation for assessing company fundamentals and identifying potential financial strengths and risks.
Learning Objectives
In studying “Integration of Financial Statement Analysis Techniques” for the CFA, you should learn to integrate various financial statement analysis tools to evaluate a company’s financial health comprehensively. Understand how to apply ratio analysis, trend analysis, and common-size financial statements to assess profitability, liquidity, solvency, and efficiency. Analyze interconnections between the income statement, balance sheet, and cash flow statement to identify underlying financial dynamics. Evaluate the impact of accounting choices and adjustments on financial statements and their implications for comparability. Additionally, develop skills to synthesize these analytical techniques to form well-rounded insights and make informed investment decisions, forecasting potential risks and opportunities in a company’s financial position.
Comprehensive Evaluation of Financial Health

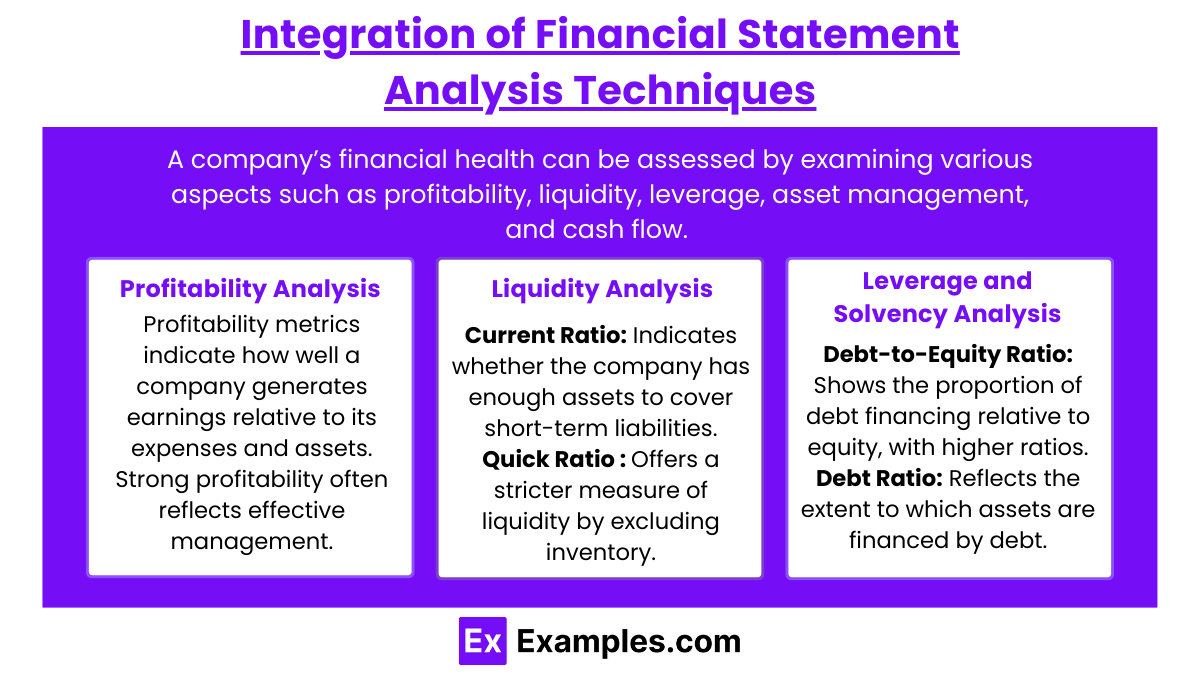
A company’s financial health can be assessed by examining various aspects such as profitability, liquidity, leverage, asset management, and cash flow. These elements offer a full picture of how effectively a company is managing its resources, meeting obligations, and generating returns for stakeholders. Here’s a breakdown of key areas to consider without involving specific calculations.
1. Profitability Analysis
Profitability metrics indicate how well a company generates earnings relative to its expenses and assets. Strong profitability often reflects effective management, competitive positioning, and growth potential. Key indicators include:
- Gross Profit Margin: Shows the company’s efficiency in managing production or service costs relative to sales.
- Operating Profit Margin: Indicates how well the company controls operating expenses, revealing operational efficiency.
- Net Profit Margin: Provides insight into overall profitability after all costs and taxes, indicating the bottom-line success.
- Return on Assets (ROA): Reflects the company’s efficiency in utilizing its assets to generate profit.
- Return on Equity (ROE): Measures how effectively the company is generating returns for its shareholders.
Example: A company with high net profit and ROE demonstrates effective cost management and profitable use of shareholder investments.
2. Liquidity Analysis
Liquidity ratios assess the company’s ability to meet short-term obligations, which is essential for maintaining operational stability. Key measures include:
- Cash Ratio: Provides the most conservative liquidity assessment, focusing only on cash and equivalents relative to liabilities.
Example: A high current ratio with a low quick ratio may suggest an over-reliance on inventory to cover liabilities, which could present a liquidity risk if inventory turnover is slow.
3. Leverage and Solvency Analysis
Leverage ratios highlight the company’s reliance on debt, indicating financial risk and long-term stability. Important considerations include:
- Debt-to-Equity Ratio: Shows the proportion of debt financing relative to equity, with higher ratios indicating greater leverage and risk exposure.
- Debt Ratio: Reflects the extent to which assets are financed by debt, giving insight into the company’s risk profile.
- Interest Coverage Ratio: Assesses the company’s ability to meet interest payments comfortably, which is crucial for evaluating debt sustainability.
- Equity Multiplier: Indicates the degree of financial leverage by showing how much of the company’s assets are financed by equity.
Example: A high debt-to-equity ratio combined with a low interest coverage ratio may reveal financial vulnerability, especially if the company struggles to meet debt obligations.
Trend Analysis for Tracking Financial Performance Over Time

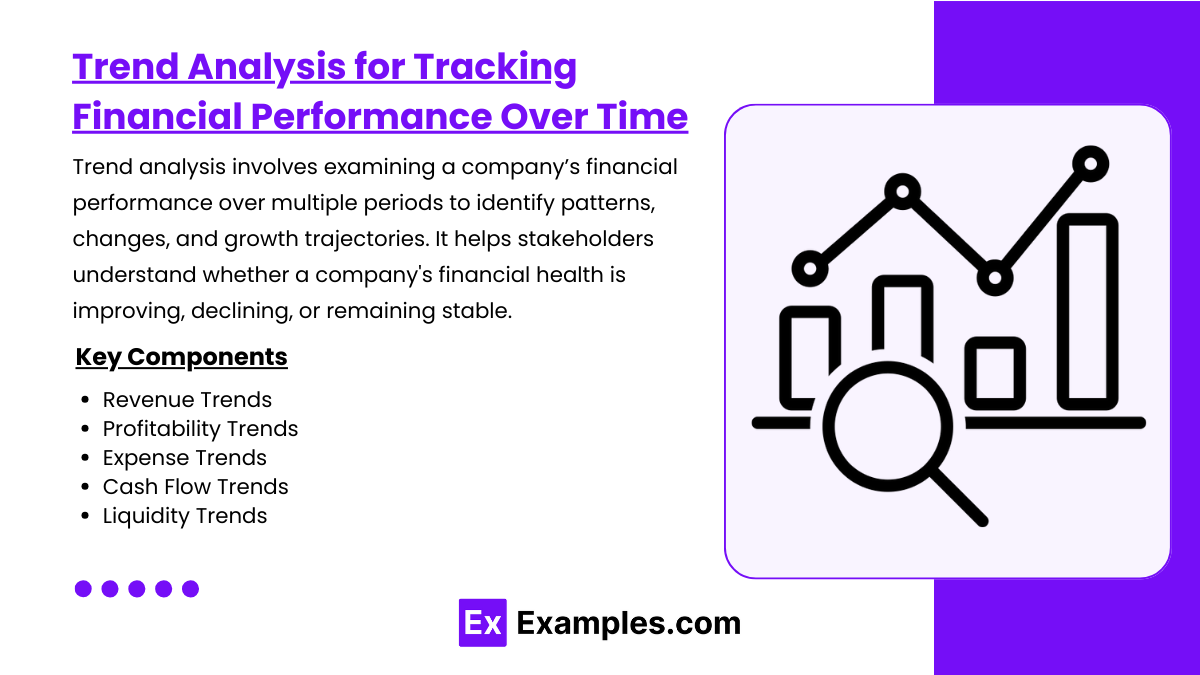
Trend analysis involves examining a company’s financial performance over multiple periods to identify patterns, changes, and growth trajectories. It helps stakeholders understand whether a company’s financial health is improving, declining, or remaining stable. By analyzing trends, investors, managers, and analysts can make informed decisions and anticipate future performance. Here are key areas to consider in a comprehensive trend analysis.
1. Revenue Trends
Revenue trends reveal growth patterns in sales and help assess the company’s market position, demand consistency, and pricing strategy effectiveness.
- Year-over-Year (YoY) Revenue Growth: Tracking revenue growth each year helps determine if the company is expanding its sales base consistently.
- Quarterly Revenue Trends: Examining seasonal or quarterly revenue patterns can reveal demand fluctuations, important for planning and resource allocation.
- Revenue Composition: Analyzing the breakdown of revenue by product line, geographic region, or customer segment helps identify the sources of growth and potential dependencies.
Example: A company with steady YoY revenue growth signals strong demand, while declining revenue over time may indicate competitive pressures or market challenges.
2. Profitability Trends
Tracking profitability trends shows how efficiently a company manages expenses relative to its income and how well it converts revenue into profit.
- Gross Profit Margin Trends: Analyzing gross margins over time reveals changes in production costs or pricing strategies. Increasing margins may reflect cost efficiencies or pricing power.
- Operating Margin Trends: Fluctuations in operating margins can signal changes in operating expenses or shifts in cost management effectiveness.
- Net Profit Margin Trends: Stable or increasing net profit margins show strong overall profitability, while decreasing margins may indicate rising costs or decreased efficiency.
Example: A tech company with consistently improving gross and operating margins demonstrates strong cost management, potentially benefiting from economies of scale as it grows.
3. Expense Trends
Examining expense trends provides insight into how well a company manages its costs relative to its growth.
- Cost of Goods Sold (COGS) Trends: Monitoring COGS relative to revenue shows if production costs are stable, rising, or decreasing, which affects profitability.
- Operating Expense Trends: Tracking trends in selling, general, and administrative (SG&A) expenses helps assess whether overhead costs align with revenue growth.
- Interest Expense Trends: Analyzing interest expenses over time can reveal changes in debt levels and the company’s reliance on financing.
Example: A company with increasing SG&A expenses without a proportional increase in revenue may need to improve its cost control to maintain profitability.
4. Cash Flow Trends
Cash flow trends highlight the company’s ability to generate and manage cash over time, essential for sustainability and growth.
- Operating Cash Flow Trends: Positive and growing cash flow from operations over time indicates a strong, sustainable business.
- Free Cash Flow Trends: Analyzing trends in free cash flow, after capital expenditures, reveals the company’s ability to fund growth initiatives and return value to shareholders.
- Cash Flow Conversion: Comparing cash flow trends with net income trends provides insight into earnings quality and whether reported profits translate into cash.
Example: A company with steadily growing operating cash flow and free cash flow demonstrates a solid financial foundation, with ample cash to support future investments.
5. Liquidity Trends
Liquidity trends reveal the company’s ability to meet its short-term obligations and manage working capital effectively.
- Current Ratio Trends: An increasing current ratio suggests improved liquidity, while a declining ratio may signal potential cash flow challenges.
- Quick Ratio Trends: Monitoring the quick ratio over time provides a view of the company’s short-term liquidity without relying on inventory, valuable for assessing liquidity in industries with slow inventory turnover.
- Working Capital Trends: Examining trends in working capital shows how well the company manages its receivables, payables, and inventory in line with sales growth.
Example: A steadily increasing quick ratio reflects strong short-term liquidity, whereas a downward trend in working capital may indicate over-reliance on credit or difficulty collecting receivables.
Common-Size Financial Statements for Comparative Analysis

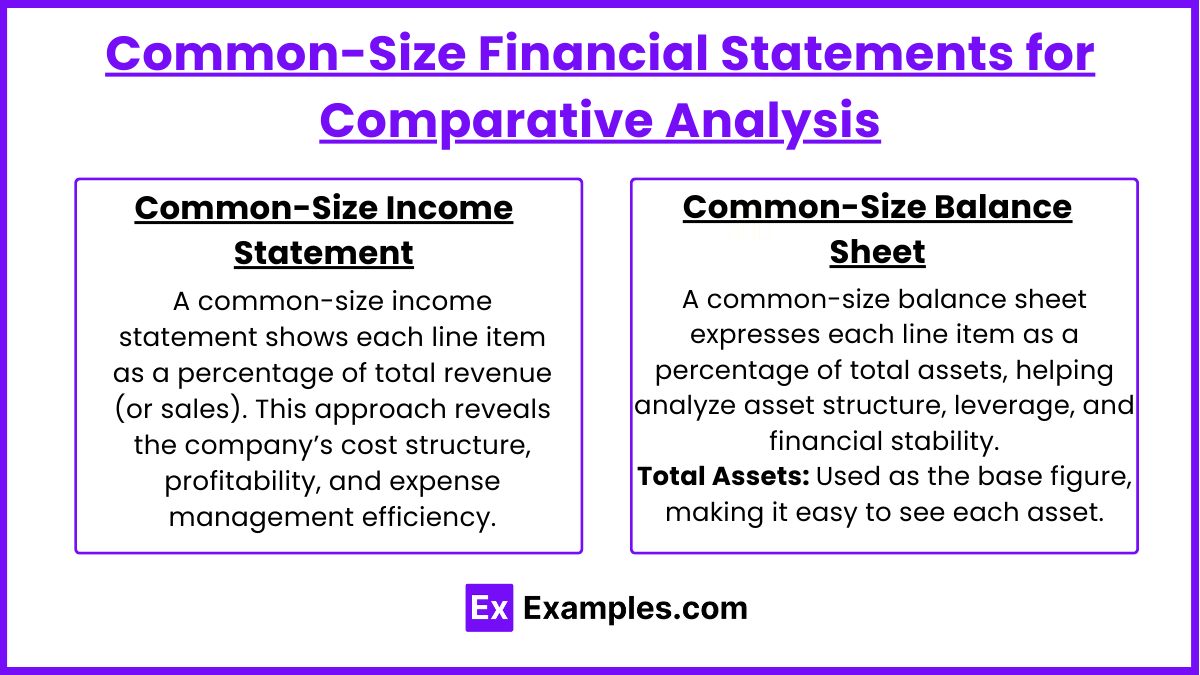
Common-size financial statements express each line item as a percentage of a base figure, enabling easier comparison across time periods, companies, or industries. This format provides insights into financial structure, performance, and trends by standardizing values, making it especially useful for benchmarking and trend analysis. Here’s how common-size financial statements are structured and how they can be applied in a comparative analysis.
1. Common-Size Income Statement
A common-size income statement shows each line item as a percentage of total revenue (or sales). This approach reveals the company’s cost structure, profitability, and expense management efficiency.
- Revenue: Set as the base figure (100%), allowing other items to be expressed relative to sales.
- Cost of Goods Sold (COGS): Expressed as a percentage of revenue, indicating the portion of sales used to cover direct production costs. A higher COGS percentage may reflect lower gross profitability.
- Gross Profit: Calculated as a percentage of revenue, showing the remaining income after covering COGS. A higher gross margin suggests strong pricing power and production efficiency.
- Operating Expenses: Includes items like selling, general, and administrative (SG&A) expenses. Expressed as a percentage of revenue, it helps assess operational efficiency.
- Operating Income: Operating profit as a percentage of revenue shows the company’s core profitability before non-operating items.
- Net Income: Indicates the final profit after all expenses and taxes, giving insight into the overall profitability of the company.
Example: Comparing the net income margin between two companies in the same industry can reveal which company is more efficient at converting sales into profit, providing insight into cost control and pricing strategies.
2. Common-Size Balance Sheet
A common-size balance sheet expresses each line item as a percentage of total assets, helping analyze asset structure, leverage, and financial stability.
- Total Assets: Used as the base figure (100%), making it easy to see each asset category’s contribution to the total.
- Current Assets: Expressed as a percentage of total assets, providing insight into liquidity and working capital management. High current assets might indicate strong short-term flexibility.
- Non-Current Assets: Shows the portion of total assets tied up in long-term investments, such as property, plant, and equipment (PP&E). A high percentage in non-current assets may indicate capital intensity.
- Current Liabilities: As a percentage of total assets, this ratio reveals the proportion of assets financed by short-term obligations, impacting liquidity.
- Long-Term Liabilities: Shows the percentage of assets financed by long-term debt, reflecting leverage and financial risk.
- Shareholders’ Equity: Indicates the portion of assets financed by equity rather than debt, giving insight into capital structure and financial risk.
Example: By comparing the percentage of assets financed by debt across companies, analysts can gauge relative leverage levels, helping assess financial risk and stability.
Interconnections Between Financial Statements

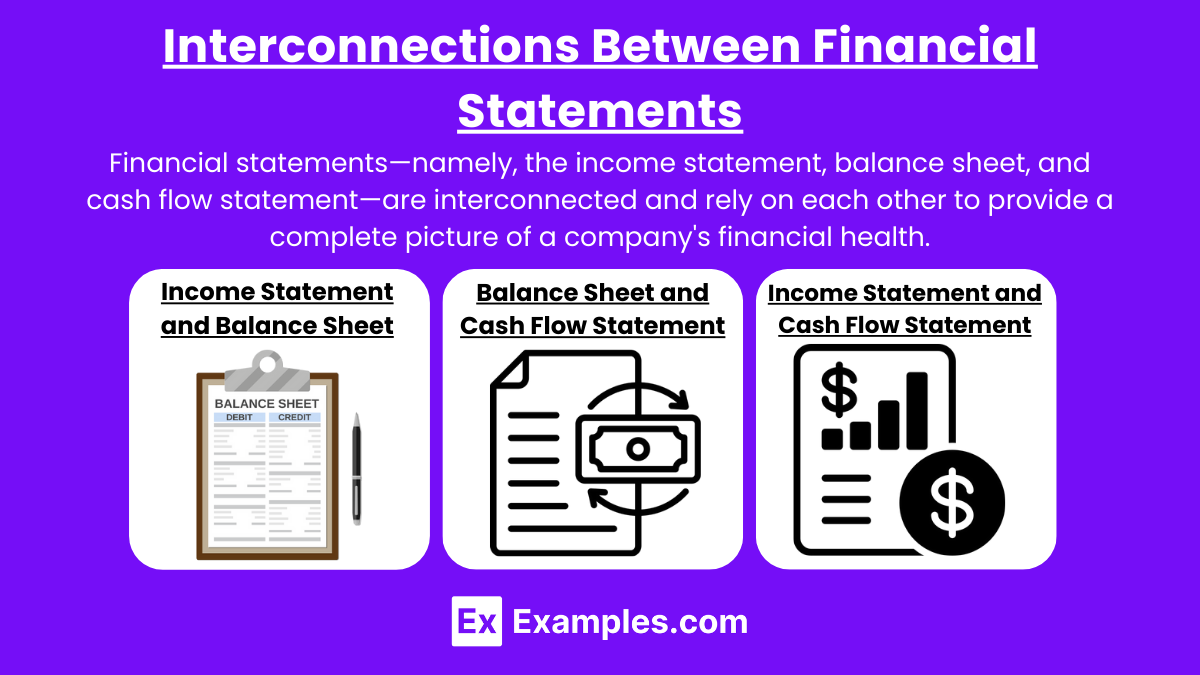
Financial statements—namely, the income statement, balance sheet, and cash flow statement—are interconnected and rely on each other to provide a complete picture of a company’s financial health. These connections illustrate how financial performance flows through each statement, impacting the company’s assets, liabilities, cash, and equity. Understanding these links is essential for accurately analyzing financial data and making sound financial decisions.
1. Income Statement and Balance Sheet
The income statement and balance sheet are closely linked, with the income statement driving changes in certain balance sheet accounts.
- Net Income and Retained Earnings: The net income from the income statement flows into retained earnings on the balance sheet. If the company has a positive net income, it increases retained earnings, while a net loss decreases it. This link shows how profits or losses affect shareholders’ equity over time.
- Depreciation and Fixed Assets: Depreciation expense is recorded on the income statement, reducing the book value of fixed assets on the balance sheet. Accumulated depreciation is reflected as a contra-asset on the balance sheet, impacting the net value of fixed assets.
- Inventory and Cost of Goods Sold (COGS): The beginning and ending inventory balances on the balance sheet affect the cost of goods sold calculation on the income statement. A change in inventory levels impacts COGS, and therefore, net income.
- Accounts Receivable and Revenue: When revenue is recognized but not yet collected, it creates an accounts receivable balance on the balance sheet, showing that the company is owed cash from customers.
Example: A company reports net income of $100,000 on its income statement. This amount increases retained earnings on the balance sheet, showing the growth in shareholders’ equity from profitable operations.
2. Balance Sheet and Cash Flow Statement
The balance sheet and cash flow statement are interconnected as cash flow activities (operating, investing, and financing) affect balance sheet accounts, which ultimately impact the cash position.
- Operating Activities and Working Capital: Changes in working capital accounts, such as accounts receivable, inventory, and accounts payable, impact cash flow from operating activities. For instance, an increase in accounts receivable reflects cash not yet collected, reducing cash flow from operations.
- Investing Activities and Fixed Assets: Purchases and sales of fixed assets are recorded as investing activities on the cash flow statement. These activities increase or decrease the fixed assets account on the balance sheet and impact cash.
- Financing Activities and Debt/Equity: Cash flows from financing activities reflect changes in debt and equity on the balance sheet. Issuing debt or equity increases cash, while repayments or dividends decrease it, affecting the balance sheet’s cash and equity accounts.
- Cash and Cash Equivalents: The ending cash balance from the cash flow statement flows into the balance sheet as cash and cash equivalents, reconciling the net change in cash during the period.
Example: If a company issues $50,000 in debt, this inflow appears in financing activities on the cash flow statement and increases both cash and long-term liabilities on the balance sheet.
3. Income Statement and Cash Flow Statement
The income statement and cash flow statement are linked through net income, which serves as the starting point for cash flow from operating activities.
- Net Income to Operating Cash Flow: The cash flow statement begins with net income from the income statement, adjusting for non-cash items (e.g., depreciation, amortization) and changes in working capital to calculate cash flow from operations.
- Depreciation and Amortization: These non-cash expenses reduce net income on the income statement but are added back to net income in the cash flow statement to reflect actual cash flow, as they do not affect cash.
- Gains and Losses on Asset Sales: Gains or losses on asset sales are included in net income but are subtracted from cash flow from operating activities and shown as cash inflows or outflows in investing activities, as they do not affect core operations.
Example: If a company has net income of $80,000 but includes $10,000 in depreciation expense, the cash flow statement adds back the $10,000 (since it’s non-cash) to show an operating cash flow higher than net income.
Examples
Example 1: Ratio Analysis
One key aspect of financial statement analysis is ratio analysis, where various financial ratios derived from the income statement, balance sheet, and cash flow statement are used to assess a company’s performance. For instance, combining profitability ratios (like net profit margin) with liquidity ratios (like current ratio) provides a comprehensive view of how effectively a company is generating profits while maintaining its ability to meet short-term obligations. This integration helps stakeholders evaluate the overall financial health of the company.
Example 2: Trend Analysis
By integrating trend analysis with financial statement analysis, investors can track the performance of key financial metrics over multiple periods. For example, observing trends in revenue growth alongside expense management over several years can highlight patterns in operational efficiency. This method allows analysts to identify potential future performance based on historical data and assess the sustainability of a company’s growth trajectory.
Example 3: Common-Size Financial Statements
Common-size analysis transforms financial statements into a percentage format, facilitating comparisons across companies or periods. By expressing each line item as a percentage of total revenue (in the income statement) or total assets (in the balance sheet), analysts can integrate insights about cost structures and capital allocations. For example, comparing the common-size income statements of two competitors can reveal differences in operational efficiency and profitability margins.
Example 4: Cash Flow Analysis
Integrating cash flow analysis with traditional financial statement analysis provides deeper insights into a company’s financial health. For instance, while the income statement may show strong profits, analyzing cash flows from operating activities can reveal whether those profits translate into actual cash generation. This integration is crucial for assessing the company’s ability to fund operations, pay dividends, and invest in future growth.
Example 5: Financial Forecasting and Modeling
The integration of various financial statement analysis techniques is essential for creating financial models and forecasts. For example, by combining historical ratio analysis, trend analysis, and cash flow analysis, analysts can develop robust financial projections that inform strategic decisions. This process helps in predicting future revenue streams, expense patterns, and cash flow needs, ultimately guiding investment decisions and capital budgeting processes.
Practice Questions
Question 1
What is the main advantage of using common-size financial statements in analysis?
A) They provide absolute figures for comparison.
B) They simplify the assessment of financial performance across different companies.
C) They eliminate the need for ratio analysis.
D) They focus solely on cash flow metrics.
Correct Answer: B) They simplify the assessment of financial performance across different companies.
Explanation: Common-size financial statements express each line item as a percentage of a relevant total, such as total revenue or total assets. This standardization allows for easier comparison between companies of different sizes, making it simpler to assess financial performance, operational efficiency, and cost structures. Options A and D are incorrect because common-size statements focus on relative percentages rather than absolute figures and do not specifically address cash flow metrics. Option C is also incorrect, as ratio analysis can still be valuable even when using common-size statements.
Question 2
How does trend analysis complement ratio analysis in financial statement evaluation?
A) By providing a snapshot of a single period’s performance.
B) By comparing historical performance over multiple periods.
C) By focusing only on profitability ratios.
D) By eliminating seasonal fluctuations in revenue.
Correct Answer: B) By comparing historical performance over multiple periods.
Explanation: Trend analysis involves examining financial metrics over multiple periods to identify patterns, growth rates, or declines. When used alongside ratio analysis, which provides specific insights into financial health, trend analysis allows analysts to understand the trajectory of key performance indicators over time. This comprehensive view aids in making informed predictions about future performance. Option A is incorrect, as trend analysis looks at multiple periods, not just one. Option C is limiting and does not reflect the broad application of trend analysis, while option D does not accurately describe the purpose of trend analysis.
Question 3
Why is integrating cash flow analysis with financial statement analysis important?
A) It ensures compliance with accounting standards.
B) It highlights potential liquidity issues despite profitability.
C) It focuses only on operational efficiency.
D) It simplifies tax calculations.
Correct Answer: B) It highlights potential liquidity issues despite profitability.
Explanation: Integrating cash flow analysis with financial statement analysis is crucial because it provides insight into a company’s actual cash generation, which can differ from net income reported on the income statement. A company may report strong profits but face liquidity issues if cash flows from operations are weak. This integration helps stakeholders understand the company’s ability to meet obligations and invest in growth, even when profits appear healthy. Options A and D are unrelated to the primary purpose of integrating cash flow analysis, while option C is too narrow in focus.


