Big Data techniques are revolutionizing finance by enabling the analysis of vast, complex datasets that traditional methods cannot handle efficiently. These techniques, including data mining, machine learning, and natural language processing (NLP), allow financial professionals to uncover patterns, predict market trends, and make data-driven decisions. Big Data is characterized by its volume, velocity, and variety, capturing large amounts of data quickly from diverse sources. Mastery of these tools equips analysts to enhance portfolio management, improve risk assessment, and refine investment strategies in today’s data-driven environment.
Learning Objectives
In studying ” Introduction to Big Data Techniques ” for the CFA Exam, you should learn to understand the fundamental Big Data methods used in finance, including data mining, machine learning, and natural language processing (NLP). Analyze how these techniques help identify trends, assess risks, and enhance investment decisions. Evaluate the applications of Big Data, such as sentiment analysis, time series forecasting, and credit risk assessment. Additionally, explore the role of data volume, velocity, and variety in financial analytics, and apply these concepts to optimize portfolio performance and interpret market patterns in CFA-level practice scenarios.
Key Concepts in Big Data
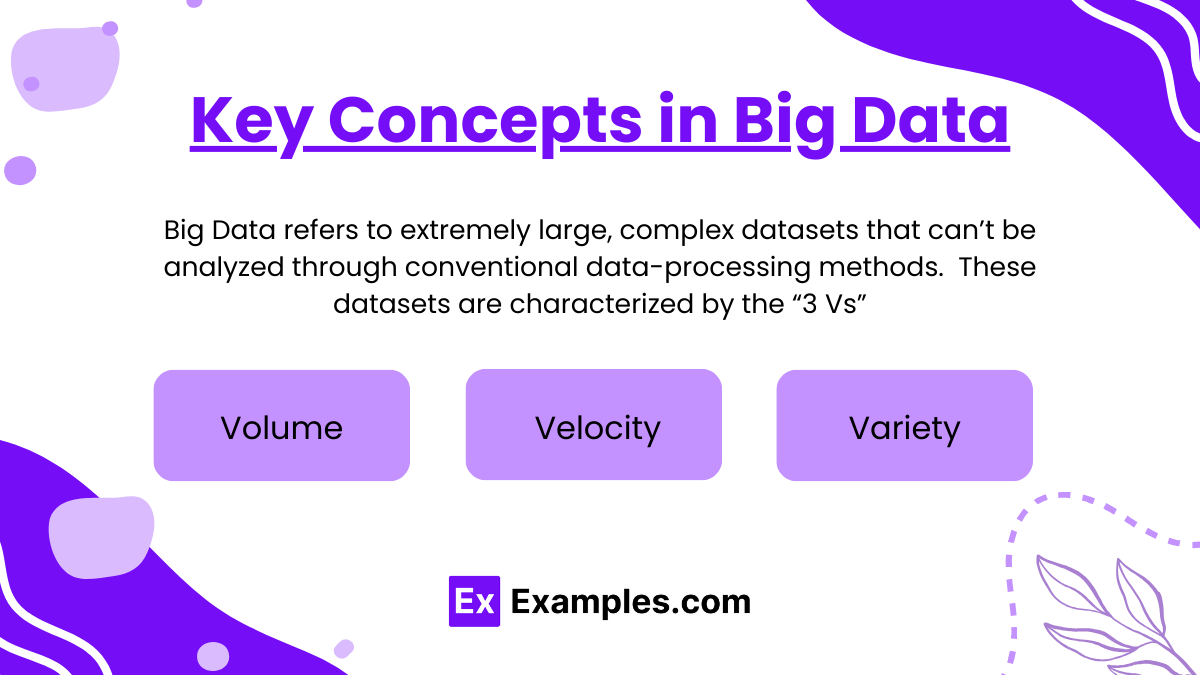
- Big Data refers to extremely large, complex datasets that can’t be analyzed through conventional data-processing methods. These datasets are characterized by the “3 Vs”:
- Volume: Massive data amounts generated from various sources (e.g., market transactions, financial reports, social media).
- Velocity: The high speed at which data is generated and must be processed to be useful.
- Variety: Data in diverse formats, such as structured (tables), semi-structured (XML), and unstructured (text, images).
- Importance of Big Data in Finance
Big Data’s role in finance has grown with advancements in technology. It enables more accurate modeling of financial markets, predictive analysis, and risk management. In portfolio management, Big Data enhances performance by providing insights from alternative data sources like social sentiment, economic indicators, and customer behavior.
Core Big Data Techniques for Financial Analysis
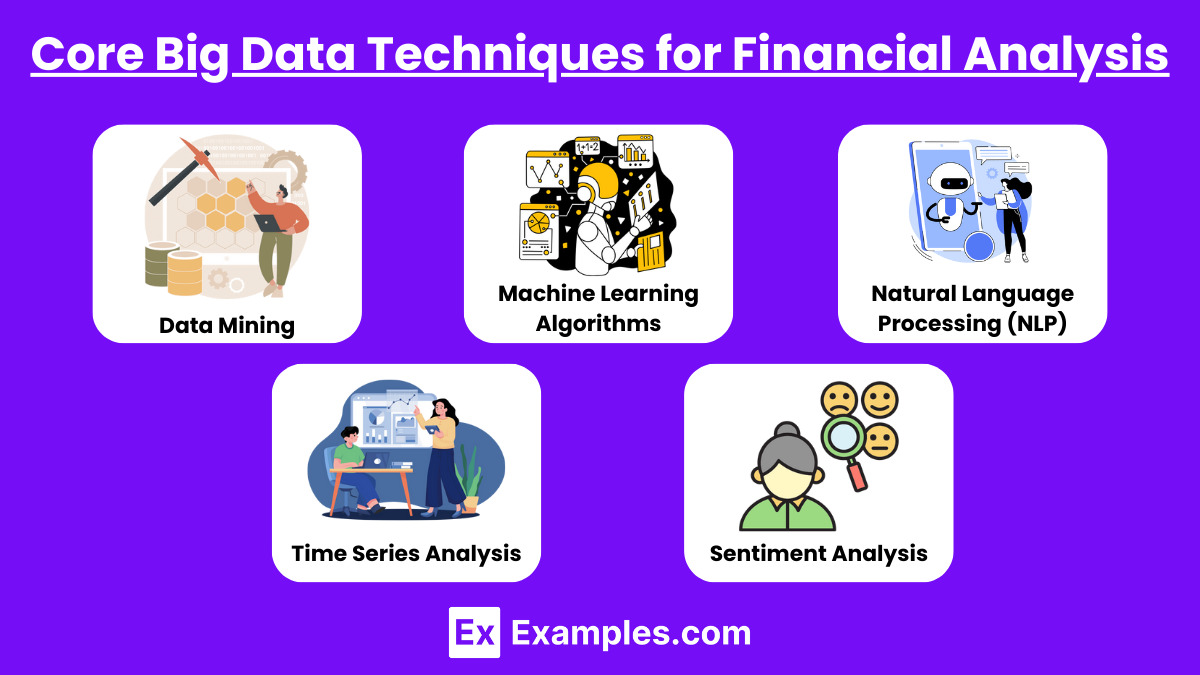
- Data Mining
Data mining involves extracting patterns and relationships from large datasets. Techniques include clustering (grouping similar data), classification (categorizing data), and association (finding links between variables). Data mining helps CFA candidates understand financial relationships, enabling insights into market behavior and investor sentiment. - Machine Learning Algorithms
Machine learning is crucial for Big Data analysis, allowing systems to learn from data without explicit programming. Two key types:- Supervised Learning: Algorithms trained on labeled data to predict outcomes. For example, predicting stock prices based on historical data.
- Unsupervised Learning: Identifies hidden patterns in unlabeled data, useful for anomaly detection and trend analysis in market data.
- Natural Language Processing (NLP)
NLP allows computers to understand and interpret human language, enabling analysis of unstructured data like news articles, financial reports, and social media posts. In finance, NLP is used for sentiment analysis, assessing the tone of financial news to gauge market sentiment and inform trading strategies. - Time Series Analysis
Time series analysis examines data points collected at consistent intervals over time, ideal for financial data like stock prices, interest rates, and economic indicators. Methods such as autoregressive integrated moving average (ARIMA) models help forecast trends, which is valuable for market predictions and risk management. - Sentiment Analysis
Sentiment analysis evaluates the emotional tone in texts like news, reports, and social media. This technique is widely used to assess market sentiment, which can impact stock prices and volatility. By leveraging sentiment analysis, CFA candidates can gain insights into how public opinion affects financial markets.
Applications of Big Data in Finance
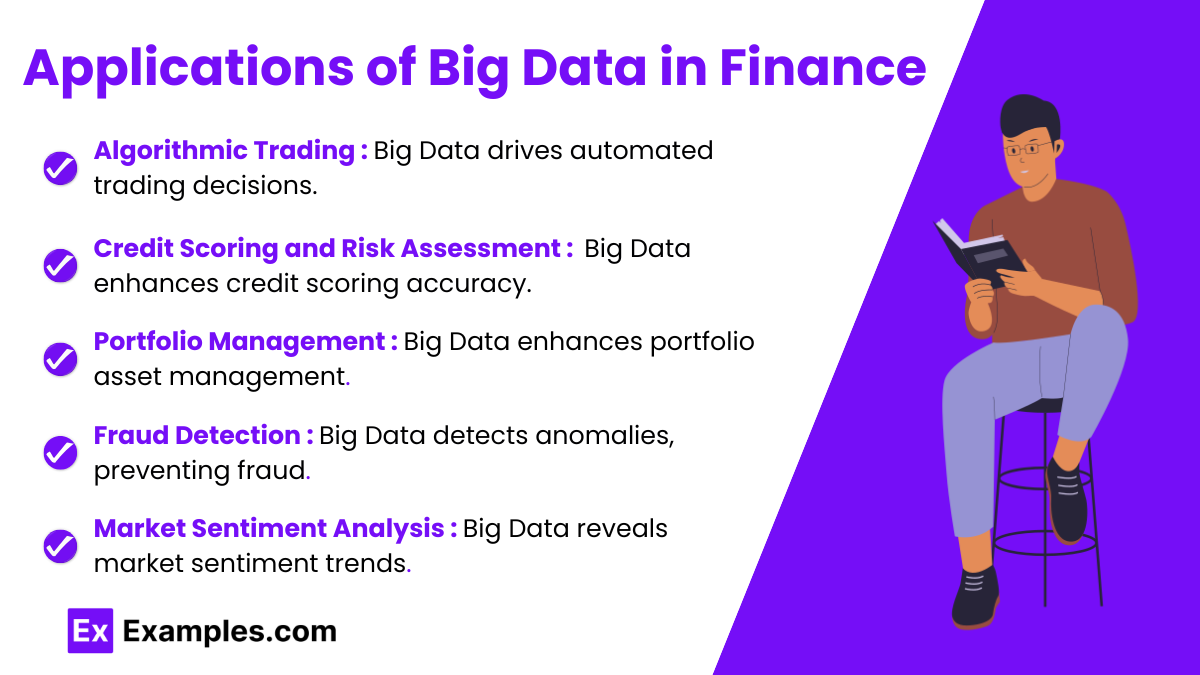
- Algorithmic Trading
Big Data powers algorithmic trading by feeding real-time data to automated systems that execute trades based on set parameters. Machine learning algorithms analyze trends and execute trades with precision, reducing human error and enhancing speed. - Credit Scoring and Risk Assessment
Big Data is revolutionizing credit scoring by incorporating alternative data like social media, payment history, and online behavior to predict creditworthiness. Advanced algorithms assess credit risk more accurately, helping lenders make informed decisions. - Portfolio Management
Portfolio managers use Big Data to refine asset selection, analyze risks, and optimize returns. Real-time data and alternative data sources contribute to more comprehensive investment strategies, improving asset allocation and risk dBig Data detects anomalies, preventing fraudiversification. - Fraud Detection
Big Data techniques help detect unusual patterns and anomalies in financial transactions, aiding in fraud prevention. Machine learning models can flag suspicious activity, enhancing security in financial institutions and protecting investor assets. - Market Sentiment Analysis
By analyzing news, social media, and reports, Big Data provides insights into market sentiment, allowing analysts to anticipate trends. For example, a sudden shift in social media sentiment about a company may indicate upcoming volatility in its stock price.
Advantages and Challenges of Big Data Techniques
1. Advantages
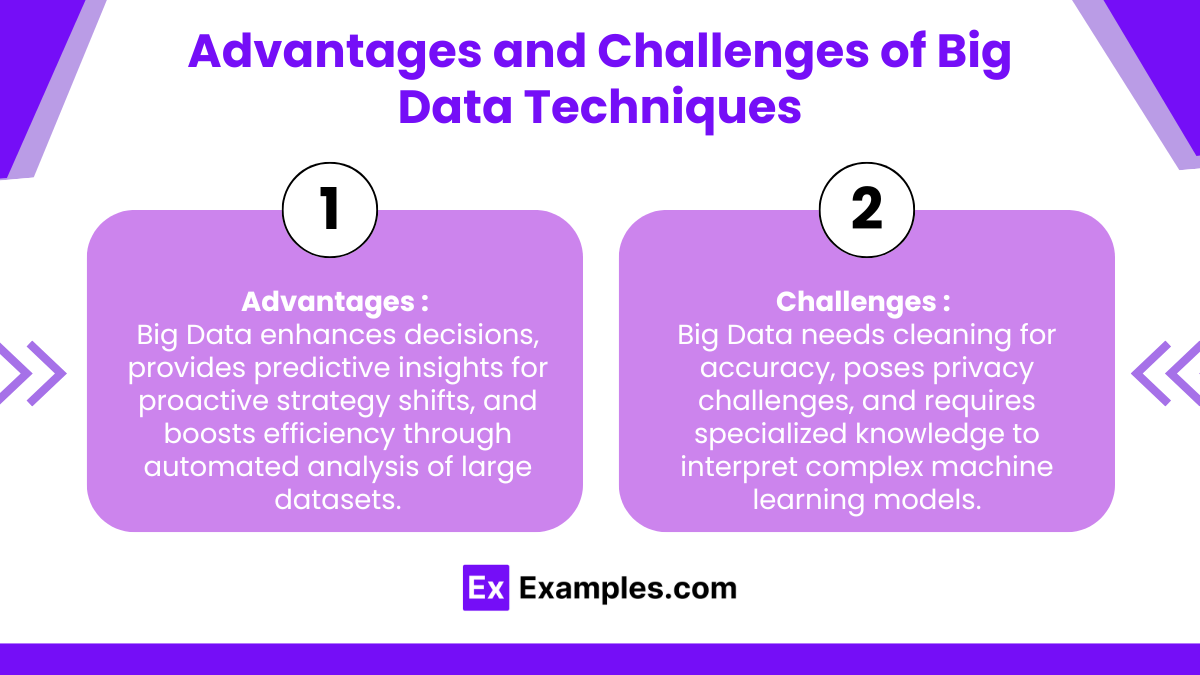
Big Data enhances decisions, provides predictive insights for proactive strategy shifts, and boosts efficiency through automated analysis of large datasets.
- Enhanced Decision-Making : Big Data provides a comprehensive view of market trends and risk factors, improving investment decisions.
- Predictive Power : Data-driven predictions help in anticipating market shifts, adjusting strategies proactively.
- Increased Efficiency : Automated systems can process and analyze large datasets faster than manual methods, increasing operational efficiency.
2. Challenges
Big Data needs cleaning for accuracy, poses privacy challenges, and requires specialized knowledge to interpret complex machine learning models.
- Data Quality and Cleaning : Big Data often includes unstructured and noisy data, requiring extensive preprocessing to ensure accuracy.
- Data Privacy Concerns : Handling vast amounts of personal and financial data raises privacy and compliance issues.
- Complexity of Models : Machine learning models can be complex and challenging to interpret, requiring specialized knowledge for accurate analysis.
Examples
Example 1:Data Mining in Portfolio Analysis
Data mining techniques are used to uncover hidden patterns within vast financial datasets. For example, analysts can employ clustering algorithms to group stocks with similar risk and return characteristics, enabling more effective portfolio diversification. By identifying trends in historical data, analysts gain insights into potential portfolio combinations that optimize returns while managing risk. This technique is especially useful when creating factor-based or sector-specific investment strategies.
Example 2: Machine Learning for Credit Risk Assessment
Financial institutions utilize machine learning algorithms to improve credit risk evaluation. By analyzing alternative data sources like social media activity, payment history, and consumer behavior, machine learning models can better predict an individual’s creditworthiness than traditional methods. This approach reduces default risk and improves lending decisions. CFA candidates should understand how these algorithms classify high-risk and low-risk borrowers, as this knowledge is essential for roles in credit analysis and risk management.
Example 3: Natural Language Processing (NLP) in Sentiment Analysis
NLP enables financial analysts to process and interpret unstructured data from news articles, financial reports, and social media. For instance, sentiment analysis can evaluate the tone of market-related news to gauge public sentiment about a company or sector. A surge in positive sentiment may indicate rising investor interest, potentially leading to price increases. This insight is valuable for constructing trading strategies that capitalize on market sentiment shifts, a technique increasingly relevant in quantitative finance.
Example 4: Time Series Analysis in Economic Forecasting
Time series analysis techniques, like ARIMA models, are essential for forecasting future values based on historical data. For example, an analyst may use time series analysis to predict interest rate trends, helping firms make informed decisions on investments or loans. Understanding how to analyze economic indicators using time series models allows CFA candidates to anticipate market conditions and adjust portfolio strategies accordingly, making it a key skill in both investment management and financial planning.
Example 5: Algorithmic Trading Using Real-Time Data
Big Data enables algorithmic trading by allowing systems to process real-time data from various sources, such as stock exchanges, economic reports, and social media feeds. For instance, a trading algorithm might be programmed to execute buy or sell orders based on changes in market sentiment or stock price fluctuations. This approach leverages high-frequency data and machine learning to capture small, rapid price changes, enhancing returns. Understanding the role of Big Data in algorithmic trading equips CFA candidates with insights into quantitative strategies that rely on automated data-driven decisions.
Practice Questions
Question 1
Which of the following best describes the role of Natural Language Processing (NLP) in Big Data analysis for finance?
A) NLP is used to predict future stock prices by analyzing historical price patterns.
B) NLP helps in processing and analyzing unstructured data such as news articles and financial reports.
C) NLP clusters financial assets into groups based on similar characteristics.
D) NLP creates a supervised machine learning model for predicting default risk.
Answer: B) NLP helps in processing and analyzing unstructured data such as news articles and financial reports.
Explanation: Natural Language Processing (NLP) is a Big Data technique that enables computers to interpret human language. In finance, NLP is primarily used to analyze unstructured text data from sources like news articles, earnings reports, and social media. By processing this data, NLP can provide insights into market sentiment and trends that might influence stock prices or investment decisions. Options A, C, and D do not accurately describe the primary application of NLP, as these functions relate to other areas of Big Data or machine learning, not specifically NLP.
Question 2
Which Big Data technique would be most appropriate for predicting credit risk based on a borrower’s historical payment data, social media activity, and spending behavior?
A) Data Mining
B) Machine Learning
C) Time Series Analysis
D) Sentiment Analysis
Answer: B) Machine Learning
Explanation: Machine learning is the ideal technique for predicting credit risk, especially when analyzing large datasets with various types of information, such as payment history, social media activity, and spending behavior. Machine learning algorithms can learn patterns and classify data (e.g., high-risk vs. low-risk borrowers) based on these patterns, making them valuable in credit risk assessment. Data mining (A) is a broader technique that includes identifying patterns in data, while time series analysis (C) is used for forecasting trends over time and would not typically be applied to credit risk. Sentiment analysis (D) is more relevant for gauging market sentiment and is not primarily used for credit risk assessment.
Question 3
In the context of Big Data, what is the significance of the “3 Vs” – Volume, Velocity, and Variety?
A) They represent the three stages of data analysis in finance.
B) They are key characteristics that define Big Data and its challenges.
C) They are metrics used to evaluate the profitability of an investment portfolio.
D) They refer to the three main types of data storage techniques.
Answer: B) They are key characteristics that define Big Data and its challenges.
Explanation: The “3 Vs” – Volume, Velocity, and Variety – are the defining characteristics of Big Data. Volume refers to the massive amounts of data generated, velocity to the speed at which new data is created and processed, and variety to the different forms of data (structured, semi-structured, and unstructured). These characteristics pose challenges in processing, storing, and analyzing data, especially in finance where data must be analyzed quickly to inform decisions. Options A, C, and D do not accurately describe the 3 Vs, as they are not related to data stages, portfolio metrics, or data storage techniques.

