Market-Based Valuation using Price and Enterprise Value Multiples is a fundamental approach in equity analysis that allows investors to assess a company’s value relative to its peers. By comparing metrics like Price-to-Earnings (P/E), Price-to-Book (P/B), and EV/EBITDA, analysts gain insights into whether a stock is undervalued or overvalued based on market standards. These multiples reflect factors like growth potential, profitability, and industry risk, helping investors make informed decisions. This method is widely used in financial analysis, offering a quick and comparative view of valuation.
Learning Objectives
In studying “Equity: Market-Based Valuation—Price and Enterprise Value Multiples” for the CFA Exam, you should learn to apply various valuation multiples, including Price-to-Earnings (P/E), Price-to-Book (P/B), Price-to-Sales (P/S), and enterprise value multiples like EV/EBITDA and EV/EBIT. Analyze how these multiples help assess relative value by comparing a company’s stock price to its financial performance. Evaluate the factors influencing multiples, such as growth expectations, profitability, and industry risk, and understand their application across different sectors. Additionally, apply this knowledge to assess undervaluation or overvaluation and make informed investment decisions in CFA practice passages.
1. Understanding Price Multiples
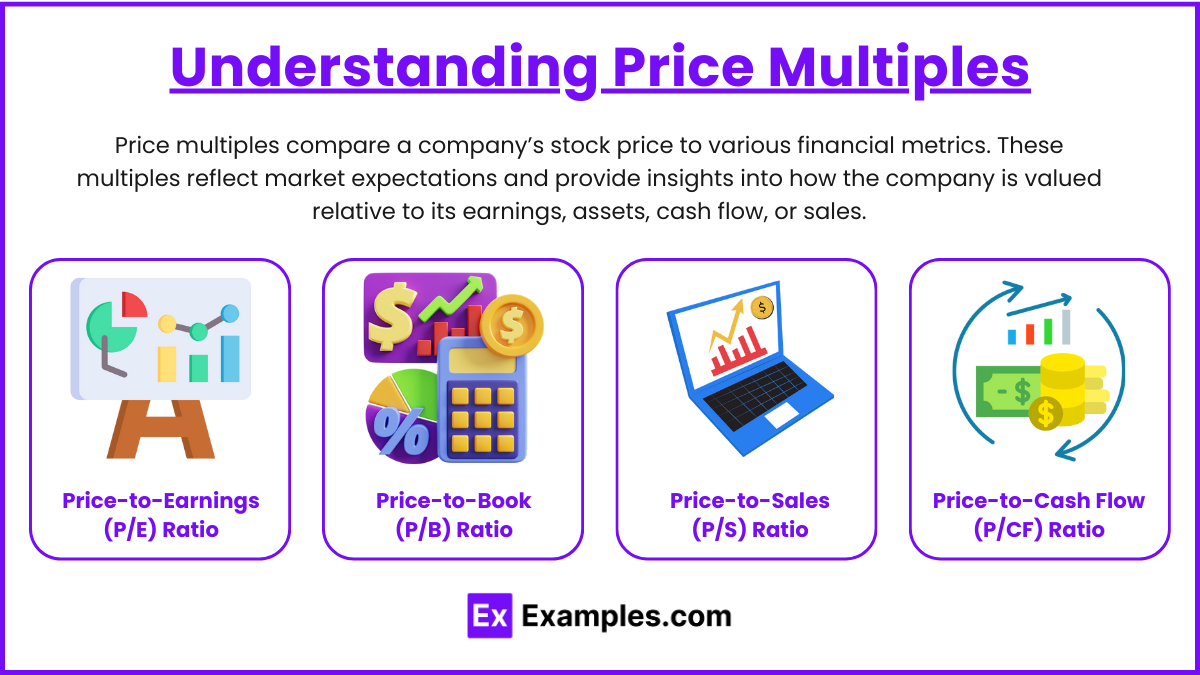
Price multiples compare a company’s stock price to various financial metrics. These multiples reflect market expectations and provide insights into how the company is valued relative to its earnings, assets, cash flow, or sales. Key price multiples include:
- Price-to-Earnings (P/E) Ratio: This ratio compares the stock price to earnings per share (EPS), indicating how much investors are willing to pay for a dollar of earnings. It’s widely used because it reflects market optimism (or pessimism) about future earnings growth. P/E ratios are often classified as:
- Trailing P/E: Based on past 12-month earnings, trailing P/E helps assess historical performance.
- Forward P/E: Based on projected earnings, forward P/E reflects market expectations of future growth.
- Relative P/E: Compares the P/E to industry averages or benchmark indexes, showing how the company is valued relative to peers.
- Price-to-Book (P/B) Ratio: P/B compares the stock price to book value per share, indicating how much investors are paying for the company’s net assets. Book value is calculated as total assets minus liabilities, so this ratio is particularly useful for industries with tangible assets, like banking and manufacturing. Ratios under 1.0 may suggest undervaluation, while higher values can indicate investor confidence in the company’s growth potential.
- Price-to-Sales (P/S) Ratio: This ratio evaluates a stock price in relation to revenue per share. It is particularly valuable for assessing early-stage or low-profit companies, as it focuses on revenue generation regardless of profitability. Low P/S ratios could imply undervaluation, while high P/S ratios often reflect strong revenue potential or premium valuation.
- Price-to-Cash Flow (P/CF) Ratio: P/CF compares stock price to operating cash flow per share, offering insights into a company’s ability to generate cash. Since cash flow is less affected by accounting adjustments than earnings, P/CF can give a clearer view of a company’s financial health, making it a preferred measure for companies with high non-cash expenses, like depreciation.
2. Enterprise Value (EV) Multiples

Enterprise value multiples consider the entire capital structure, offering a comprehensive view of valuation by factoring in both equity and debt. Common EV multiples include:
- EV/EBITDA: This ratio divides enterprise value by earnings before interest, taxes, depreciation, and amortization (EBITDA). Since EBITDA reflects operational profitability and excludes capital structure effects, it’s commonly used to compare companies with different financing or tax structures. It’s widely used in capital-intensive industries like telecom and utilities, where depreciation and debt levels vary significantly.
- EV/EBIT: Similar to EV/EBITDA but based on earnings before interest and taxes (EBIT), this metric accounts for capital costs and tax impacts, making it more applicable to companies with minimal depreciation or amortization. EV/EBIT is often favored for more mature companies with stable income and expenses.
- EV/Revenue: This ratio divides EV by revenue, offering a top-line measure of valuation. It’s useful for early-stage companies or industries with high variability in earnings, where revenue is a more stable metric.
3. Applications of Price and EV Multiples in Valuation
Valuation using multiples provides a way to compare companies within the same sector or industry and to gauge relative valuation levels. Key applications include:
- Comparable Companies Analysis (CCA): This approach involves comparing a company’s multiples to those of similar companies. Analysts identify a peer group, calculate the average or median multiple, and apply it to the target company’s metric (e.g., earnings, book value) to derive an implied valuation. CCA is particularly useful for industries with established benchmarks, such as retail or banking.
- Benchmarking Against Historical Multiples: Comparing a company’s current multiples to its historical multiples can reveal if it’s trading above or below historical norms. For instance, if a company’s P/E is higher than its historical average, it may suggest overvaluation, assuming fundamentals haven’t changed.
- Cross-Sector Comparisons: Price and EV multiples enable comparison across different sectors, helping investors assess relative attractiveness. However, care must be taken as sector fundamentals can vary widely, affecting interpretation.
4. Factors Influencing Multiples

Multiple valuations are affected by several factors that analysts must account for:
- Growth Expectations: Companies with high growth potential often have higher multiples, as investors are willing to pay a premium for anticipated future growth. Analysts often compare P/E-to-growth ratios (PEG ratios) to assess growth-adjusted valuations.
- Risk Levels: Riskier companies tend to have lower multiples as investors require a risk premium. For example, companies in volatile or cyclical industries might trade at lower P/E ratios than stable sectors like utilities.
- Profitability and Margins: Higher profitability and strong margins usually support higher multiples, reflecting operational efficiency. A company with a consistently high return on equity (ROE) might justify a higher P/B ratio.
- Economic and Industry Conditions: Macroeconomic factors, such as interest rates and economic growth, can influence valuations. High-interest rates, for example, often lead to lower P/E ratios as future earnings are discounted more heavily.
Examples
Example 1: Using the P/E Ratio to Evaluate Tech Companies
A tech investor might use the P/E ratio to compare high-growth companies within the sector. By looking at each company’s forward P/E (based on expected earnings), the investor can assess which stocks are priced more attractively relative to their anticipated growth. If one company has a forward P/E of 25 and a competitor is at 30, the investor might view the first as a better value, assuming similar growth rates.
Example 2: Assessing Value in the Banking Sector with the P/B Ratio
For asset-intensive industries like banking, the P/B ratio is commonly used to assess whether a company is trading below or above the value of its net assets. If a bank’s P/B ratio is significantly below 1.0, it may indicate undervaluation, especially if its asset quality and profitability are stable. An investor might compare the P/B ratios of several banks in the same region to identify which bank stock offers the best relative value.
Example 3: Using EV/EBITDA for Capital-Intensive Industries
In industries like telecommunications and utilities, where companies have significant debt, the EV/EBITDA multiple provides a useful capital-structure-neutral comparison. A utility investor may use EV/EBITDA to evaluate companies within the sector, as it reflects operational earnings before capital expenditures and financing costs. Comparing the EV/EBITDA multiple of two telecom companies can highlight the more efficient company regardless of how they are financed.
Example 4: Valuing a Start-Up with the P/S Ratio
Start-up companies, especially those not yet profitable, are often valued based on the P/S ratio rather than earnings metrics. For example, an investor evaluating two early-stage software companies might compare their P/S ratios to determine which offers better value based on revenue potential. If one has a P/S ratio of 8 while the industry average is 12, it may be undervalued relative to its revenue generation capability.
Example 5: Analyzing EV/Revenue in the Retail Industry
In the retail industry, where revenues are often high but margins can be thin, EV/Revenue can provide a more stable valuation metric. An analyst might use EV/Revenue to compare two retail chains, focusing on how efficiently they generate sales relative to their enterprise value. A retail chain with a lower EV/Revenue multiple might be seen as a better value, assuming comparable growth and profitability levels, as it indicates a potentially lower cost to acquire revenue.
Practice Questions
Question 1
Which of the following valuation multiples is most appropriate for comparing companies in a capital-intensive industry?
A) Price-to-Earnings (P/E)
B) Price-to-Book (P/B)
C) Price-to-Sales (P/S)
D) EV/EBITDA
Answer: D) EV/EBITDA
Explanation: The EV/EBITDA (Enterprise Value to Earnings Before Interest, Taxes, Depreciation, and Amortization) multiple is particularly useful for capital-intensive industries, where companies often have large fixed assets and significant debt levels. EV/EBITDA is capital-structure-neutral, meaning it provides a fair comparison by removing the effects of debt financing and capital expenditures. This metric focuses on the company’s operational performance, making it suitable for industries like utilities, telecommunications, or manufacturing, where depreciation and debt can vary widely across companies.
Question 2
If a company’s P/E ratio is higher than the industry average, which of the following could be a likely explanation?
A) The company is expected to experience lower growth than its peers
B) The company is considered riskier than its peers
C) The company is expected to have higher growth prospects than its peers
D) The company has a lower profitability margin than its peers
Answer: C) The company is expected to have higher growth prospects than its peers
Explanation: A high P/E ratio typically indicates that the market has higher expectations for a company’s future earnings growth relative to its peers. Investors are willing to pay a premium for these expected earnings, resulting in a higher P/E. Lower growth expectations or higher risk would likely result in a lower P/E ratio, as investors would pay less for perceived lower future earnings or higher risk exposure. Profitability margins generally affect other metrics, such as the P/S ratio or EV/EBITDA, more directly than the P/E ratio.
Question 3
Which of the following statements about the Price-to-Book (P/B) ratio is correct?
A) A P/B ratio above 1.0 always indicates overvaluation
B) P/B ratio is commonly used in asset-intensive industries like banking
C) P/B ratio is irrelevant for comparing companies with different growth rates
D) P/B ratio is preferred for companies with high intangible assets
Answer: B) P/B ratio is commonly used in asset-intensive industries like banking
Explanation: The P/B ratio is widely used for asset-intensive industries, such as banking, where assets on the balance sheet are central to the business model. The P/B ratio compares the market value of a company’s equity to its book value (net asset value), and values near or below 1.0 might indicate undervaluation, depending on asset quality. However, a P/B above 1.0 does not necessarily indicate overvaluation, as it could reflect strong growth potential or high profitability. The P/B ratio is less useful for companies with significant intangible assets (like tech firms) because book value may not capture the value of intellectual property or brand reputation.

