Preparing for the CFA Exam requires a solid understanding of Market Efficiency, a fundamental concept in financial theory. Mastery of the Efficient Market Hypothesis (EMH), including weak, semi-strong, and strong forms, is essential. This knowledge aids in analyzing asset pricing, market anomalies, and investment strategies, crucial for achieving a high CFA score.
Learning Objective
In studying “Market Efficiency” for the CFA Exam, you should aim to understand the Efficient Market Hypothesis (EMH) and its implications for asset pricing and investment strategies. Analyze the three forms of market efficiency—weak, semi-strong, and strong—and their impact on the ability to achieve abnormal returns. Evaluate the underlying principles and evidence supporting each form, including market anomalies and behavioral finance perspectives. Additionally, explore how EMH influences portfolio management decisions, trading strategies, and financial models. Apply this understanding to interpret market dynamics and assess the effectiveness of active versus passive investment strategies in CFA exam practice scenarios.
What is Market Efficiency?

Market Efficiency is the concept that asset prices fully reflect all available information, making it impossible to consistently achieve above-average returns through market timing or stock selection
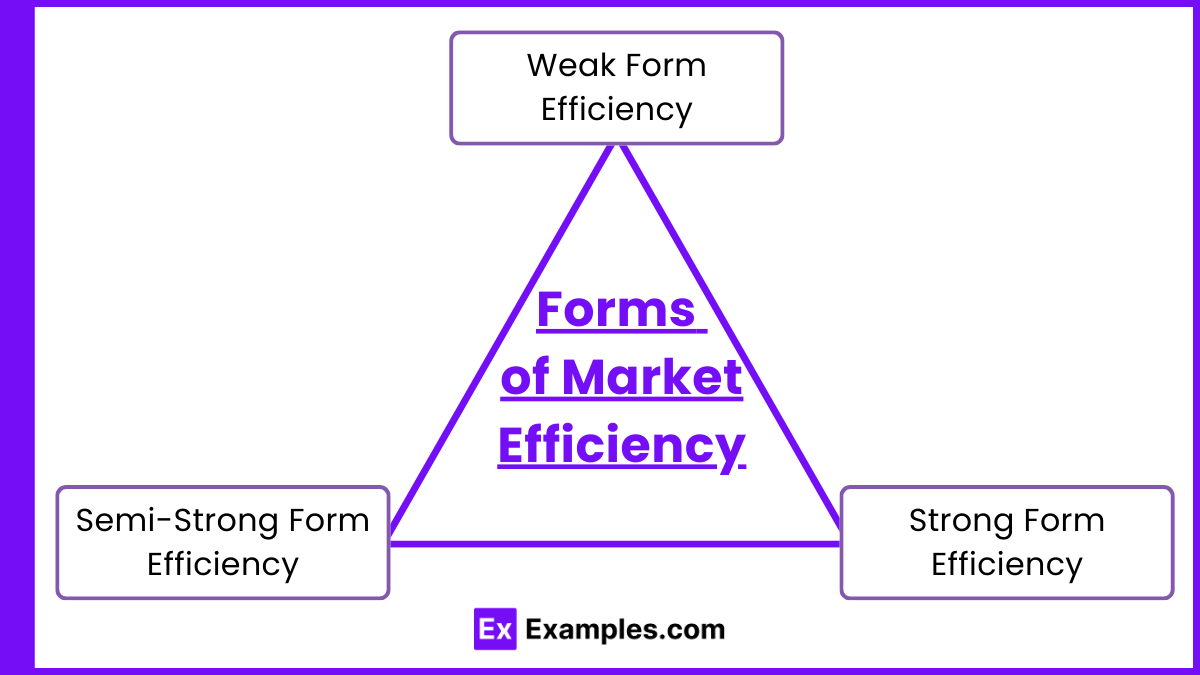
Forms of Market Efficiency

Market Efficiency is commonly classified into three forms, each representing different levels of information reflected in asset prices:
1. Weak Form Efficiency
- Definition: This form assumes that all past trading information, such as historical prices and volume, is already reflected in current stock prices.
- Implication: Since past price data is already included in current prices, technical analysis (which relies on past prices to predict future movements) cannot consistently yield abnormal returns. However, fundamental analysis, which uses financial data, may still have some value in predicting prices.
2. Semi-Strong Form Efficiency
- Definition: This form of efficiency posits that all publicly available information, including financial statements, economic news, and other public announcements, is fully reflected in stock prices.
- Implication: Neither technical analysis nor fundamental analysis can provide investors with an advantage, as prices adjust quickly to new public information. Investment strategies based solely on public information are therefore unlikely to outperform the market.
3. Strong Form Efficiency
- Definition: In this form, all information—both public and private (insider information)—is already incorporated into asset prices.
- Implication: Even individuals with insider information cannot consistently achieve abnormal returns, as prices reflect all knowledge, both publicly accessible and confidential. Strong form efficiency implies that no investor, regardless of their level of information, can gain an edge over the market.
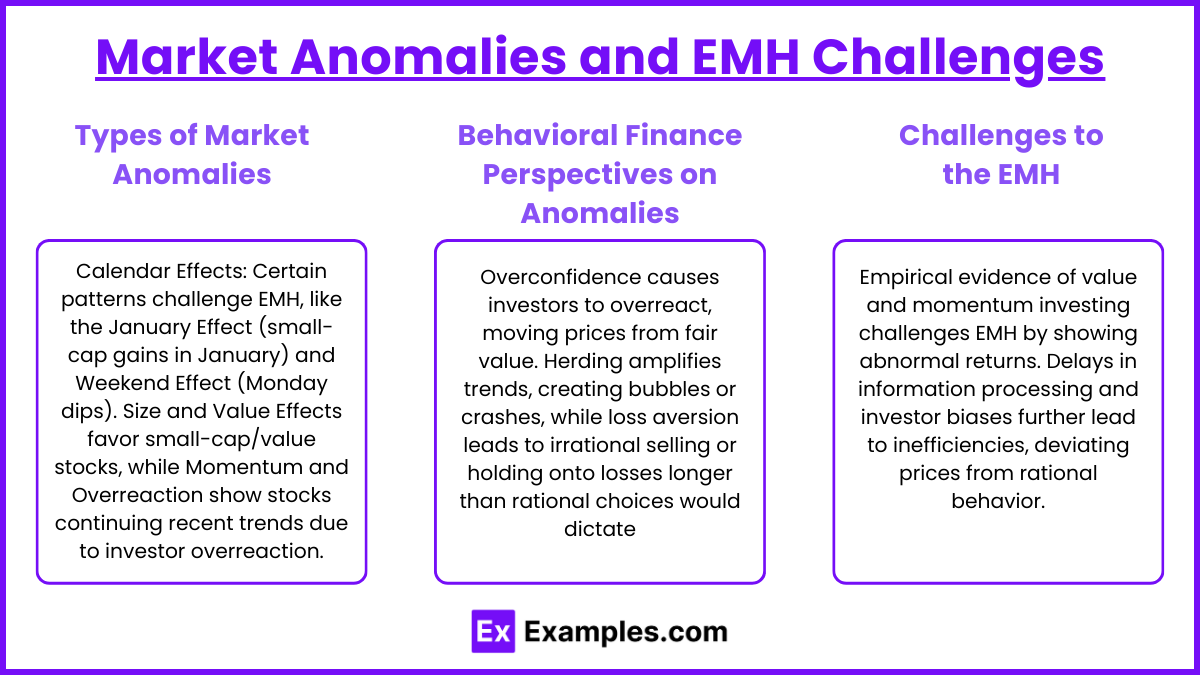
Market Anomalies and EMH Challenges

While the Efficient Market Hypothesis (EMH) suggests that asset prices reflect all available information, market anomalies present evidence that prices sometimes deviate from true value, allowing investors to potentially earn above-average returns. These anomalies challenge the idea that markets are fully efficient and offer insights into market inefficiencies often explained by behavioral finance.
1. Types of Market Anomalies
- Calendar Effects: Certain time-based patterns in stock returns contradict EMH. Examples include:
- January Effect: Stocks, especially small-cap ones, often show higher returns in January, possibly due to tax-related selling in December followed by buying in January.
- Weekend Effect: Historically, stock prices tend to drop on Mondays, potentially due to negative news over weekends or traders’ expectations of lower prices.
- Size and Value Effects: Studies have shown that smaller-cap stocks and undervalued stocks (low price-to-earnings or low price-to-book ratios) can outperform larger or growth-oriented stocks, contrary to what EMH predicts.
- Momentum and Overreaction: Stocks with strong recent performance often continue to perform well in the short term, while poorly performing stocks continue to decline, suggesting a momentum effect. Similarly, overreaction refers to the tendency of investors to push prices too high or low in response to news, leading to corrections as the market adjusts.
2. Behavioral Finance Perspectives on Anomalies
- Overconfidence and Overreaction: Investors may become overconfident in their ability to predict market movements, causing them to overreact to recent information and drive prices away from fair value.
- Herding Behavior: Investors often follow the actions of others, especially in times of uncertainty, which can create bubbles (overpriced assets) or crashes (underpriced assets) as trends are amplified.
- Loss Aversion and Prospect Theory: Behavioral finance suggests that investors are more sensitive to losses than gains, which may cause irrational selling or holding of losing investments longer than rational economic decisions would suggest.
3. Challenges to the EMH
- Empirical Evidence: Numerous studies have shown that certain strategies, like value investing or momentum-based investing, can yield abnormal returns, which challenges the EMH, particularly in its semi-strong and strong forms.
- Information Processing Delays: Prices may not always react instantly to new information due to delays in processing or asymmetric access to information, creating temporary inefficiencies.
- Limitations of Rationality: EMH assumes rational behavior, but psychological biases frequently drive investors’ actions, leading to deviations from expected price behavior.
Examples
Example 1: Earnings Announcement Impact
When a company releases its earnings report, stock prices often react almost instantly, reflecting the new information. In a semi-strong form efficient market, this rapid adjustment leaves little opportunity for investors to profit from analyzing the earnings report after its release. For instance, if a company reports higher-than-expected profits, an efficient market would quickly adjust the stock price upward, meaning latecomers would miss out on these gains.
Example 2: Stock Price Response to Economic News
Consider an interest rate cut announced by the central bank. In an efficient market, stock prices would immediately incorporate the impact of lower rates on company profits, borrowing costs, and economic growth. Investors who react after the initial price adjustment would not achieve abnormal returns, as the market already reflects the implications of the interest rate change.
Example 3: Insider Trading and Strong Form Efficiency
In a perfectly strong-form efficient market, even private, insider information would be reflected in stock prices. For example, if an executive privately knows about an upcoming merger, theoretically, the stock price should already incorporate this information. However, in reality, most markets are not strong-form efficient, and insider trading can often lead to abnormal profits. This limitation of strong-form efficiency reveals that not all private information is priced into the market.
Example 4: January Effect and Market Anomalies
The January Effect is a seasonal anomaly where stocks, particularly small-cap stocks, tend to perform better in January than in other months. This pattern challenges market efficiency by suggesting that seasonal factors, unrelated to company fundamentals, can influence stock prices. The January Effect implies that some investors may achieve abnormal returns by investing in small-cap stocks before the new year, contradicting EMH’s assumption that all relevant information is already priced in.
Example 5: Momentum Effect in Stocks
The EMH suggests that past stock price movements should not predict future returns in a weak-form efficient market. However, the momentum effect challenges this by showing that stocks with strong recent performance often continue to perform well in the short term, and poorly performing stocks tend to continue declining. Investors who exploit these trends may achieve abnormal returns, which contradicts weak-form efficiency and suggests that patterns in stock prices are sometimes predictable.
Practice Questions
Question 1
What is the primary purpose of a market index?
A) To provide a benchmark for portfolio performance comparison.
B) To ensure efficient market operations.
C) To regulate the securities market.
D) To facilitate insider trading.
Answer: A) To provide a benchmark for portfolio performance comparison.
Explanation:
A market index tracks the performance of a specific set of stocks, representing a particular market segment or the market as a whole. Investors and portfolio managers use these indexes as benchmarks to compare the performance of individual stocks or portfolios against the broader market, assessing relative performance.
Question 2
Which of the following is not a characteristic of a well-constructed market index?
A) Transparency
B) Subjectivity in stock selection
C) Representativeness
D) Investability
Answer: B) Subjectivity in stock selection.
Explanation:
A well-constructed market index should be transparent, representative, and investable, meaning that the criteria for selecting stocks are clear, the index accurately reflects the market or market segment, and the stocks within the index are sufficiently liquid and available for investment. Subjectivity in stock selection undermines the objectivity and reliability of the index as a market benchmark.
Question 3
Which index would most likely use a market-capitalization weighting method?
A) An equally-weighted index
B) A price-weighted index
C) A market-capitalization weighted index
D) A fundamental index
Answer: C) A market-capitalization weighted index.
Explanation:
In a market-capitalization weighted index, the impact of each stock on the index’s overall performance is proportional to its market capitalization, which is the total market value of the company’s outstanding shares. This is the most common method used by major indexes, such as the S&P 500, as it reflects the size and influence of each company within the market.


