Portfolio Performance Evaluation

- Notes
Portfolio Performance Evaluation is a key component of portfolio management, focused on measuring and assessing a portfolio’s returns relative to its risk and investment objectives. This process involves analyzing both absolute and relative performance, considering factors like risk-adjusted returns, benchmark comparisons, and attribution analysis. For CFA candidates, mastering portfolio performance evaluation techniques is essential, as they allow investment professionals to determine how well a portfolio meets its objectives and identify areas for improvement in investment strategy.
Learning Objectives
In studying “Portfolio Performance Evaluation” for the CFA exam, you will learn to measure and interpret a portfolio’s performance using a variety of metrics, including absolute return, risk-adjusted return, and benchmark comparison. You will analyze performance attribution to understand the sources of return and evaluate how portfolio decisions impact performance relative to benchmarks. Additionally, you will explore methods for adjusting returns based on the level of risk taken, using tools like the Sharpe ratio, Treynor ratio, and Jensen’s alpha. By mastering these skills, you will be able to assess the effectiveness of portfolio management strategies and make informed adjustments to improve performance.
Introduction to Portfolio Performance Evaluation

Portfolio performance evaluation is a systematic approach to measuring how well a portfolio achieves its objectives in terms of return and risk. This process involves comparing actual performance against a benchmark and examining factors like portfolio risk, return, and asset allocation decisions. Effective performance evaluation enables portfolio managers to validate investment strategies and to identify potential areas for improvement.
Types of Performance Measures
There are various measures used to evaluate portfolio performance, with each measure providing different insights:
- Absolute Return: The portfolio’s total return over a specific period, without considering risk.
- Relative Return: Compares the portfolio’s return to a benchmark, highlighting performance in relation to the market or a peer group.
- Risk-Adjusted Return: Accounts for the level of risk taken to achieve a given return, using metrics such as the Sharpe ratio, Treynor ratio, and Jensen’s alpha. These measures help assess if a portfolio’s returns are commensurate with its risk profile.
Benchmark Comparison
Benchmark comparison is crucial in performance evaluation, as it provides a point of reference for assessing portfolio success. A benchmark should be representative of the portfolio’s investment objectives and strategy. Common benchmarks include broad market indices (e.g., S&P 500) or custom benchmarks tailored to specific portfolio characteristics. A portfolio that consistently outperforms its benchmark is considered to deliver superior value to investors.
Risk-Adjusted Performance Metrics
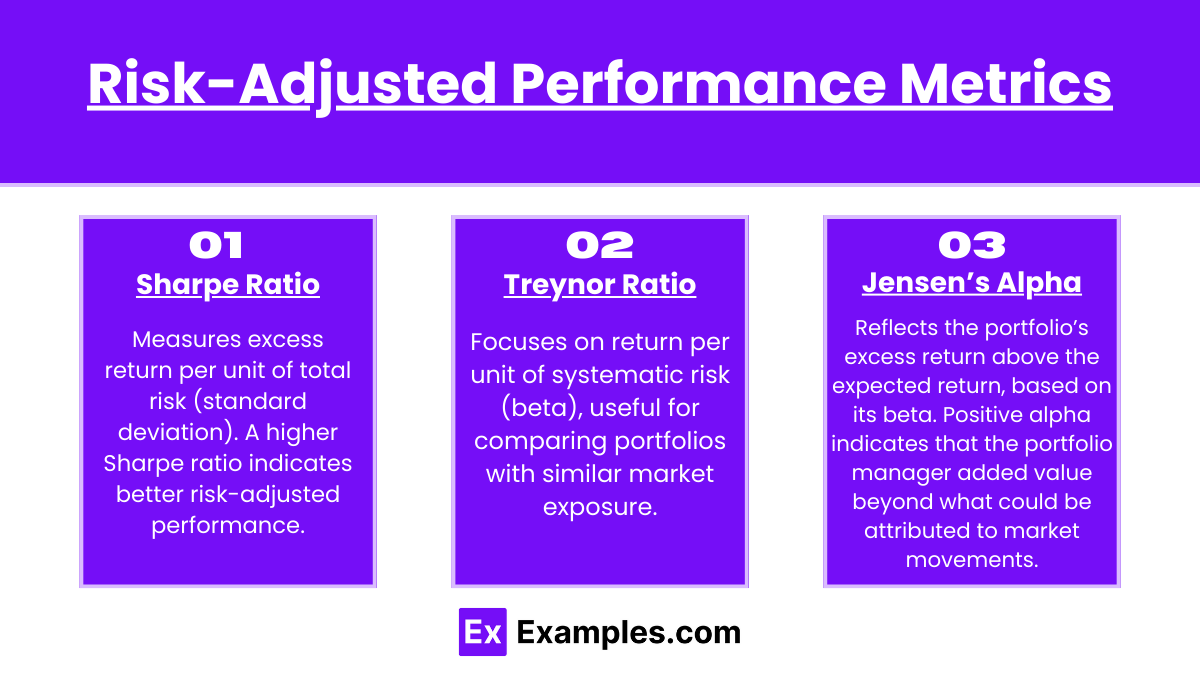
Risk-adjusted metrics evaluate how well a portfolio performs given the level of risk taken:
- Sharpe Ratio: Measures excess return per unit of total risk (standard deviation). A higher Sharpe ratio indicates better risk-adjusted performance.
- Treynor Ratio: Focuses on return per unit of systematic risk (beta), useful for comparing portfolios with similar market exposure.
- Jensen’s Alpha: Reflects the portfolio’s excess return above the expected return, based on its beta. Positive alpha indicates that the portfolio manager added value beyond what could be attributed to market movements. Using these metrics, CFA candidates learn to assess if returns justify the risks taken, making these tools essential for comprehensive portfolio analysis.
Performance Attribution Analysis
Performance attribution dissects portfolio performance to identify sources of return relative to a benchmark. Attribution analysis includes:
- Asset Allocation Effect: Measures the impact of asset class selection on portfolio performance.
- Security Selection Effect: Examines the contribution of individual security choices to returns, showing if security selection added or detracted value.
- Interaction Effect: Captures the combined impact of asset allocation and security selection decisions. Performance attribution enables portfolio managers to evaluate the effectiveness of their investment decisions and make data-driven adjustments to strategy.
Examples
Example 1
A portfolio has an annual return of 12% with a standard deviation of 8%, and the risk-free rate is 2%. Calculate the Sharpe ratio to evaluate its risk-adjusted performance.
Example 2
A portfolio manager benchmarks their performance against the S&P 500, which returned 10% during the period. If the portfolio returned 13% with a beta of 1.1, calculate Jensen’s alpha to determine if the manager outperformed the benchmark on a risk-adjusted basis.
Example 3
A portfolio’s allocation is 60% equities and 40% bonds, while the benchmark’s allocation is 50% equities and 50% bonds. Using attribution analysis, determine the effect of this asset allocation on the portfolio’s performance.
Example 4
Calculate the Treynor ratio for a portfolio with an annual return of 15%, beta of 1.2, and risk-free rate of 3%. Compare this ratio to other portfolios with similar beta levels to assess relative performance.
Example 5
A portfolio underperformed its benchmark by 1% due to poor security selection in the technology sector. Through attribution analysis, the manager identifies security selection within this sector as a key area for improvement.
Practice Questions
Question 1
Which of the following metrics would best assess a portfolio’s performance based on both return and total risk?
A) Alpha
B) Beta
C) Sharpe Ratio
D) Treynor Ratio
Answer: C) Sharpe Ratio
Explanation: The Sharpe ratio evaluates a portfolio’s return per unit of total risk (standard deviation), making it ideal for assessing risk-adjusted performance based on both return and total risk.
Question 2
What does a positive Jensen’s alpha indicate about a portfolio’s performance?
A) The portfolio’s returns are entirely due to market movements
B) The portfolio has a higher Sharpe ratio than the benchmark
C) The manager added value beyond what is attributable to systematic risk
D) The portfolio has a lower beta than expected
Answer: C) The manager added value beyond what is attributable to systematic risk
Explanation: Positive alpha signifies that the manager’s active investment decisions generated returns above those predicted by the portfolio’s beta, indicating value added beyond market movements.
Question 3
A portfolio has a beta of 1.1 and an expected return of 12%. If the risk-free rate is 3% and the benchmark return is 10%, what is the portfolio’s Jensen’s alpha?
A) 0.2%
B) 1.0%
C) 1.9%
D) 2.5%
Answer: B) 1.0%
Explanation: Jensen’s alpha = Actual Return – [Risk-Free Rate + Beta * (Benchmark Return – Risk-Free Rate)]. Calculating with the values given yields an alpha of 1%, indicating excess returns above the expected level for the portfolio’s beta.

