Rates and Returns

- Notes
“Rates and Returns” encompasses essential metrics for evaluating investment performance, risk, and profitability. By analyzing various return measures, such as nominal, real, and risk-adjusted returns, investors can gauge how assets grow over time and compare different investment options. Compounding methods, like the Compounded Annual Growth Rate (CAGR) and continuous compounding, reveal the impact of reinvesting earnings. Understanding the relationship between risk and return, along with key ratios like the Sharpe Ratio, enables informed decision-making, helping investors align their portfolios with desired risk tolerance and financial goals.
Learning Objectives
In studying ” Rates and Returns” for the CFA Exam, you should aim to understand the various ways of calculating and interpreting returns, including nominal, real, and risk-adjusted returns. Analyze how these calculations provide insights into investment performance across different time periods. Evaluate compounding methods, such as continuous compounding and the Compounded Annual Growth Rate (CAGR), and their impact on long-term returns. Additionally, explore risk-return relationships and the use of metrics like the Sharpe Ratio and Jensen’s Alpha in assessing investment risk. Apply your understanding to solve complex financial scenarios, enhancing your ability to interpret portfolio performance.
1. Introduction to Rates and Returns

- Rates and returns are fundamental concepts in finance, measuring an investment’s profitability and growth over time. The rate of return represents the percentage change in an asset’s value, while absolute return refers to the total dollar gain or loss. Key types include nominal vs. real returns (adjusted for inflation) and holding period vs. annualized returns. Rates and returns are essential for comparing investment performance, assessing risk, and making strategic financial decisions. Understanding these metrics enables investors to evaluate investment outcomes, forecast future returns, and optimize portfolios based on risk tolerance and financial goals.
- Understanding the differences between simple, compound, and annualized rates of return is crucial for making sound investment decisions.
2. Types of Returns

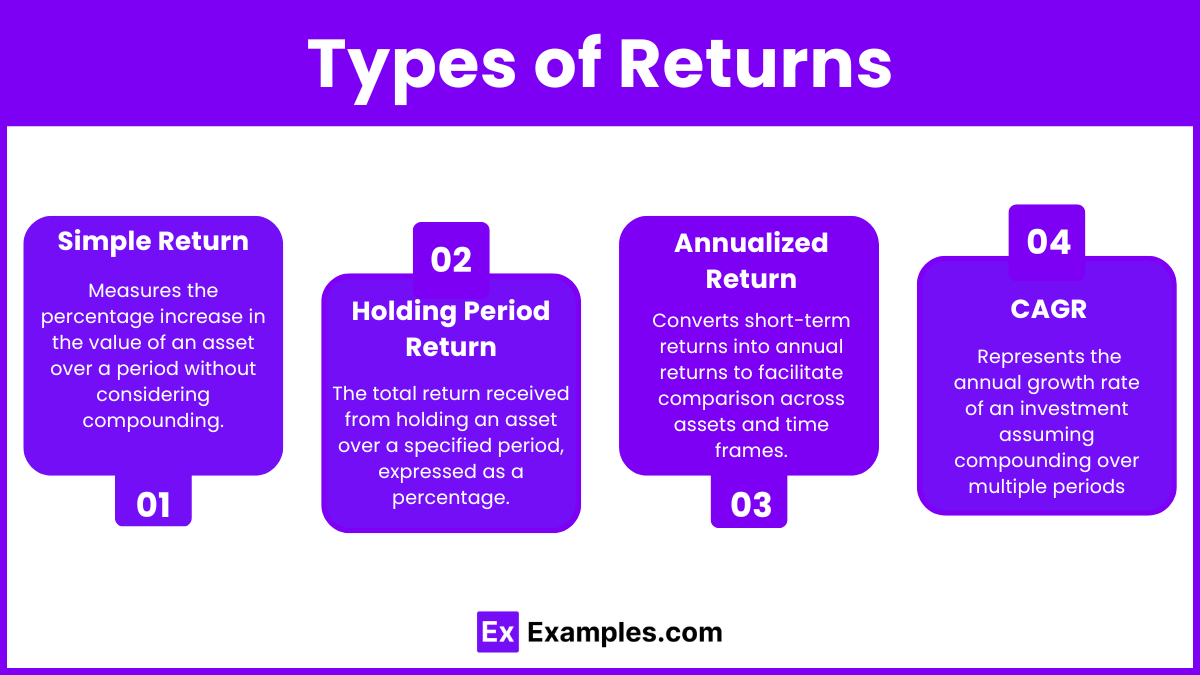
- Simple Return: Measures the percentage increase in the value of an asset over a period without considering compounding. It is calculated as
 .
. - Holding Period Return (HPR): The total return received from holding an asset over a specified period, expressed as a percentage.
- Annualized Return: Converts short-term returns into annual returns to facilitate comparison across assets and time frames.
- Compounded Annual Growth Rate (CAGR): Represents the annual growth rate of an investment assuming compounding over multiple periods, calculated as:
 where n is the number of years.
3. Return Calculation Adjustments

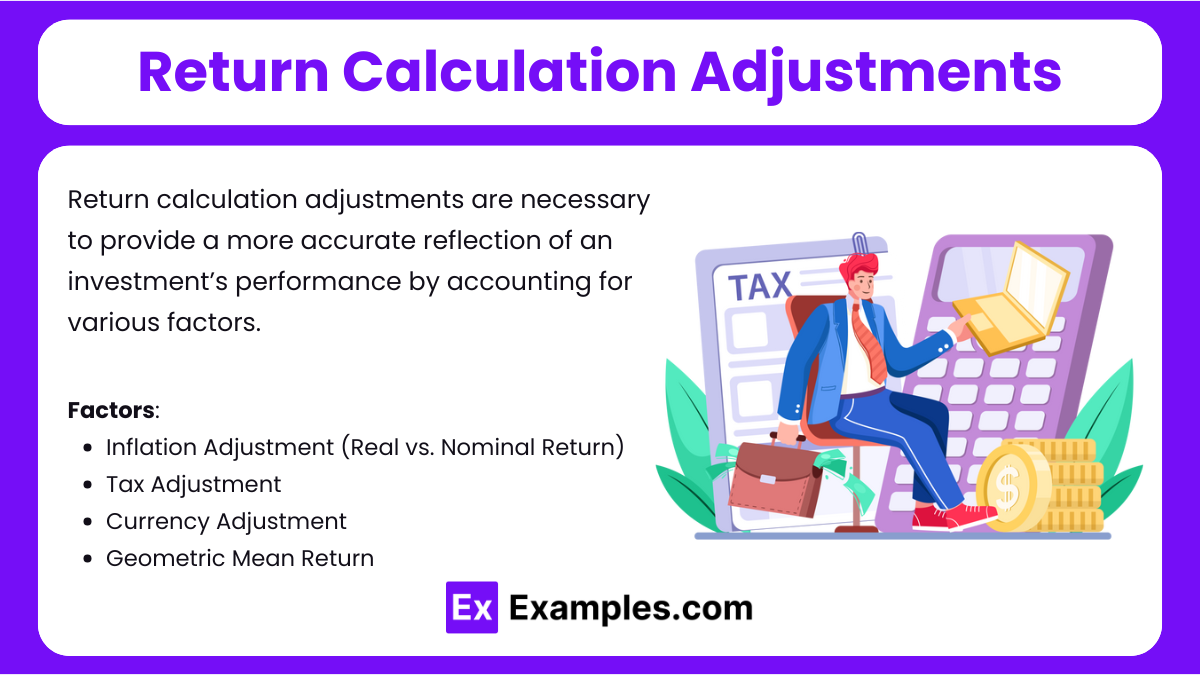
Return calculation adjustments are necessary to provide a more accurate reflection of an investment’s performance by accounting for various factors. Common adjustments include:
- Inflation Adjustment (Real vs. Nominal Return)
- Converts nominal returns into real returns by factoring in inflation, giving a clearer picture of purchasing power over time.
- Tax Adjustment
- Adjusts returns to reflect taxes on dividends, interest, or capital gains, as taxes can significantly impact net returns.
- Currency Adjustment
- For international investments, currency fluctuations are accounted for to measure true performance in the investor’s home currency.
Examples
Example 1: Simple Rate of Return
This is the most basic calculation of return, reflecting the percentage gain or loss on an investment relative to its initial cost. It’s calculated by subtracting the beginning value from the ending value, dividing by the beginning value, and then multiplying by 100 to express as a percentage. Simple returns are commonly used for quick assessments of single-period performance, making it a foundational tool in investment analysis.
Example 2: Holding Period Return (HPR)
HPR measures the total return on an asset or portfolio over the entire period it is held, accounting for capital gains and any income received, such as dividends or interest. It’s valuable for assessing short-term investments or those that do not span a full year. The HPR formula is adaptable for comparing various investments held over different periods, providing flexibility in evaluating performance.
Example 3: Annualized Return
This adjusts the holding period return to an annual figure, making it possible to compare returns from investments with different time horizons on an equal basis. It assumes a consistent rate of return and is calculated by taking the nth root of the HPR, where n is the number of years, then subtracting one. Annualized returns help CFA candidates compare investments more accurately when durations differ.
Example 4: Compound Annual Growth Rate (CAGR)
The CAGR provides a smoothed annual growth rate that considers the effects of compounding over multiple periods, offering a realistic measure of how an investment grows over time. It is calculated by dividing the ending value by the beginning value, taking the nth root of this ratio, and subtracting one. CAGR is especially useful for assessing performance of investments with fluctuating returns, as it eliminates interim volatility, focusing on overall growth.
Example 5: Risk-Adjusted Returns (Sharpe Ratio)
The Sharpe Ratio is an essential risk-adjusted performance metric used in the CFA program, which helps investors understand the return earned per unit of risk. Calculated as the difference between the portfolio return and the risk-free rate, divided by the portfolio’s standard deviation, this ratio helps compare investments with different risk profiles. By focusing on risk-adjusted returns, the Sharpe Ratio emphasizes the importance of balancing risk and return, a key principle in the CFA curriculum.
Practice Questions
Question 1
An investor invests $1,000 in a stock that provides an annual return of 8% compounded annually. What will be the value of the investment after 5 years?
A) $1,400.00
B) $1,469.33
C) $1,540.78
D) $1,600.00
Answer: C) $1,540.78
Explanation:
To calculate the future value of an investment with annual compounding, use the formula:
![]()
Here:
- Present Value (PV) = $1,000
- Rate = 8% or 0.08
- Number of Periods = 5
Substituting these values:
![]()
Therefore, the correct answer is C) $1,540.78.
Question 2
Which of the following statements about the Compounded Annual Growth Rate (CAGR) is incorrect?
A) CAGR represents a smoothed annualized return rate over a specified period.
B) CAGR accounts for reinvested returns, reflecting compound growth.
C) CAGR is ideal for measuring returns with highly volatile annual performance.
D) CAGR can be used to compare the growth rates of different investments.
Answer: C) CAGR is ideal for measuring returns with highly volatile annual performance.
Explanation:
The Compounded Annual Growth Rate (CAGR) measures the constant rate of return assuming compound growth, smoothing out annual fluctuations. While CAGR is useful for evaluating overall growth over a specific period, it does not reflect annual volatility and thus is less ideal for investments with highly fluctuating returns. For volatile investments, metrics like standard deviation or annualized returns provide a clearer picture of performance. Therefore, the correct answer is C, as this statement is incorrect.
Question 3
An investor calculates the Sharpe Ratio of a portfolio with an expected return of 12%, a risk-free rate of 4%, and a standard deviation of 10%. What is the Sharpe Ratio of the portfolio?
A) 0.40
B) 0.80
C) 1.20
D) 2.00
Answer: B) 0.80
Explanation:
The Sharpe Ratio measures risk-adjusted return, calculated as:
![]()
In this case:
- Portfolio Return = 12%
- Risk-Free Rate = 4%
- Standard Deviation = 10%
Substitute the values:
![]()
A higher Sharpe Ratio indicates a better risk-adjusted return, but here the calculated ratio is 0.80, making B the correct answer.

