Preparing for the CFA Exam requires proficiency in “Simple Linear Regression,” which involves statistical methods used to model the relationship between two variables. Key topics include the least squares method, correlation analysis, and regression diagnostics. Mastery of these concepts enables candidates to interpret data trends and make informed, data-driven predictions regarding investment strategies and financial forecasting, which are essential for success on the CFA Exam.
Learning Objectives
In studying “Simple Linear Regression” for the CFA exam, you should aim to comprehend the key statistical principles that form the foundation of investment analysis. This area concentrates on employing sample data to identify relationships between variables, helping analysts forecast trends and outcomes. Important topics include the least squares estimation method, correlation metrics, and regression evaluation. Master these concepts to analyze investment scenarios and perform thorough financial assessments.
What is Simple Linear Regression?

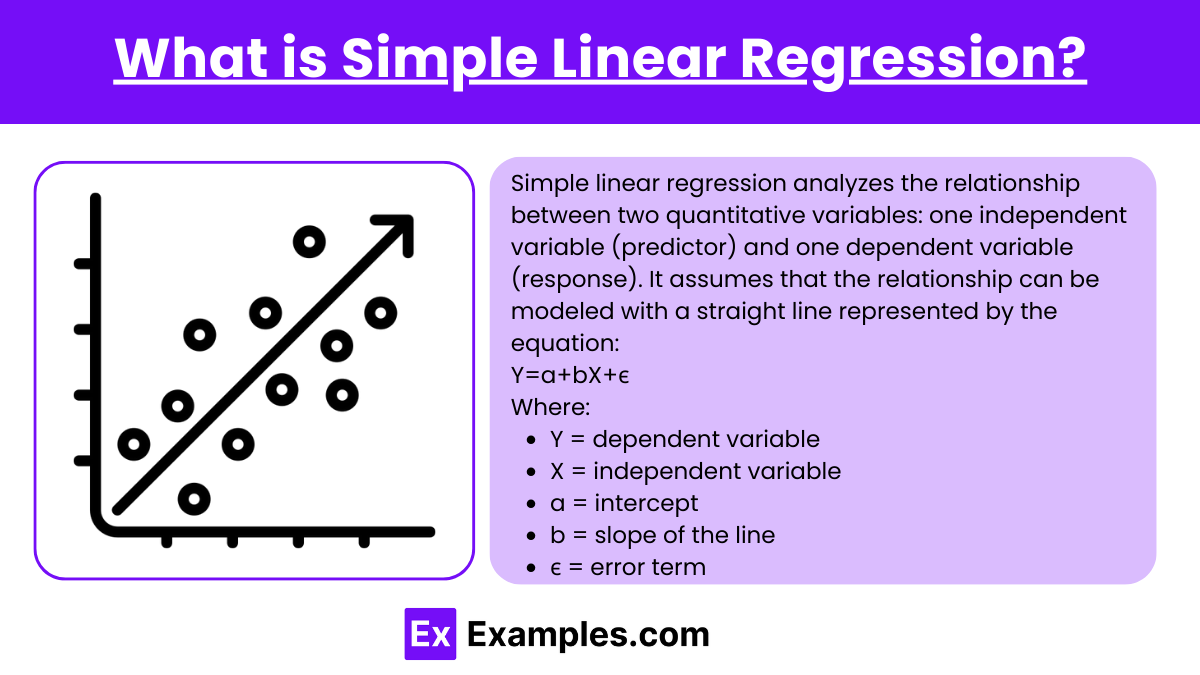
Simple linear regression analyzes the relationship between two quantitative variables: one independent variable (predictor) and one dependent variable (response). It assumes that the relationship can be modeled with a straight line represented by the equation:
Y=a+bX+ϵ
Where:
- Y = dependent variable
- X = independent variable
- a = intercept
- b = slope of the line
- ϵ = error term
Purposes of Simple Linear Regression

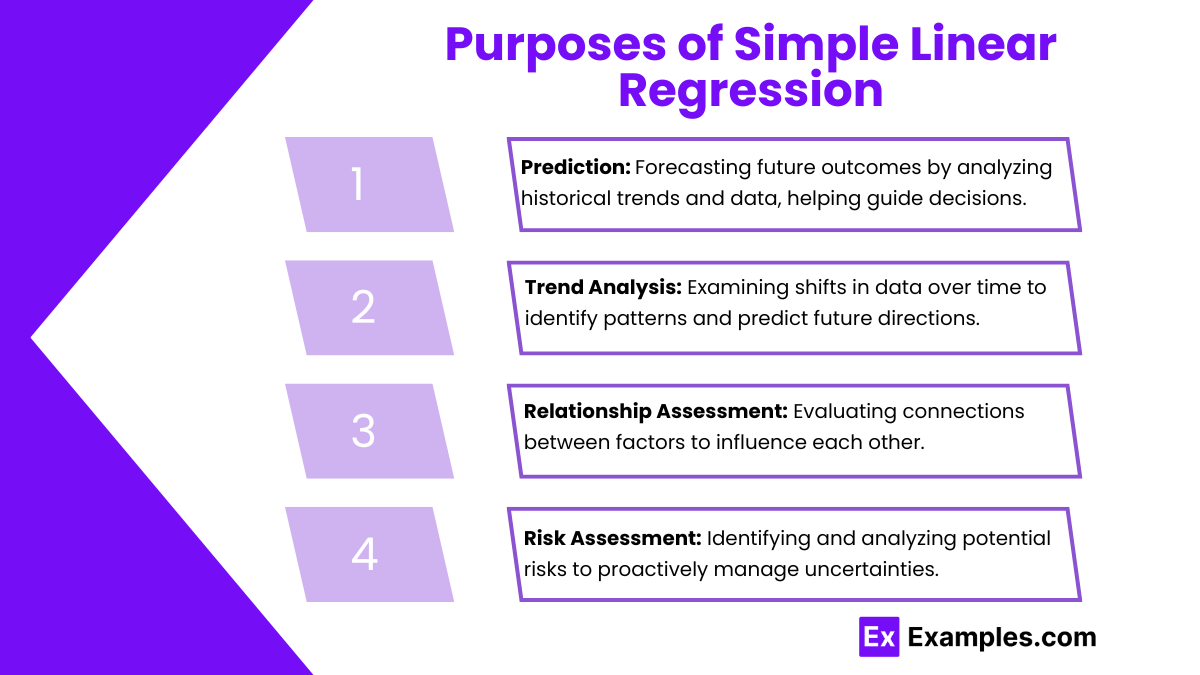
- Prediction: One of the primary purposes of simple linear regression is to estimate the value of the dependent variable based on the independent variable. For instance, businesses often use this method to predict sales based on advertising spend. The regression model generates an equation that enables stakeholders to input the value of the independent variable (like advertising expenditure) to obtain the predicted value of the dependent variable (sales). This predictive capability is invaluable for making informed decisions and formulating strategies.
- Trend Analysis: Simple linear regression is also instrumental in identifying trends within data over time. By analyzing historical data, analysts can determine whether there is a consistent upward or downward trend in the dependent variable as the independent variable changes. This analysis can provide insights into future behavior and help organizations adjust their strategies accordingly. For example, a company might track its sales data over several years and apply simple linear regression to ascertain whether sales are increasing in response to changing market conditions.
- Relationship Assessment: Another key purpose of simple linear regression is to understand the strength and nature of the relationship between variables. By examining the regression coefficients, analysts can determine how much the dependent variable changes for a unit change in the independent variable. The correlation coefficient, often provided alongside the regression analysis, quantifies the degree to which the two variables are related. This insight is crucial for businesses, as it helps in understanding how different factors influence one another.
- Risk Assessment: Simple linear regression is beneficial in evaluating how changes in one variable can impact another, which is critical for investment decisions. For example, an investor might use regression analysis to assess how fluctuations in interest rates affect stock prices. By establishing a clear relationship through regression, decision-makers can better understand potential risks and rewards, thus making more informed investment choices.
Types of Simple Linear Regression

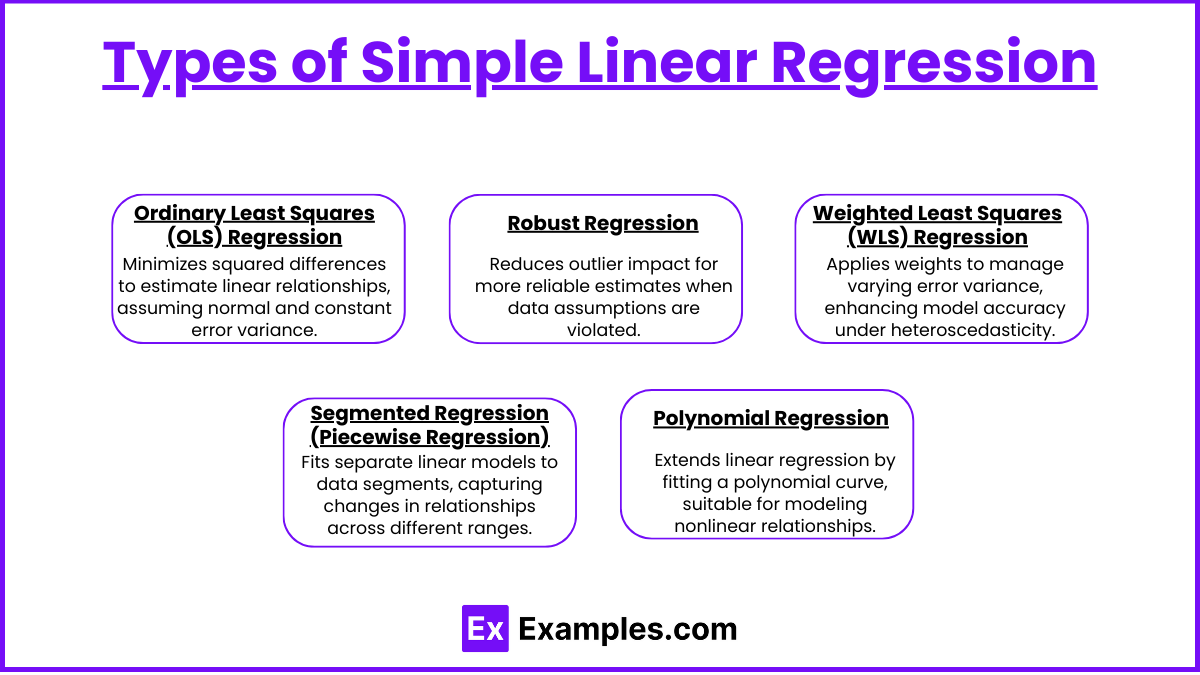
1. Ordinary Least Squares (OLS) Regression
- Description: OLS is the most widely used method for simple linear regression. It estimates the coefficients of the linear equation by minimizing the sum of the squared differences between the observed values and the predicted values. This technique assumes that the residuals (errors) are normally distributed and homoscedastic (constant variance).
- Use Cases: OLS is appropriate for datasets without extreme outliers and when the relationship between the independent and dependent variables is linear. It is commonly used in various fields, including economics, social sciences, and business.
2. Robust Regression
- Description: Robust regression is designed to be less sensitive to outliers and violations of assumptions typically required by OLS. This method applies techniques that reduce the influence of outlier data points, providing a more accurate estimate of the relationship between variables when such points are present.
- Use Cases: This type is particularly useful in real-world data where outliers are common. Fields like finance and environmental studies often employ robust regression when dealing with non-normal data distributions.
3. Weighted Least Squares (WLS) Regression
- Description: WLS regression is an extension of OLS that accounts for heteroscedasticity, where the variance of the residuals changes across levels of the independent variable. In WLS, different weights are assigned to data points based on their variance, allowing the model to minimize the weighted sum of squared residuals.
- Use Cases: WLS is effective when the data exhibit non-constant variance, making it ideal for datasets where the spread of the dependent variable increases with the independent variable.
4. Segmented Regression (Piecewise Regression)
- Description: This method involves fitting separate linear regressions to different segments of the data. It is useful for modeling relationships that exhibit different linear behaviors across various ranges of the independent variable.
- Use Cases: Segmented regression is commonly applied in situations where a change in the relationship is expected at a certain threshold, such as in policy analysis or environmental studies where regulations impact data trends differently.
5. Polynomial Regression
- Description: Although technically not a simple linear regression, polynomial regression extends linear regression by fitting a polynomial equation rather than a linear one. This method allows for modeling relationships that are curved or nonlinear.
- Use Cases: Useful in scenarios where the relationship between the variables is inherently nonlinear, such as in biological growth models or engineering applications.
Examples
Example 1. Predicting Housing Prices
Simple linear regression can be employed to predict housing prices based on a single predictor variable, such as the square footage of a home. By collecting historical data on home sales, one can establish a linear relationship between the size of the property and its selling price. This model can help potential buyers and real estate agents estimate the market value of homes more accurately.
Example 2. Analyzing Marketing Effectiveness
Businesses often use simple linear regression to analyze the relationship between marketing spend and sales revenue. For instance, a company may examine how increases in advertising expenditure correlate with sales increases over time. By plotting this data, a linear regression model can provide insights into the effectiveness of marketing campaigns and guide future budget allocations.
Example 3. Studying Academic Performance
In educational research, simple linear regression can be utilized to explore the relationship between study hours and students’ academic performance, typically measured through grades. By collecting data on the number of hours students study and their corresponding grades, researchers can determine if there is a significant linear relationship that can help in understanding how study habits affect academic success.
Example 4. Assessing Employee Performance
Organizations can apply simple linear regression to evaluate the impact of training hours on employee performance ratings. By gathering data on the number of hours employees have undergone training and their subsequent performance evaluations, employers can create a regression model to ascertain whether more training correlates with improved performance, aiding in workforce development strategies.
Example 5. Forecasting Sales Trends
Retailers frequently use simple linear regression to forecast future sales based on historical sales data. For example, a store may analyze past sales figures over several months to predict future sales for the upcoming quarter. By fitting a linear regression line to this data, the retailer can make informed decisions about inventory management, staffing needs, and promotional strategies.
Practice Questions
Question 1
What is the primary purpose of Simple Linear Regression?
A) To predict the value of one variable based on another variable
B) To compare the means of two independent groups
C) To explore the relationship between two categorical variables
D) To summarize the central tendency of a data set
Correct Answer: A) To predict the value of one variable based on another variable
Explanation: Simple Linear Regression is a statistical method used to model the relationship between a dependent variable (the outcome) and an independent variable (the predictor) by fitting a linear equation to the observed data. The goal is to predict the value of the dependent variable based on the known value of the independent variable, making option A the correct choice.
Question 2
What is the coefficient of determination, often denoted as R2, used for in Simple Linear Regression?
A) To measure the strength and direction of the relationship between the independent and dependent variables
B) To indicate the proportion of variance in the dependent variable that is predictable from the independent variable
C) To test the significance of the regression coefficients
D) To assess the goodness of fit of a model
Correct Answer: B) To indicate the proportion of variance in the dependent variable that is predictable from the independent variable
Explanation: The coefficient of determination, R2, quantifies the proportion of the variance in the dependent variable that can be explained by the independent variable in a regression model. It ranges from 0 to 1, where 0 indicates that the independent variable does not explain any of the variance in the dependent variable, and 1 indicates that it explains all of the variance. Therefore, option B accurately describes the purpose of R2 in the context of Simple Linear Regression.
Question 3
What is the assumption of homoscedasticity in the context of Simple Linear Regression?
A) The residuals have a constant variance across all levels of the independent variable.
B) The residuals are normally distributed.
C) There is a linear relationship between the independent and dependent variables.
D) The independent variable is normally distributed.
Correct Answer: A) The residuals have a constant variance across all levels of the independent variable.
Explanation: Homoscedasticity refers to the assumption that the variance of the residuals (errors) is constant across all levels of the independent variable in a regression model. If this assumption is violated (a condition known as heteroscedasticity), it can affect the validity of hypothesis tests and confidence intervals for the regression coefficients. Therefore, option A is the correct answer regarding the assumption of homoscedasticity.


