Preparing for the CFA Exam necessitates a clear understanding of “The Term Structure & Interest Rate Dynamics,” a core concept in fixed income analysis. This principle explains how changes in interest rates impact the valuation of bonds and other fixed-income securities. Knowledge of the term structure, which depicts the relationship between bond yields and their maturities, allows candidates to analyze and predict market expectations for future interest rates. Proficiency in this area enables candidates to assess yield curve shifts, identify arbitrage opportunities, and implement effective duration and convexity strategies. This foundational knowledge supports the goal of achieving a high CFA score.
Learning Objectives
In studying “The Term Structure & Interest Rate Dynamics” for the CFA, you should learn to understand the essential concepts behind the relationship between bond yields and their maturities. This involves analyzing how interest rates fluctuate over different time horizons, impacting bond prices and returns. Understanding the term structure enables you to anticipate market expectations regarding future interest rates and assess yield curve shifts, such as upward, downward, or flat movements. Mastery of this area allows you to implement effective fixed-income strategies, optimize portfolio durations, and evaluate interest rate risks, which are crucial for informed decision-making in investment management.
What is Term Structure & Interest Rate Dynamics?
The Term Structure & Interest Rate Dynamics capture the intricate relationship between interest rates and the time horizons of bonds, shedding light on how rates evolve over different maturities. The term structure, often visualized as the yield curve, reflects expectations about future economic conditions, inflation, and shifts in market sentiment. The dynamics of interest rates refer to how these rates change over time, influenced by factors such as central bank policies, economic growth trends, inflationary pressures, and fluctuations in risk appetite. Together, the term structure and interest rate dynamics play a fundamental role in financial markets, guiding investment strategies, shaping risk management approaches, and informing monetary policy decisions.
Purposes of “The Term Structure & Interest Rate Dynamics”
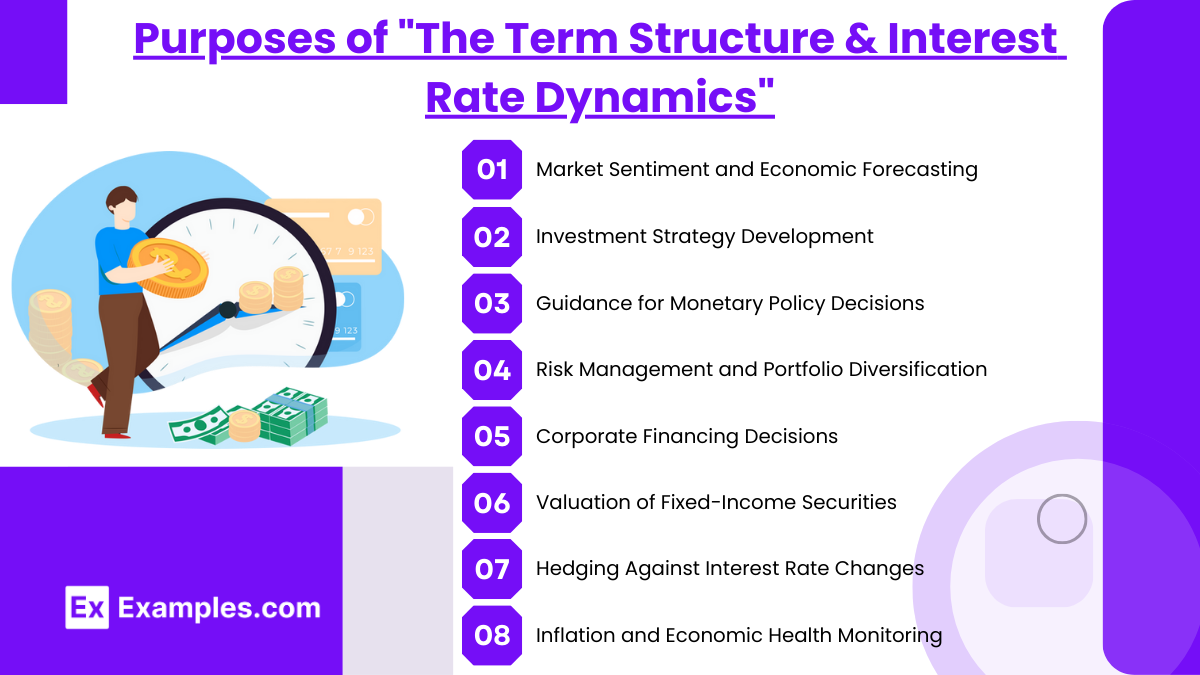
- Market Sentiment and Economic Forecasting
The term structure helps investors interpret market expectations about future interest rates, economic growth, and potential recessions. Changes in the yield curve shape (e.g., normal, inverted) offer insights into future economic conditions. - Investment Strategy Development
By analyzing the yield curve, investors can make informed decisions about bond portfolios. The structure provides guidance on when to invest in short-term vs. long-term bonds based on expected interest rate changes, aligning investment strategy with market conditions. - Guidance for Monetary Policy Decisions
Central banks, like the Federal Reserve, monitor the term structure to assess the effectiveness of their monetary policies. The yield curve can indicate whether rate adjustments are needed to control inflation, encourage growth, or stabilize the economy. - Risk Management and Portfolio Diversification
The term structure aids in managing interest rate risks by indicating how short-term and long-term rates may fluctuate. Investors can use this information to diversify across maturities, reducing risk from unexpected rate changes. - Corporate Financing Decisions
Corporations analyze interest rate dynamics to decide on financing structures. For example, when long-term rates are low, companies may favor issuing long-term debt, locking in favorable rates for future expenses. - Valuation of Fixed-Income Securities
The yield curve is essential for pricing bonds and other fixed-income securities, as it reflects the rates for different maturities. Understanding rate dynamics allows for more accurate valuation and assessment of bond yields. - Hedging Against Interest Rate Changes
Financial institutions and investors use yield curve insights to hedge portfolios against interest rate risk. This may involve using derivatives or adjusting portfolio weightings to offset potential rate fluctuations. - Inflation and Economic Health Monitoring
Interest rate dynamics reveal expectations around inflation and economic stability. For example, a steep yield curve may signal inflationary concerns, while an inverted curve could suggest economic contraction or deflationary pressures.
Theories of “The Term Structure & Interest Rate Dynamics”
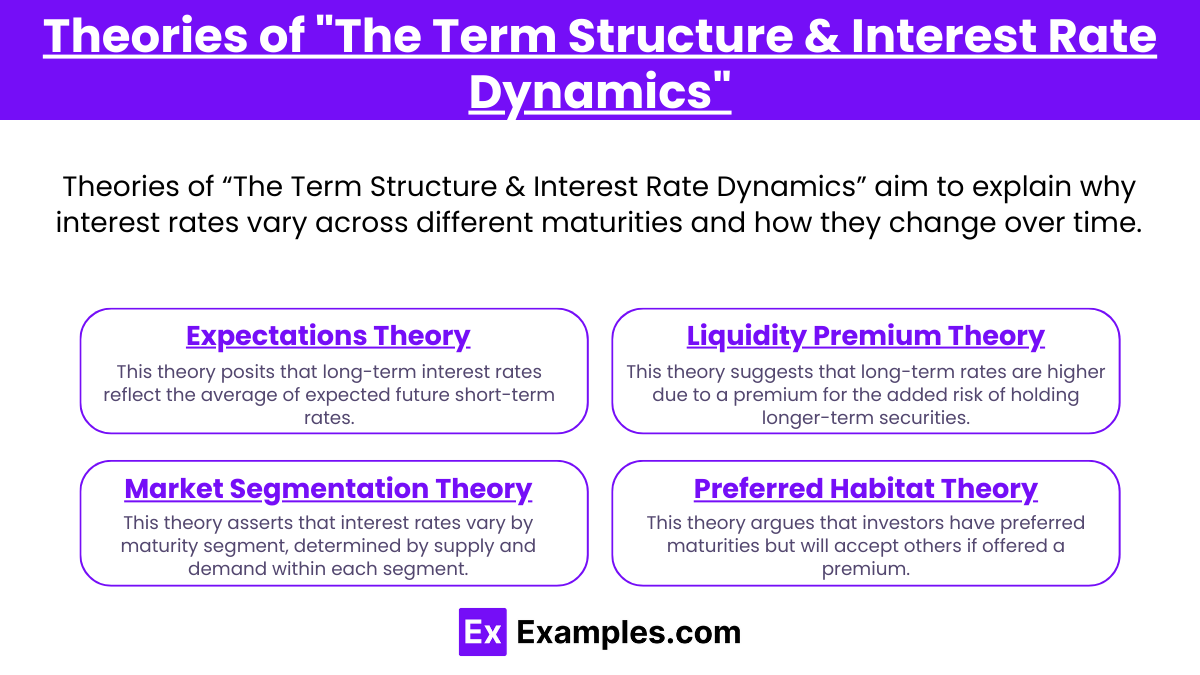
Several theories help explain the shape of the yield curve and the dynamics within the term structure:
- Expectations Theory
This theory suggests that the shape of the yield curve reflects market expectations about future interest rates. According to the expectations theory, if investors anticipate that rates will rise, they will demand higher yields for long-term bonds, resulting in an upward-sloping yield curve. Conversely, if rates are expected to decline, the yield curve may invert. This theory implies that the yield curve is a predictor of future rate movements, as it reflects collective market sentiment. - Liquidity Premium Theory
The liquidity premium theory builds on the expectations theory by adding a premium for longer-term securities due to their higher risk and lower liquidity. Investors generally prefer short-term investments because they are more liquid and less risky. To hold longer-term bonds, investors require an additional premium to compensate for the higher risk associated with holding assets over an extended period. This theory explains why yield curves are often upward-sloping, as they incorporate both expected future rates and a liquidity premium. - Market Segmentation Theory
According to the market segmentation theory, the bond market is divided into segments based on maturity, and each segment operates independently. Different groups of investors prefer different maturities based on their financial needs and risk tolerance. For instance, some investors may prefer short-term bonds for liquidity, while others favor long-term bonds for higher yields. Because each segment is influenced by unique supply and demand factors, the shape of the yield curve reflects the combined behavior across these different maturities, rather than just future rate expectations. - Preferred Habitat Theory
The preferred habitat theory is an extension of market segmentation theory, suggesting that investors have preferred maturities but may venture outside their preferred “habitat” if offered adequate compensation. For example, an investor who typically favors short-term bonds may buy longer-term bonds if they offer a sufficient risk premium. This theory helps explain variations in the yield curve by accounting for investors’ willingness to shift to other maturities when yields become attractive enough.
Types of “The Term Structure & Interest Rate Dynamics”
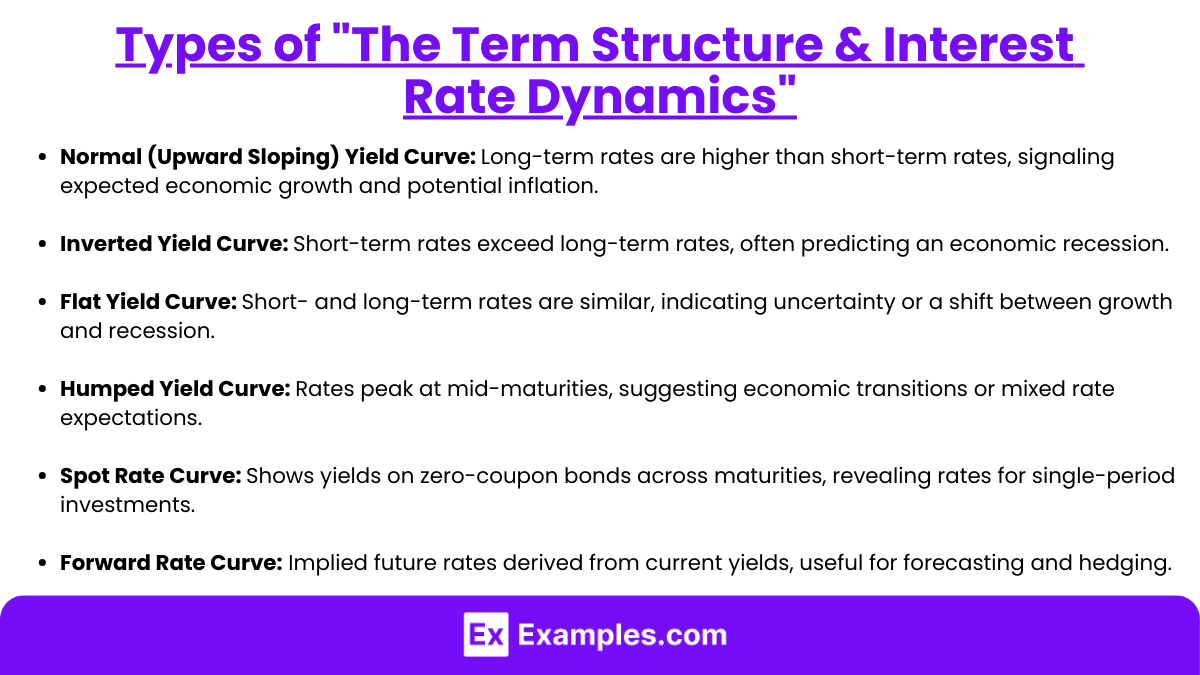
The term structure of interest rates and interest rate dynamics can be classified into several types, each describing different relationships between time to maturity and interest rates. Here are the main types:
- Normal (Upward Sloping) Yield Curve
A yield curve where long-term interest rates are higher than short-term rates. This typically suggests expectations of economic growth and potential inflation, leading investors to demand higher rates for longer maturities. - Inverted Yield Curve
In this scenario, short-term rates are higher than long-term rates. Often seen as a predictor of economic recession, an inverted yield curve implies that investors expect lower growth or inflation in the future. - Flat Yield Curve
A yield curve where short- and long-term interest rates are similar. This usually indicates uncertainty about future economic conditions or a transition between economic growth and recession. - Humped Yield Curve
This curve is higher in the middle of the maturity spectrum than at the short or long ends, creating a “hump.” This shape can indicate periods of transition in the economy or mixed expectations about future interest rate changes. - Spot Rate Curve
The spot rate curve shows the yield on zero-coupon bonds of different maturities. It provides insight into the interest rate required for investing in a single, specific period without reinvestment risk. - Forward Rate Curve
Forward rates are implied future interest rates derived from the current yield curve. The forward rate curve indicates the expected interest rates for specific future periods, helping with forecasting and hedging.
Examples
Example 1. Predicting Economic Cycles
Analysts often examine the term structure of interest rates, particularly the yield curve, to predict economic downturns or expansions. A steep yield curve, where long-term interest rates are significantly higher than short-term rates, can indicate investor confidence in future economic growth. Conversely, an inverted yield curve, where short-term rates exceed long-term rates, may signal an impending recession, as investors expect economic conditions to worsen.
Example 2. Pricing Fixed-Income Securities
The term structure of interest rates is crucial for valuing bonds and other fixed-income securities. By analyzing the relationship between bond maturities and yields, investors can determine the appropriate discount rate for each bond cash flow. This helps in accurately pricing bonds, considering factors like interest rate risk, maturity, and credit quality. Understanding interest rate dynamics enables investors to assess how sensitive a bond’s price might be to shifts in interest rates over time.
Example 3. Managing Interest Rate Risk in Portfolios
Financial institutions and portfolio managers use the term structure to hedge or manage interest rate risk within their portfolios. By aligning the durations of their assets and liabilities, banks, for example, can reduce exposure to adverse rate movements. Using derivatives like interest rate swaps, they can modify exposure based on their forecasts of short- and long-term rate changes, helping to stabilize income and protect capital.
Example 4. Corporate Financing Decisions
Companies consider the term structure of interest rates when planning financing strategies, such as deciding between issuing short-term versus long-term debt. If long-term interest rates are low, a company may lock in long-term financing to reduce future refinancing risks. Conversely, if short-term rates are favorable, they might prefer issuing short-term debt with plans to refinance later, benefiting from potentially lower initial costs.
Example 5. Monetary Policy Implications
Central banks analyze the term structure to gauge market expectations for future interest rates and inflation, helping inform monetary policy decisions. A central bank might interpret a steep yield curve as an indication of inflationary pressure, prompting a decision to raise short-term rates. In contrast, a flattening or inverted curve could lead to a pause or reduction in rates to support economic activity, demonstrating the critical role of term structure analysis in guiding policy decisions.
Practice Questions
Question 1
Which of the following best describes an “inverted yield curve” in the context of the term structure of interest rates?
A) Long-term interest rates are higher than short-term interest rates.
B) Long-term interest rates are lower than short-term interest rates.
C) Long-term and short-term interest rates are equal.
D) The relationship between long-term and short-term rates is irrelevant to the yield curve.
Answer: B) Long-term interest rates are lower than short-term interest rates.
Explanation:
An inverted yield curve occurs when long-term interest rates fall below short-term rates, which is unusual in typical economic conditions. This inversion is often seen as a predictor of an economic downturn or recession. Normally, investors expect to receive higher yields for longer-term investments to compensate for the additional risks, but an inverted curve suggests that investors expect lower rates in the future, possibly due to a forecasted economic slowdown. This expectation drives demand for long-term bonds, pushing their yields below those of short-term bonds.
Question 2
Why might a steep yield curve be considered a positive economic indicator?
A) It suggests that investors expect higher inflation and growth in the future.
B) It implies that investors expect a recession to occur soon.
C) It indicates that short-term rates are likely to fall sharply in the near future.
D) It suggests that both short-term and long-term rates are declining.
Answer: A) It suggests that investors expect higher inflation and growth in the future.
Explanation:
A steep yield curve indicates that long-term interest rates are significantly higher than short-term rates. This steepness is generally associated with investor confidence in future economic growth and higher inflation expectations. When the economy is expected to grow, investors demand higher yields for long-term bonds to compensate for the potential erosion of purchasing power due to inflation. This positive outlook is often accompanied by increased lending and investment, which supports economic expansion.
Question 3
How do central banks use the term structure of interest rates to influence monetary policy?
A) They adjust the yield curve directly by setting long-term interest rates.
B) They use the term structure as a reference for setting short-term interest rates.
C) They determine the overall health of the economy by matching long-term and short-term rates.
D) They only consider the yield curve in periods of economic downturn.
Answer: B) They use the term structure as a reference for setting short-term interest rates.
Explanation:
Central banks, such as the Federal Reserve, do not set long-term interest rates directly but do influence short-term rates, which in turn can impact the overall yield curve. By observing the term structure of interest rates, central banks can gauge market expectations for future economic conditions and inflation. For example, a steep yield curve might signal potential inflation, prompting the central bank to raise short-term rates to cool down the economy. Conversely, a flat or inverted curve might encourage the central bank to lower rates to stimulate economic activity. The yield curve provides essential insights into market sentiment, helping guide policy decisions.

