The term structure of interest rates, including spot, par, and forward curves, is a foundational concept for the CFA Exam. Understanding these curves is vital for analyzing interest rate movements, pricing bonds, and assessing yield expectations. Mastery of this topic equips candidates with insights into interest rate risk and investment decisions.
Learning Objective
In studying “The Term Structure of Interest Rates: Spot, Par, and Forward Curves” for the CFA Exam, you should understand the construction and interpretation of spot, par, and forward rate curves. Analyze how these curves reflect the market’s expectations of future interest rates and influence bond pricing and yield measures. Evaluate the relationship between interest rates and maturity and how yield curves predict economic trends. Additionally, explore the use of these curves in managing interest rate risk, performing valuation, and making investment decisions. Apply these concepts to practical scenarios and CFA exam questions involving bond yield analysis and forecasting.
Understanding Spot Rates
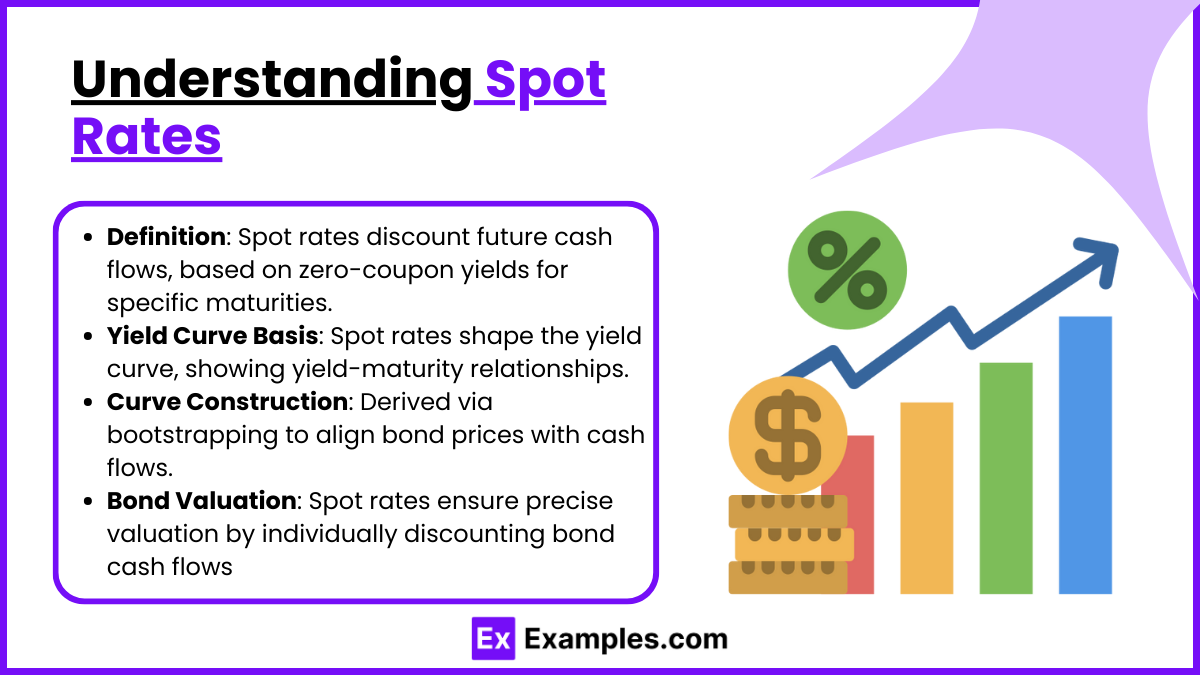
Definition and Concept: Spot rates are the interest rates for specific maturities that discount a single cash flow received in the future back to the present value. Each spot rate corresponds to a particular point in time and represents the yield on a zero-coupon bond maturing at that point. The spot rate, therefore, reflects the cost of capital for an investment with a specific term.
Importance in Yield Curve Construction: Spot rates form the foundation of the yield curve, which shows the relationship between interest rates (yields) and different maturities. The spot yield curve, constructed from zero-coupon bond yields, allows analysts to view the term structure of interest rates over time.
Spot Rate Curve Construction: Constructing a spot rate curve requires calculating the spot rate for each maturity based on observed bond prices. Typically, one can use bonds with a series of cash flows (such as Treasury securities) and then calculate the spot rates using bootstrapping. Bootstrapping is a method that sequentially derives spot rates for each maturity by solving for the yield that equates the bond’s price to the present value of its cash flows.
Applications in Bond Valuation: Spot rates are critical in bond valuation as they are used to discount each cash flow of a bond individually, providing a more accurate valuation than simply using a bond’s yield to maturity (YTM). By using the spot rate for each cash flow, analysts can determine the present value of future cash flows and, therefore, the fair value of the bond. This approach is particularly useful for bonds with varying cash flows and helps assess interest rate risk for specific maturities
Par Rate and Par Curve
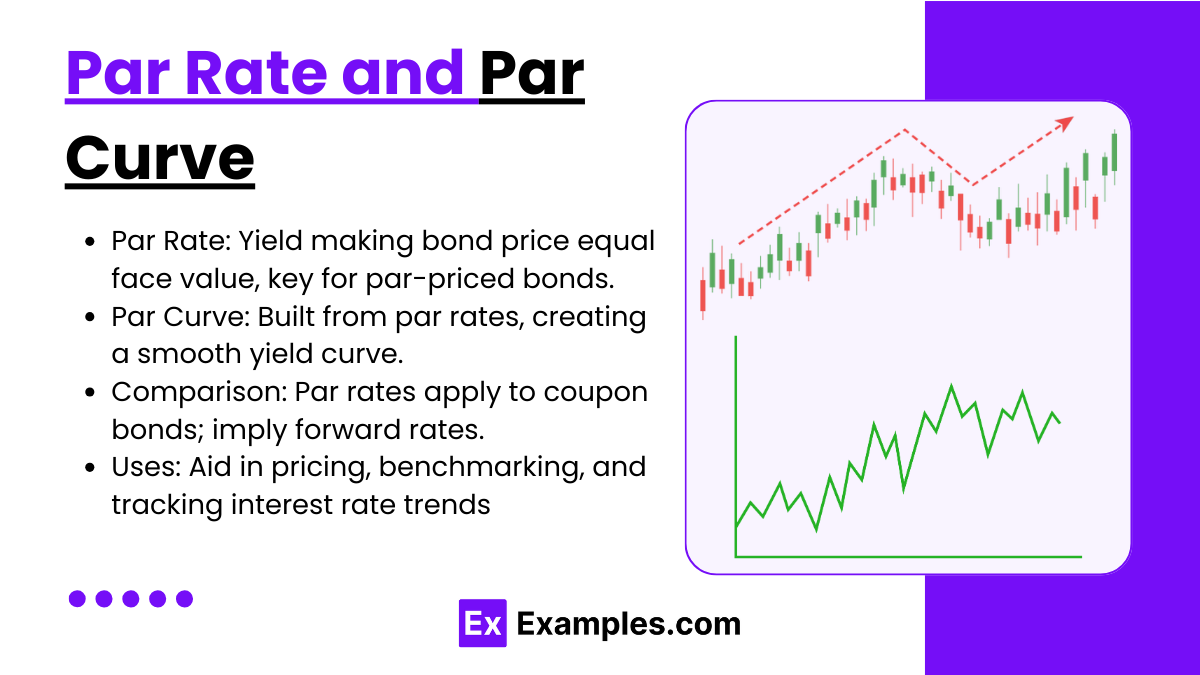
Definition and Characteristics of Par Rates: Par rates are the yields at which a bond’s price equals its face or par value. In other words, the par rate is the coupon rate that makes the present value of a bond’s cash flows (coupons and principal repayment) equal to its current market price when the bond is issued or trading at par. These rates are crucial in fixed-income markets as they represent the return required by investors for bonds priced at par.
Constructing the Par Curve: The par curve is constructed by identifying the par rates across different maturities. These rates are typically derived from actively traded bonds with prices near par or from hypothetical bonds that would trade at par if issued. Each point on the par curve represents the par rate for a bond with a specific maturity. Constructing the par curve involves aligning observed yields on bonds priced close to par for each maturity, creating a smooth curve across maturities.
Comparison with Spot and Forward Curves: Unlike the spot rate curve, which discounts each cash flow individually, the par curve reflects yields where the entire bond trades at par. While the spot curve is based on zero-coupon bond yields, the par curve relates to coupon-paying bonds at par value, making it useful for pricing newly issued bonds. Additionally, the par curve can imply forward rates, which represent future yields expected by the market.
Applications of Par Rates in Fixed-Income Analysis: Par rates are useful in bond pricing, yield curve analysis, and market benchmarking. For example, the par curve is often used as a benchmark for assessing the yields of bonds with similar maturities. Par rates also aid in understanding shifts in yield curves over time, making them valuable for tracking interest rate movements and changes in economic expectations. Since par rates simplify pricing by equating bond values to par, they help investors and analysts more readily compare fixed-income securities
Forward Rates and Forward Rate Curve
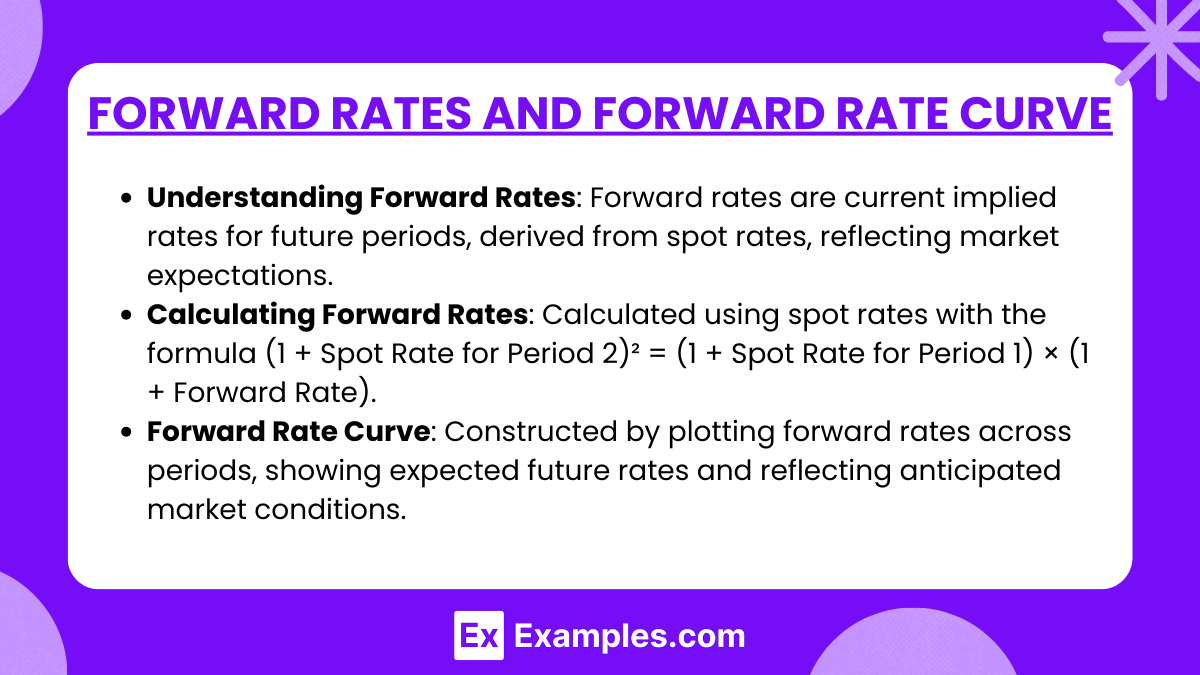
Understanding Forward Rates: Forward rates are the interest rates implied today for future periods based on the current yield curve. They represent the rate at which an investor can lock in a return for a specific period in the future. For example, the one-year forward rate starting two years from today is the interest rate an investor would pay or receive for a one-year loan that begins two years from now. Forward rates are derived from spot rates and provide insight into the market’s expectations about future interest rates.
Calculating Forward Rates: Forward rates can be calculated using spot rates for various maturities. For example, if you know the spot rate for a one-year bond and a two-year bond, you can calculate the implied one-year forward rate starting one year from now. This process uses the formula:(1 + Spot Rate for Period 2)² = (1 + Spot Rate for Period 1) × (1 + Forward Rate)
This approach helps determine the forward rate between two periods based on the current term structure. Calculating forward rates is especially valuable in financial forecasting and can be extended to any number of periods.
Constructing the Forward Rate Curve: The forward rate curve is built by plotting forward rates for various future periods, resulting in a curve that represents expected future rates. Each point on the forward rate curve shows the implied rate for a future period. Unlike the spot and par curves, which represent yields on bonds for today’s terms, the forward curve shows rates expected for future periods, capturing anticipated changes in market conditions.
Applications of Forward Rates in Investment and Risk Management: Forward rates are widely used in investment strategy and risk management. They provide insights into market expectations about future interest rates, which can influence portfolio management, particularly in bond portfolios and interest rate-sensitive assets. For instance, if the forward curve is upward-sloping, it suggests that interest rates are expected to rise, potentially impacting investment decisions in fixed-income securities. Moreover, forward rates are used to price forward contracts and interest rate swaps, which allow investors to hedge against or speculate on future interest rate movements
Yield Curve Analysis and Economic Indicators
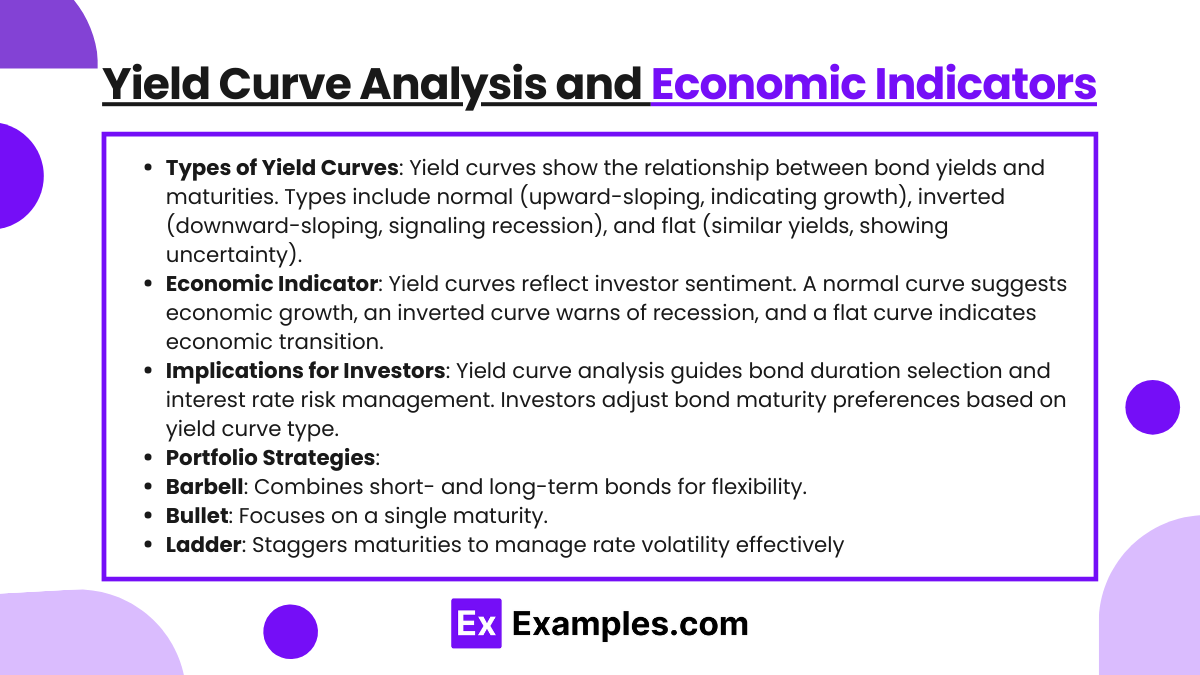
Types of Yield Curves: Yield curves graphically represent the relationship between bond yields and their maturities. The three main types of yield curves are normal (upward-sloping), inverted (downward-sloping), and flat.
- Normal Yield Curve: An upward-sloping curve, indicating that longer-term bonds have higher yields than shorter-term bonds. This shape usually reflects stable economic growth and expectations of moderate inflation, where investors demand a higher return for longer-term investments.
- Inverted Yield Curve: A downward-sloping curve, where short-term yields are higher than long-term yields, often signals an economic slowdown or recession. Inverted curves occur when investors expect future interest rates to fall, perhaps due to an anticipated decline in economic activity.
- Flat Yield Curve: Indicates similar yields across various maturities, suggesting uncertainty about the economic outlook. Flat curves can appear during transitions between economic growth and contraction, signaling investor indecision about future interest rate direction.
Yield Curve as an Economic Indicator: The yield curve is one of the most reliable indicators of economic conditions, as it reflects investor sentiment about future interest rates and economic growth.
- Normal Curve and Economic Growth: A normal curve is generally associated with a healthy, growing economy, as it indicates that investors expect stable returns over time.
- Inverted Curve and Recession Signal: Historically, an inverted yield curve has been a leading indicator of economic recessions, as it reflects expectations of slowing growth or contraction.
- Flat Curve and Economic Transition: A flat yield curve often occurs during periods of economic transition, signaling uncertainty about future economic direction.
Implications for Investors: Yield curve analysis is critical for assessing interest rate risk and economic outlook. Investors and analysts use yield curves to make strategic decisions about portfolio duration, selecting bonds with maturities that align with their interest rate expectations.
- Duration Matching: By selecting bonds with durations that align with expected economic conditions, investors can manage interest rate risk more effectively.
- Bond Selection: Investors may prefer shorter- or longer-term bonds based on their interest rate and economic expectations. For example, in an environment with an inverted yield curve, short-term bonds may be more attractive due to higher yields.
Applications in Risk Management and Portfolio Strategy: Yield curves are fundamental to managing interest rate exposure in fixed-income portfolios. Portfolio managers use yield curve positioning (such as barbell, ladder, or bullet strategies) to respond to changes in the curve’s shape, allowing them to mitigate risks or take advantage of expected movements. For example:
- Barbell Strategy: Investing in both short- and long-term bonds, which can offer flexibility in changing rate environments.
- Bullet Strategy: Focusing on bonds with a specific maturity that aligns with a projected interest rate environment.
- Ladder Strategy: Investing in bonds with staggered maturities to reduce exposure to interest rate volatility
Examples
Example 1
An investor is analyzing a two-year zero-coupon bond priced at $940 and a one-year zero-coupon bond priced at $980. The investor calculates the spot rate for year one by finding the yield on the one-year bond and then uses this rate to calculate the implied forward rate for the second year using both bonds’ prices. This approach allows the investor to understand expected future rates based on the term structure.
Example 2
A financial analyst is constructing a par curve for a range of bonds with maturities from one to ten years. Each bond in this set is priced at par, with coupon rates equal to the par rates for their respective maturities. By plotting these par rates across different maturities, the analyst develops a par yield curve, which serves as a benchmark for comparing other fixed-income securities.
Example 3
A bond trader wants to calculate the forward rate for a loan starting one year from now and lasting one year. Using the spot rate for a one-year bond and a two-year bond, the trader applies the formula for forward rates to estimate the expected rate for the loan. This calculation allows the trader to understand future rate expectations and align their investment strategy accordingly.
Example 4
A portfolio manager is interested in forecasting potential economic changes and decides to analyze the yield curve’s shape. Observing an inverted yield curve (where long-term rates are lower than short-term rates), the manager interprets this as a potential signal of an economic slowdown. The yield curve’s structure informs the manager’s decision to focus on short-duration bonds to reduce exposure to interest rate risk.
Example 5
An economist examines the spot and forward curves to assess the market’s inflation expectations. By comparing the spot curve, which reflects current rates for each maturity, with the forward curve, which shows expected future rates, the economist identifies whether inflationary or deflationary trends are anticipated. This analysis aids in forming projections on interest rate policy and its potential economic impacts
Practice Questions
Question 1
What does a forward rate represent in the term structure of interest rates?
A. The interest rate for a loan starting today and lasting for one year
B. The yield on a bond that matures today
C. The interest rate implied today for a loan or investment starting in the future
D. The coupon rate of a bond issued at par value
Answer: C
Explanation: A forward rate represents the interest rate implied today for a loan or investment that will begin in the future. It reflects the market’s expectations for future interest rates based on current spot rates. Options A, B, and D are incorrect because they do not pertain to future rates implied by the term structure.
Question 2
Which of the following statements best describes a par curve?
A. It is a yield curve constructed using the yields of zero-coupon bonds only.
B. It represents the yields of hypothetical bonds trading at par across different maturities.
C. It shows the forward rates for loans beginning at different future dates.
D. It is a yield curve showing the relationship between bond duration and yield.
Answer: B
Explanation: A par curve represents the yields of hypothetical bonds that would trade at par for different maturities. It is constructed to provide a benchmark for bonds issued at par value. Option A describes a spot rate curve, C refers to a forward rate curve, and D does not describe the par curve specifically.
Question 3
An investor wants to calculate the one-year forward rate beginning one year from today. If the one-year spot rate is 2% and the two-year spot rate is 3%, which of the following is closest to the one-year forward rate starting one year from now?
A. 2.5%
B. 3%
C. 4%
D. 5%
Answer: C
Explanation: The one-year forward rate starting one year from today can be calculated using the formula:(1 + Two-Year Spot Rate)² = (1 + One-Year Spot Rate) × (1 + Forward Rate)
Plugging in the values:(1 + 0.03)² = (1 + 0.02) × (1 + Forward Rate)
Solving for the forward rate gives approximately 4%. Options A, B, and D do not reflect the correct forward rate calculation

