Preparing for the CFA Exam requires a strong grasp of yield and yield spread measures for fixed-rate bonds, a fundamental topic in fixed-income analysis. Understanding yield calculations, spread metrics, and their implications on bond pricing and risk assessment is essential. This knowledge aids in evaluating bond investments and assessing credit quality.
Learning Objective
In studying “Yield and Yield Spread Measures for Fixed-Rate Bonds” for the CFA Exam, you should learn to analyze the various metrics that determine bond yields and their spreads, including yield to maturity, current yield, and yield spreads. Understand how these measures reflect the bond’s income generation, risk profile, and pricing relative to other securities. Evaluate different types of spreads, such as G-spreads and I-spreads, and assess their implications for bond valuation. Additionally, explore the factors influencing yield spreads, like credit risk and interest rate changes, and apply these concepts to real-world scenarios to enhance investment decision-making.
Understanding Bond Yields
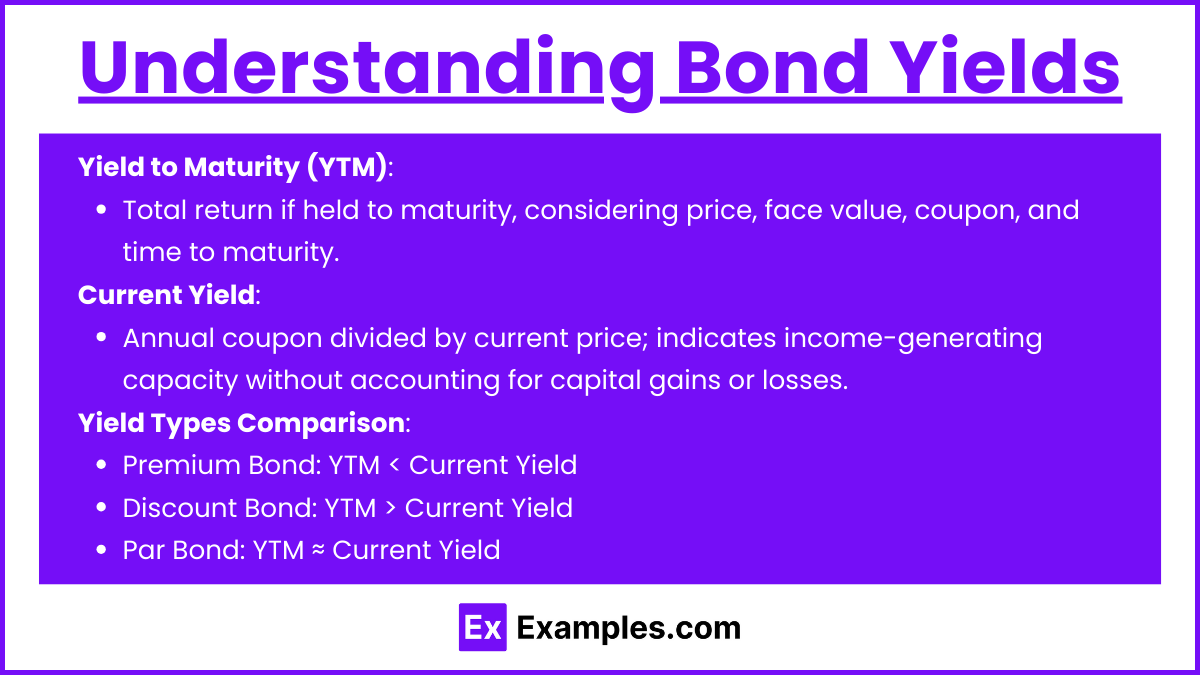
Bond yields are essential indicators of a bond’s potential return and are used to assess its value relative to other investments. Here are the key yield types relevant for fixed-rate bonds:
- Yield to Maturity (YTM): YTM represents the total return expected if the bond is held until maturity, assuming all coupon payments are reinvested at the same rate. It accounts for the bond’s current price, face value, coupon payments, and time to maturity. This measure helps investors compare bonds with different maturities and coupon structures on a consistent basis.
- Current Yield: The current yield is a straightforward calculation of the bond’s annual coupon payment divided by its current price. This yield type provides a snapshot of the bond’s income-generating capacity relative to its market price but does not account for capital gains or losses if the bond is held until maturity. It’s often used for assessing short-term cash flow potential.
- Yield Types Comparison: Understanding the relationship between YTM and current yield can indicate the bond’s pricing status:
- Premium Bond (Price > Par Value): YTM < Current Yield
- Discount Bond (Price < Par Value): YTM > Current Yield
- Par Bond (Price = Par Value): YTM ≈ Current Yield
Yield Spread Types and Their Significance
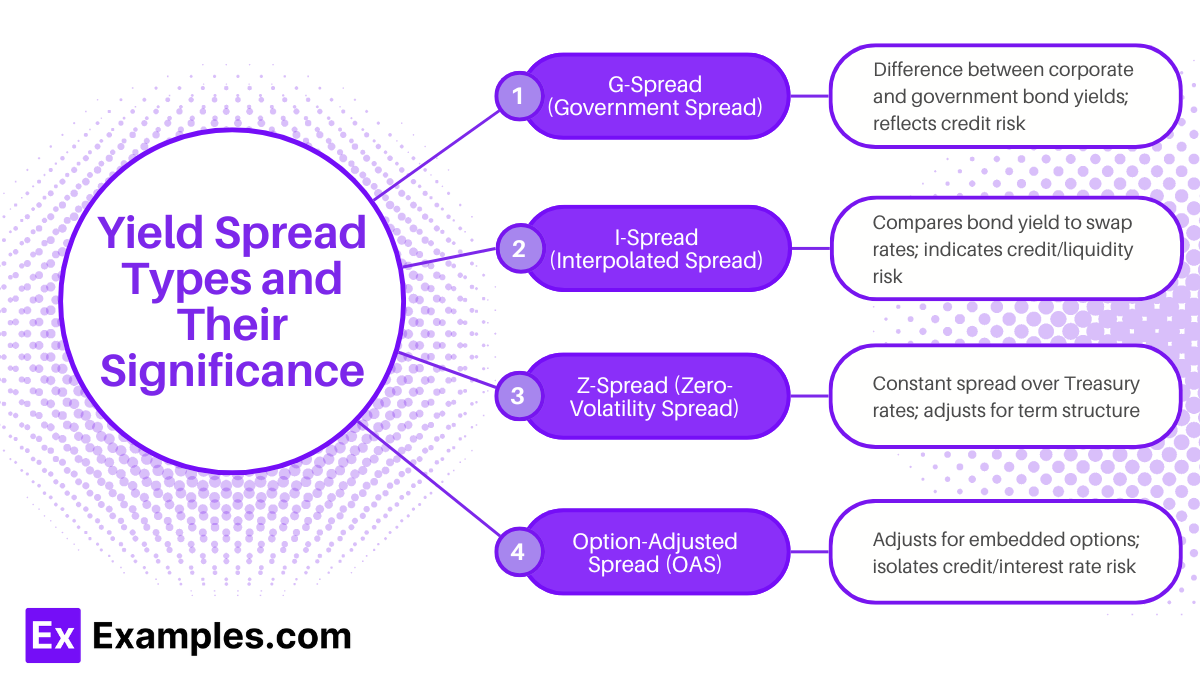
Yield spreads provide insights into the relative risk and return of bonds compared to benchmark rates or similar securities. They help investors gauge credit risk, market sentiment, and pricing differences across bonds. Here are the primary types of yield spreads relevant for fixed-rate bond analysis:
- G-Spread (Government Spread): G-spread measures the difference between a bond’s yield and the yield on a government bond of similar maturity. This spread reflects the additional credit risk of the corporate bond over a government bond, as government bonds are typically considered low-risk benchmarks. A wider G-spread indicates higher perceived credit risk for the bond relative to government securities.
- I-Spread (Interpolated Spread): I-spread compares a bond’s yield to swap rates instead of government yields. Because swap rates often reflect market interest rates, I-spread is useful for comparing bonds in the context of interest rate swaps, which are common in corporate finance and risk management. A larger I-spread signifies higher credit risk or liquidity risk relative to the swap curve.
- Z-Spread (Zero-Volatility Spread): Z-spread is the constant yield spread that, when added to each spot rate of the Treasury yield curve, equates the bond’s discounted cash flows to its current price. This spread helps account for term structure by adjusting for yield changes over the bond’s life, making it a valuable measure for analyzing bonds with varying maturities. A higher Z-spread indicates greater credit risk or potential yield advantage.
- Option-Adjusted Spread (OAS): OAS is used for bonds with embedded options, like callable or putable bonds. It adjusts the Z-spread by removing the value of the option from the yield, isolating the spread due to credit and interest rate risks. A wider OAS suggests that, after accounting for the embedded option, the bond carries higher risk or offers potentially higher returns than comparable bonds without options
Factors Influencing Yield Spreads
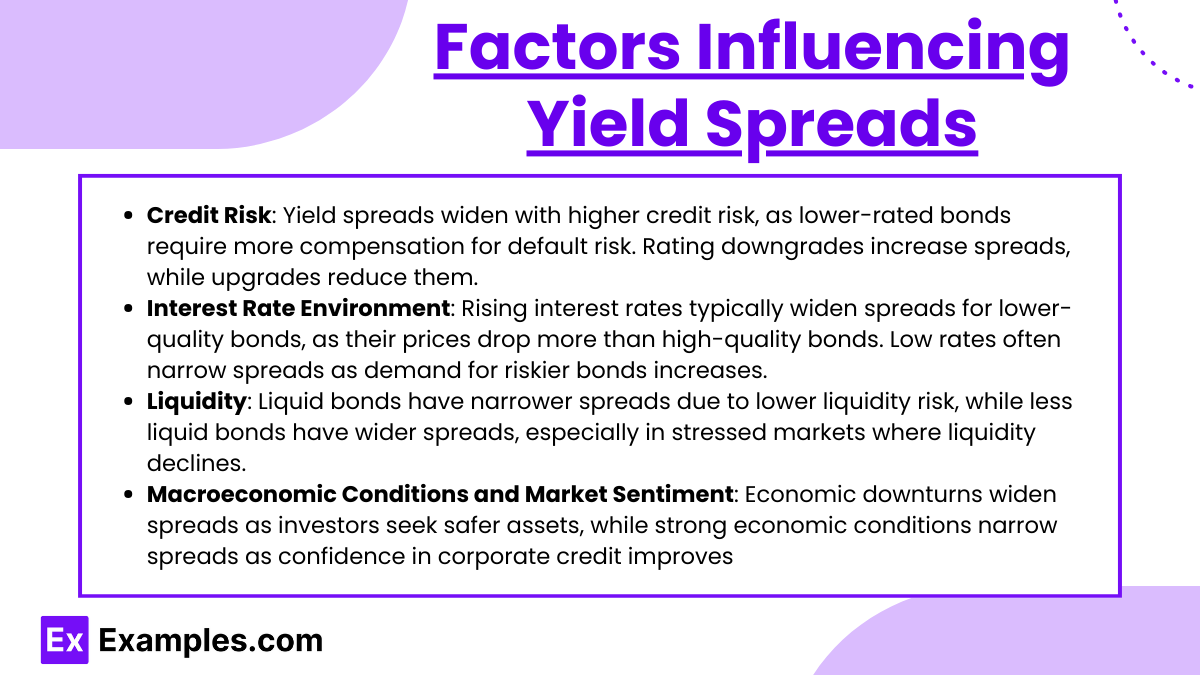
Yield spreads reflect a bond’s relative risk and market conditions. Several key factors influence these spreads, each providing insight into bond pricing and market sentiment. Here’s a breakdown of the main factors:
- Credit Risk: The most significant factor impacting yield spreads is the issuer’s creditworthiness. Bonds with lower credit ratings, such as high-yield or junk bonds, generally have wider spreads than investment-grade bonds to compensate investors for the increased default risk. A downgrade in an issuer’s credit rating or a rise in perceived default probability will widen spreads, while improvements in credit quality tend to narrow them.
- Interest Rate Environment: Interest rates play a major role in determining yield spreads. When interest rates rise, the prices of bonds with lower credit quality tend to drop more than those of high-quality bonds, often leading to a widening of yield spreads. Conversely, in a low-interest-rate environment, investors might seek higher yields from riskier bonds, narrowing spreads as demand increases.
- Liquidity: Bonds that are more liquid—those that trade frequently and easily—typically have narrower spreads, reflecting lower liquidity risk. Conversely, bonds with less trading activity often see wider spreads to compensate investors for potential difficulties in buying or selling. In times of market stress, liquidity generally decreases, leading to a broad widening of spreads, especially for less liquid bonds.
- Macroeconomic Conditions and Market Sentiment: Economic conditions and investor confidence impact yield spreads. During economic downturns or periods of uncertainty, investors often shift toward safer assets, widening spreads on riskier bonds as demand for them declines. Alternatively, during economic expansion or periods of strong market sentiment, spreads tend to narrow as confidence in corporate earnings and repayment abilities improves
Application of Yield and Spread Measures in Bond Valuation
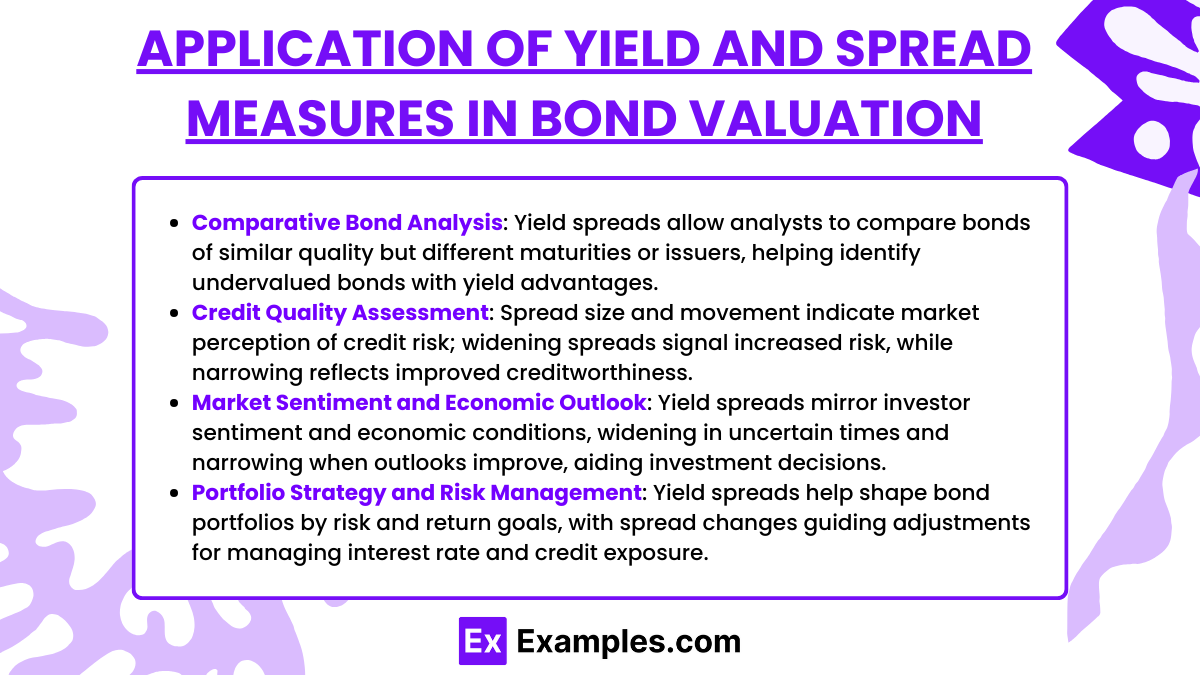
Yield and spread measures are essential tools in bond valuation, allowing investors to assess relative value, risk, and return. Here’s how these measures are applied:
- Comparative Bond Analysis: Yield spreads enable analysts to compare bonds of similar credit quality but different maturities or issuers. By examining the spread relative to benchmarks, investors can identify bonds offering higher yields for a given level of risk. This comparison helps pinpoint bonds that may be undervalued or offer a yield advantage over peers.
- Credit Quality Assessment: The size and movement of a bond’s spread provide insight into the market’s perception of the issuer’s creditworthiness. Widening spreads often indicate increasing credit risk or potential financial distress, while narrowing spreads suggest improved credit quality or reduced default risk. Monitoring spreads is crucial for anticipating credit rating changes and adjusting portfolio exposure accordingly.
- Market Sentiment and Economic Outlook: Yield spreads reflect investor sentiment and economic conditions. In times of uncertainty, yield spreads on lower-rated bonds typically widen as investors demand more compensation for perceived risk. Conversely, spreads narrow when the economic outlook is positive. This spread movement provides valuable context for assessing market conditions and potential investment opportunities.
- Portfolio Strategy and Risk Management: Investors use yield spreads to shape bond portfolios based on risk tolerance and return objectives. For example, a portfolio focused on high yield might favor bonds with wider spreads, targeting higher returns while accepting more risk. Additionally, tracking spread changes can guide portfolio adjustments, helping to manage interest rate risk and credit exposure effectively
Examples
Example 1: Calculating Yield to Maturity (YTM) for a Fixed-Rate Bond
A corporate bond with a face value of $1,000 and an annual coupon rate of 5% is trading at $950. The bond has 5 years remaining until maturity. To calculate the YTM, we determine the discount rate that equates the bond’s current price with the present value of its future cash flows (annual coupon payments and face value repayment). In this case, the YTM will be higher than the coupon rate, as the bond is purchased at a discount, reflecting the additional yield to compensate for the lower purchase price.
Example 2: Comparing G-Spread to Assess Relative Credit Risk
An investor is evaluating two corporate bonds with similar maturities: Bond A and Bond B. Bond A has a yield of 4.5%, while a government bond of the same maturity offers 3%. The G-Spread for Bond A is 1.5% (4.5% – 3%), which represents the additional yield over a risk-free government bond. If Bond B has a G-Spread of 2%, it suggests higher perceived credit risk or liquidity concerns relative to Bond A, as investors demand more yield compensation.
Example 3: Using Z-Spread for a Bond with Uneven Cash Flows
Consider a callable bond issued by a corporation with a 6% coupon rate and irregular cash flows due to potential early redemption. The Z-Spread helps isolate the bond’s credit risk by determining the constant spread added to each point on the Treasury yield curve to match the bond’s current price. For this bond, a Z-Spread of 1.8% reflects additional credit risk over government securities, adjusted for cash flow timing. If another bond with regular cash flows has a Z-Spread of 1.2%, it indicates that the callable bond carries higher risk.
Example 4: Evaluating Option-Adjusted Spread (OAS) on a Callable Bond
An investor is analyzing a callable bond with a yield of 5% and a current OAS of 1.3%. The OAS removes the effect of the bond’s call option, isolating the yield spread due solely to credit and interest rate risks. If a comparable bond without options has a similar spread, it confirms that the additional yield is due to the embedded call option. In this example, the OAS allows the investor to understand the bond’s pure credit risk, distinguishing it from the impact of potential early redemption.
Example 5: Assessing Market Sentiment through Yield Spread Changes
A high-yield bond issued by a tech company has seen its yield spread widen from 3% to 5% over the past month. This spread widening suggests increased perceived risk, likely due to market concerns over the company’s financial health or broader economic uncertainties affecting tech stocks. Investors may interpret this as a sign of deteriorating credit quality, leading to higher yields as compensation for the additional risk. Conversely, if the spread narrows, it may indicate improved investor confidence in the company’s ability to meet its obligationsExample 1: Calculating Yield to Maturity (YTM) for a Fixed-Rate Bond
A corporate bond with a face value of $1,000 and an annual coupon rate of 5% is trading at $950. The bond has 5 years remaining until maturity. To calculate the YTM, we determine the discount rate that equates the bond’s current price with the present value of its future cash flows (annual coupon payments and face value repayment). In this case, the YTM will be higher than the coupon rate, as the bond is purchased at a discount, reflecting the additional yield to compensate for the lower purchase price.
Example 2: Comparing G-Spread to Assess Relative Credit Risk
An investor is evaluating two corporate bonds with similar maturities: Bond A and Bond B. Bond A has a yield of 4.5%, while a government bond of the same maturity offers 3%. The G-Spread for Bond A is 1.5% (4.5% – 3%), which represents the additional yield over a risk-free government bond. If Bond B has a G-Spread of 2%, it suggests higher perceived credit risk or liquidity concerns relative to Bond A, as investors demand more yield compensation.
Example 3: Using Z-Spread for a Bond with Uneven Cash Flows
Consider a callable bond issued by a corporation with a 6% coupon rate and irregular cash flows due to potential early redemption. The Z-Spread helps isolate the bond’s credit risk by determining the constant spread added to each point on the Treasury yield curve to match the bond’s current price. For this bond, a Z-Spread of 1.8% reflects additional credit risk over government securities, adjusted for cash flow timing. If another bond with regular cash flows has a Z-Spread of 1.2%, it indicates that the callable bond carries higher risk.
Example 4: Evaluating Option-Adjusted Spread (OAS) on a Callable Bond
An investor is analyzing a callable bond with a yield of 5% and a current OAS of 1.3%. The OAS removes the effect of the bond’s call option, isolating the yield spread due solely to credit and interest rate risks. If a comparable bond without options has a similar spread, it confirms that the additional yield is due to the embedded call option. In this example, the OAS allows the investor to understand the bond’s pure credit risk, distinguishing it from the impact of potential early redemption.
Example 5: Assessing Market Sentiment through Yield Spread Changes
A high-yield bond issued by a tech company has seen its yield spread widen from 3% to 5% over the past month. This spread widening suggests increased perceived risk, likely due to market concerns over the company’s financial health or broader economic uncertainties affecting tech stocks. Investors may interpret this as a sign of deteriorating credit quality, leading to higher yields as compensation for the additional risk. Conversely, if the spread narrows, it may indicate improved investor confidence in the company’s ability to meet its obligations
Practice Questions
Question 1
A bond has a yield to maturity (YTM) of 6% and is currently trading at a discount. Which of the following statements is most likely true about this bond?
A. The bond’s coupon rate is less than 6%.
B. The bond’s coupon rate is exactly 6%.
C. The bond’s current yield is higher than its coupon rate.
D. The bond’s YTM is lower than its coupon rate.
Answer: A. The bond’s coupon rate is less than 6%.
Explanation: When a bond trades at a discount, its YTM is higher than its coupon rate because the bondholder gains a price appreciation in addition to receiving coupon payments. Therefore, if the bond’s YTM is 6%, the coupon rate must be less than 6% to result in a discount price.
Question 2
An investor compares two bonds: Bond X and Bond Y. Both have similar maturities, but Bond X has a yield of 5.5%, and Bond Y has a yield of 4.8%. The government bond of the same maturity has a yield of 3%. Which statement is correct about the spreads of these bonds?
A. Bond X has a G-spread of 1.8%.
B. Bond Y has a G-spread of 1.5%.
C. Bond Y has a wider G-spread than Bond X.
D. Bond X has a spread of 2.5% over the government bond.
Answer: A. Bond X has a G-spread of 1.8%.
Explanation: The G-spread is calculated by subtracting the yield of the government bond from the yield of the corporate bond. For Bond X, this is 5.5% – 3% = 1.8%. For Bond Y, the G-spread would be 4.8% – 3% = 1.8%, not 1.5%. Therefore, only option A is correct.
Question 3
Which of the following best describes the purpose of the Z-spread when analyzing a bond?
A. It calculates the bond’s additional yield over a government bond benchmark.
B. It adjusts for the bond’s embedded option, separating credit risk from option risk.
C. It represents a constant yield added to each Treasury spot rate to match the bond’s price.
D. It indicates the current yield based on the bond’s annual coupon and market price.
Answer: C. It represents a constant yield added to each Treasury spot rate to match the bond’s price.
Explanation: The Z-spread (zero-volatility spread) is the constant spread added to each point on the Treasury spot rate curve to equate the present value of the bond’s cash flows to its current price. This spread isolates the credit risk of the bond without adjusting for embedded options, distinguishing it from measures like OAS.

