The Financial Statement Analysis is fundamental to evaluating a company's performance and financial health. You’ll delve into ratio analysis, trend analysis, and comparative financial analysis, essential tools for assessing profitability, liquidity, and solvency. Understanding these analytical techniques is crucial for decision-making and strategic planning, as they provide insights into operational efficiency and potential risks. Mastery of these concepts is key to excelling in the Financial Planning, Performance, and Analytics section of the exam.
Learning Objectives
In studying "Financial Statement Analysis" for the CMA, you should learn to interpret and analyze the components of financial statements, including the balance sheet, income statement, and cash flow statement. Understand how to assess a company’s financial health by calculating and evaluating key financial ratios, such as profitability, liquidity, solvency, and efficiency ratios. Analyze trends over time to identify patterns in performance and detect potential red flags. Evaluate the impact of different accounting methods and policies on financial results. Additionally, develop skills to interpret financial statements from a managerial perspective, using insights to support decision-making, planning, and control in a business context.
Interpreting and Analyzing Financial Statements
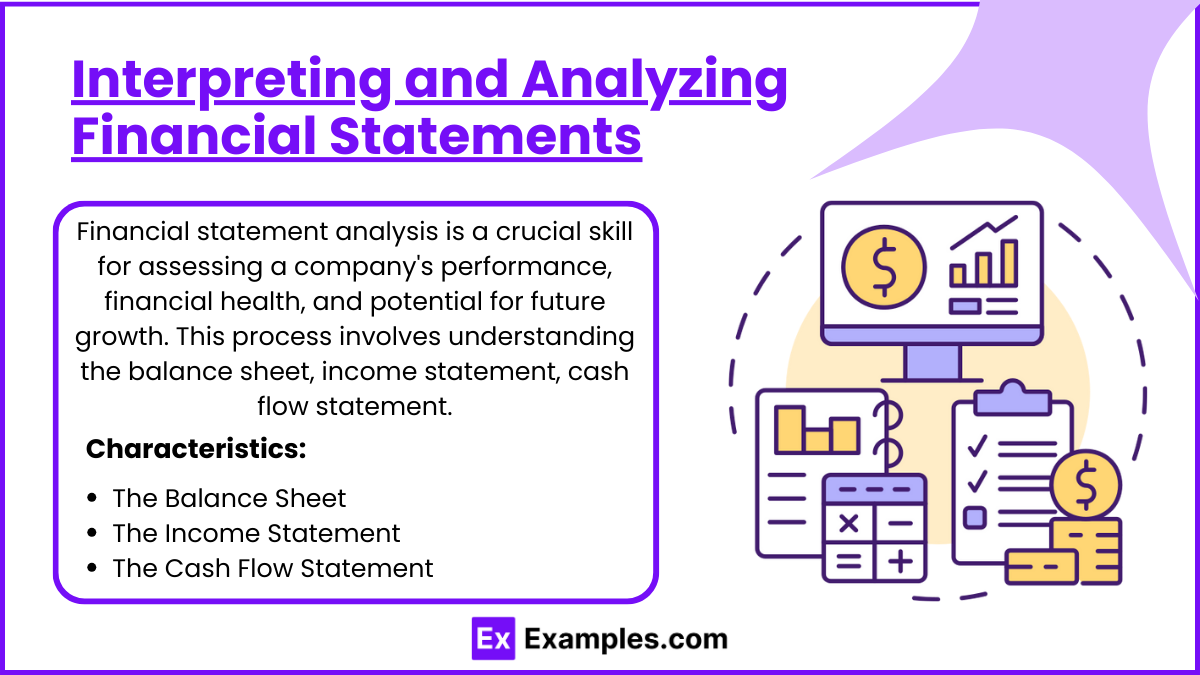
Financial statement analysis is a crucial skill for assessing a company's performance, financial health, and potential for future growth. This process involves understanding the balance sheet, income statement, cash flow statement, and statement of shareholders’ equity. Each financial statement provides unique insights, and together, they offer a comprehensive view of the company’s financial position.
Characteristics
1. The Balance Sheet
The balance sheet shows a company’s assets, liabilities, and shareholders' equity at a specific point in time.
Key Components:
Assets: Resources owned by the company, such as cash, inventory, and property.
Liabilities: Obligations owed to creditors, including loans and accounts payable.
Shareholders’ Equity: The owners' claim on the company's assets after liabilities are settled.
Analysis Focus:
Liquidity Ratios: Current ratio, quick ratio, and cash ratio help evaluate the company’s ability to cover short-term obligations.
Leverage Ratios: Debt-to-equity ratio and debt ratio provide insights into the company’s financing structure and risk level.
Example: A current ratio of 2.0 means the company has 1 in current liabilities, suggesting strong liquidity.
2. The Income Statement
The income statement (or profit and loss statement) details revenues, expenses, and profits over a period, providing insights into operational performance.
Key Components:
Revenue: Total sales or income from operations.
Cost of Goods Sold (COGS): Direct costs of producing goods sold.
Operating Expenses: General expenses such as salaries, rent, and utilities.
Net Income: Profit after all expenses are deducted.
Analysis Focus:
Profitability Ratios: Gross margin, operating margin, and net profit margin reveal the company’s ability to generate profit relative to sales and control costs.
Trend Analysis: Comparing year-over-year revenue growth and expense trends helps identify patterns in business performance.
Example: A net profit margin of 10% indicates the company retains $0.10 as profit for every dollar of revenue.
3. The Cash Flow Statement
The cash flow statement shows cash inflows and outflows from operating, investing, and financing activities, providing insights into the company’s cash management.
Key Components:
Operating Activities: Cash generated from core business operations.
Investing Activities: Cash used for asset purchases or received from asset sales.
Financing Activities: Cash from issuing or repurchasing shares and from borrowing or repaying debt.
Analysis Focus:
Cash Flow from Operations (CFO): Positive CFO indicates the company generates enough cash from core operations to sustain itself.
Free Cash Flow (FCF): Calculated as CFO minus capital expenditures, FCF shows available cash after necessary investments, useful for expansion or dividends.
Example: A company with consistent positive free cash flow is financially healthy and may be able to grow or pay dividends.
Assessing Financial Health Using Key Financial Ratios
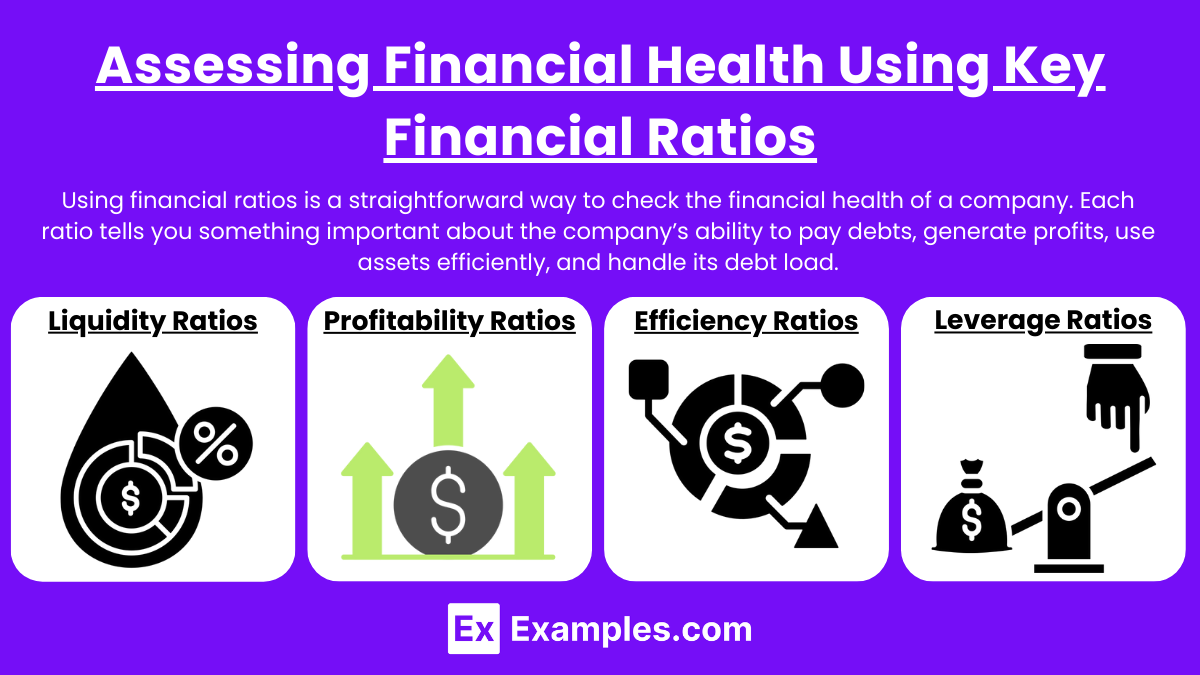
Using financial ratios is a straightforward way to check the financial health of a company. Each ratio tells you something important about the company’s ability to pay debts, generate profits, use assets efficiently, and handle its debt load. Here’s a simple breakdown:
1. Liquidity Ratios
These ratios show if the company can cover its short-term debts and have enough cash or assets to keep running smoothly.
Current Ratio: Checks if the company has enough assets to cover its short-term debts. Higher values mean better financial stability.
Quick Ratio: Similar to the current ratio, but only considers the most liquid assets (like cash and receivables) without relying on inventory. This is helpful to see how quickly the company can meet its obligations.
Example: If a company’s current ratio is high, it means they have enough resources to manage any immediate bills.
2. Profitability Ratios
Profitability ratios measure how well a company makes money compared to its sales, assets, or equity.
Gross Profit Margin: Shows how much of each dollar earned is left after covering production costs. A higher margin means more efficiency in production.
Net Profit Margin: Tells how much profit remains after all expenses. The higher the net margin, the better the company is at controlling costs and making a profit.
Return on Assets (ROA): Indicates how effectively the company uses its assets to generate profit. Higher ROA means better asset use.
Return on Equity (ROE): Shows how much profit the company generates from shareholders’ equity. A higher ROE suggests strong returns for investors.
Example: If a company has a high net profit margin, it’s keeping more money as profit after covering all costs, which is a good sign of profitability.
3. Efficiency Ratios
These ratios reveal how well a company manages its assets and operations.
Asset Turnover Ratio: Measures how effectively the company uses its assets to generate sales. A higher ratio means the company is making good use of its assets.
Inventory Turnover Ratio: Shows how quickly the company sells its inventory. Higher turnover indicates strong sales or effective inventory management.
Days Sales Outstanding (DSO): Tells how long it takes the company to collect money from sales. A lower DSO means faster cash collection, which is good for cash flow.
Example: If the inventory turnover ratio is high, it means the company is good at selling its products quickly, which helps avoid excess stock.
4. Leverage Ratios
Leverage ratios measure how much debt the company has and how well it can manage that debt.
Debt-to-Equity Ratio: Shows how much debt the company uses compared to its equity. A high ratio means the company relies more on debt, which can be risky.
Interest Coverage Ratio: Tells if the company can easily pay its interest expenses with its current earnings. A higher ratio means the company is in a better position to handle debt.
Example: A high interest coverage ratio means the company makes enough earnings to comfortably cover its interest payments, indicating low risk from debt.
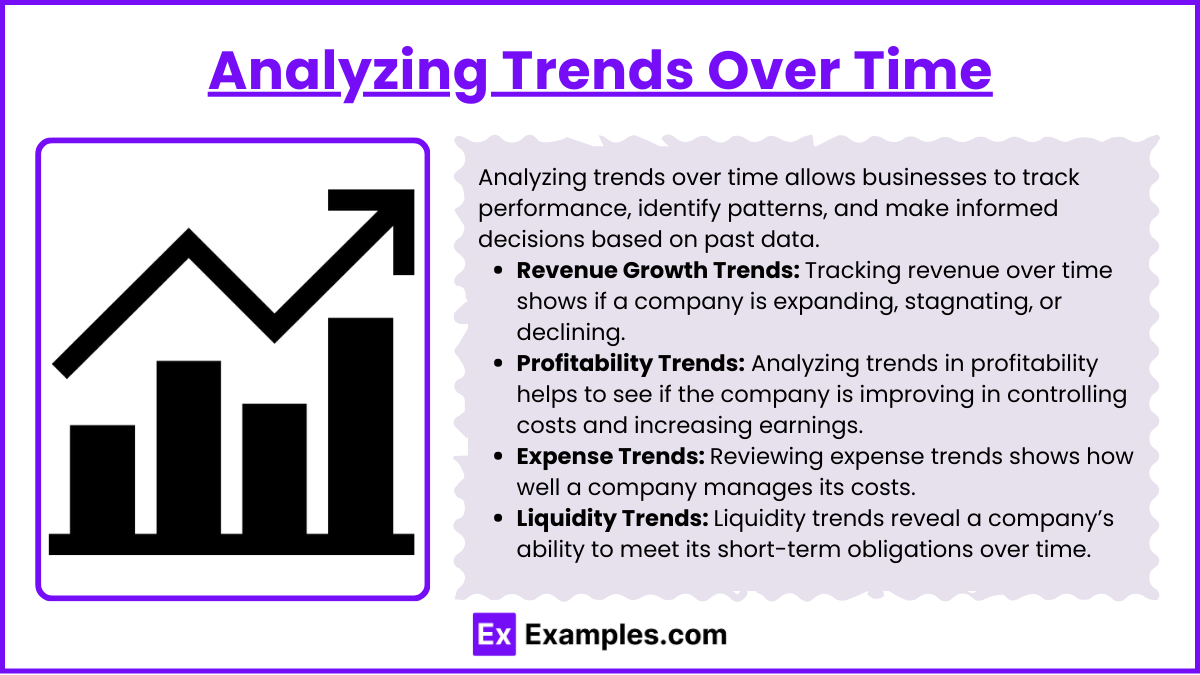
Analyzing Trends Over Time
Analyzing trends over time allows businesses to track performance, identify patterns, and make informed decisions based on past data. By reviewing financial statements and other key metrics over several periods, companies can understand how well they are growing, managing costs, and staying competitive.
1. Revenue Growth Trends
Tracking revenue over time shows if a company is expanding, stagnating, or declining.
Increasing Revenue: Signals growth and potentially a growing customer base or higher prices.
Decreasing Revenue: Could indicate shrinking demand, competitive pressures, or ineffective sales strategies.
Example: A company’s revenue increases by 10% each year for three years, signaling consistent growth.
2. Profitability Trends
Analyzing trends in profitability helps to see if the company is improving in controlling costs and increasing earnings.
Gross and Net Profit Margins: Rising profit margins suggest better cost management or higher pricing power. Declining margins could mean increased costs or lower pricing power.
Operating Income Trends: Increasing operating income shows that the core business is generating more profit, while declining trends could mean rising operational costs or decreased efficiency.
Example: A company’s net profit margin improves from 8% to 12% over five years, indicating better profitability.
3. Expense Trends
Reviewing expense trends shows how well a company manages its costs.
Cost of Goods Sold (COGS): Monitoring COGS over time helps in assessing efficiency in production or supply chain. Stable or decreasing COGS relative to revenue growth is a good sign.
Operating Expenses: If operating expenses grow faster than revenue, it may indicate inefficient cost management or rapid expansion.
Example: If operating expenses as a percentage of revenue decrease each year, it shows improved cost management.
4. Liquidity Trends
Liquidity trends reveal a company’s ability to meet its short-term obligations over time.
Current Ratio Trends: Increasing current ratio suggests growing liquidity, while a declining trend might signal cash flow issues.
Cash Flow Trends: Regularly increasing cash flow from operations shows strong financial health, while declining cash flow may indicate problems in generating enough cash to support operations.
Example: A current ratio increasing steadily over three years may show the company is building a stronger financial position.
Impact of Accounting Methods and Policies on Financial Results
The choice of accounting methods and policies can significantly impact a company’s financial results, including revenue, expenses, assets, and liabilities. Decisions about how to recognize revenue, value inventory, and depreciate assets influence the appearance of financial health and profitability. Understanding these impacts helps stakeholders interpret financial statements more accurately.
Characteristics
1. Revenue Recognition
How a company chooses to recognize revenue affects reported income and timing of earnings.
Accrual vs. Cash Accounting:
Accrual Method: Revenue is recorded when earned, regardless of when cash is received, resulting in a smoother income pattern.
Cash Method: Revenue is recorded when cash is received, which can create fluctuations in reported income based on cash flow.
Revenue Recognition Policies: Long-term contracts can use percentage-of-completion (revenue recognized gradually) or completed-contract (revenue recognized at the end) methods. Percentage-of-completion tends to show steadier income, while completed-contract may show volatility.
Example: A construction company using percentage-of-completion reports income gradually over the project timeline, providing a more consistent earnings view.
2. Inventory Valuation Methods
Inventory valuation affects cost of goods sold (COGS), gross profit, and net income.
FIFO (First-In, First-Out): Assumes oldest inventory is sold first. In times of rising prices, FIFO results in lower COGS and higher reported profit, as older (cheaper) inventory is matched against current sales.
LIFO (Last-In, First-Out): Assumes newest inventory is sold first. When prices rise, LIFO results in higher COGS and lower profits, which can lower taxes.
Weighted Average Cost: Smooths out price fluctuations by averaging inventory costs, resulting in more stable COGS over time.
Example: A retail company using FIFO during inflation shows higher profits than it would with LIFO, due to lower COGS from older, less expensive inventory.
3. Depreciation Methods
Depreciation policies impact reported income, asset values, and tax obligations.
Straight-Line Depreciation:
Spreads the cost of an asset evenly over its useful life, resulting in consistent depreciation expense each period. This method stabilizes expenses and provides predictable income.
Accelerated Depreciation (e.g., Double-Declining Balance):
Recognizes higher depreciation expenses in the early years of an asset's life, which lowers early-year profits and taxes. Later, as depreciation expense decreases, reported income increases.
Example: A company using accelerated depreciation shows lower profits in early years but benefits from tax savings. Later on, profitability appears higher as depreciation expense declines.
4. Expense Recognition Policies
The way companies recognize expenses affects net income and financial health perception.
Capitalization vs. Expensing:
Capitalizing a cost means treating it as an asset, spreading it over several periods (e.g., capitalizing R&D expenses or software development costs). This approach boosts short-term profits as the expense is deferred.
Expensing a cost immediately reduces current-period profits but shows a more conservative view of earnings.
Example: A tech company capitalizing software development costs shows higher current profits than if it had expensed these costs immediately.
Examples
Example 1: Trend Analysis of Revenue
A company’s revenue growth over several years can be analyzed through trend analysis, which involves reviewing the income statements over a period of time. For instance, if a technology company has shown consistent annual revenue growth of 10% over the last five years, it may indicate a strong market position and effective sales strategies. Analysts can use this trend to forecast future revenue and assess the sustainability of the company’s growth.
Example 2: Liquidity Ratios Assessment
Analysts often evaluate a company's liquidity by calculating ratios such as the current ratio and quick ratio, derived from the balance sheet. For example, if a retail company has a current ratio of 2.5, it means it has sufficient current assets to cover its current liabilities. This assessment is crucial for understanding the company's ability to meet short-term obligations and indicates financial health, especially in industries with high inventory turnover.
Example 3: Profitability Analysis
Financial statement analysis includes examining profitability ratios, such as gross margin, operating margin, and net profit margin. For instance, a manufacturing company with a gross margin of 40% shows that it retains 40 cents of profit for every dollar of sales after covering the cost of goods sold. Analyzing these margins over time helps stakeholders gauge how effectively the company controls costs and generates profit.
Example 4: Debt-to-Equity Ratio EvaluationExample 1:
The debt-to-equity ratio from the balance sheet provides insights into a company’s financial leverage. For example, a ratio of 1.0 indicates that the company has equal amounts of debt and equity financing. Analysts assess this ratio to determine the risk associated with the company's capital structure. A high debt-to-equity ratio might suggest greater financial risk, especially in volatile markets, while a lower ratio may indicate a more conservative approach to financing.
Example 5: Cash Flow Analysis
Examining the cash flow statement allows analysts to assess the cash generated from operating, investing, and financing activities. For example, if a company consistently generates positive cash flow from operations, it suggests strong underlying business performance. Conversely, if cash flow from operations is negative but financing activities show significant inflows, it could indicate that the company is relying on external funding rather than generating its own cash, raising concerns about sustainability. This analysis is critical for understanding the liquidity and operational efficiency of a business.
Practice Questions
Question 1
What is the primary purpose of financial statement analysis?
A) To prepare tax returns
B) To evaluate a company’s financial performance and position
C) To calculate employee salaries
D) To assess the effectiveness of marketing strategies
Correct Answer: B) To evaluate a company’s financial performance and position.
Explanation: The primary purpose of financial statement analysis is to assess a company's financial performance and position over time. This involves examining the income statement, balance sheet, and cash flow statement to understand profitability, liquidity, and solvency. This analysis helps stakeholders, including investors and creditors, make informed decisions about the company. Options A, C, and D are related to specific operational tasks but do not capture the broader goal of financial statement analysis.
Question 2
Which of the following ratios is commonly used to measure a company's liquidity?
A) Return on equity
B) Price-to-earnings ratio
C) Current ratio
D) Debt-to-equity ratio
Correct Answer: C) Current ratio.
Explanation: The current ratio is a key measure of a company's liquidity, indicating its ability to meet short-term obligations with its current assets. It is calculated by dividing current assets by current liabilities. A higher current ratio suggests better liquidity, enabling the company to cover its short-term debts. Options A, B, and D focus on profitability and financial leverage rather than liquidity.
Question 3
What does a negative trend in a company's net income over several years typically indicate?
A) Improved operational efficiency
B) Increased market share
C) Potential financial distress
D) Successful product launches
Correct Answer: C) Potential financial distress.
Explanation: A negative trend in net income over several years often signals potential financial distress for a company. Consistent losses can lead to cash flow issues, making it challenging to meet obligations and invest in future growth. While there could be temporary factors at play, a sustained decline in net income usually raises red flags for investors and analysts, suggesting that the company may need to reassess its operations and strategies. Options A, B, and D imply positive outcomes that are inconsistent with a negative trend in profitability.

