The VIX Index, often referred to as the “fear gauge,” is a critical measure of market sentiment and expected volatility, particularly within the options market. This topic explores the mechanics of the VIX, its calculation based on S&P 500 index options, and its role as an indicator of market uncertainty. Understanding how the VIX reflects investor expectations for future volatility is essential for technical analysis, as it provides insight into market risk sentiment. Mastery of the VIX Index enables analysts to interpret shifts in market mood, aiding in the development of informed trading and risk management strategies.
Learning Objectives
In studying “About the VIX Index” for the CMT, you should learn to understand the VIX Index as a measure of market volatility, often referred to as the “fear gauge.” Analyze how the VIX is derived from options prices on the S&P 500 and what it indicates about market expectations of volatility over the next 30 days. Evaluate the relationship between VIX levels and market sentiment, noting how high or low VIX readings can signal potential market turning points or risk levels. Understand how the VIX is used by traders and investors as a tool for hedging and speculation. Additionally, explore the applications of VIX-based products, such as futures and options, and their role in portfolio risk management and trading strategies.
The VIX Index: Measuring Market Volatility
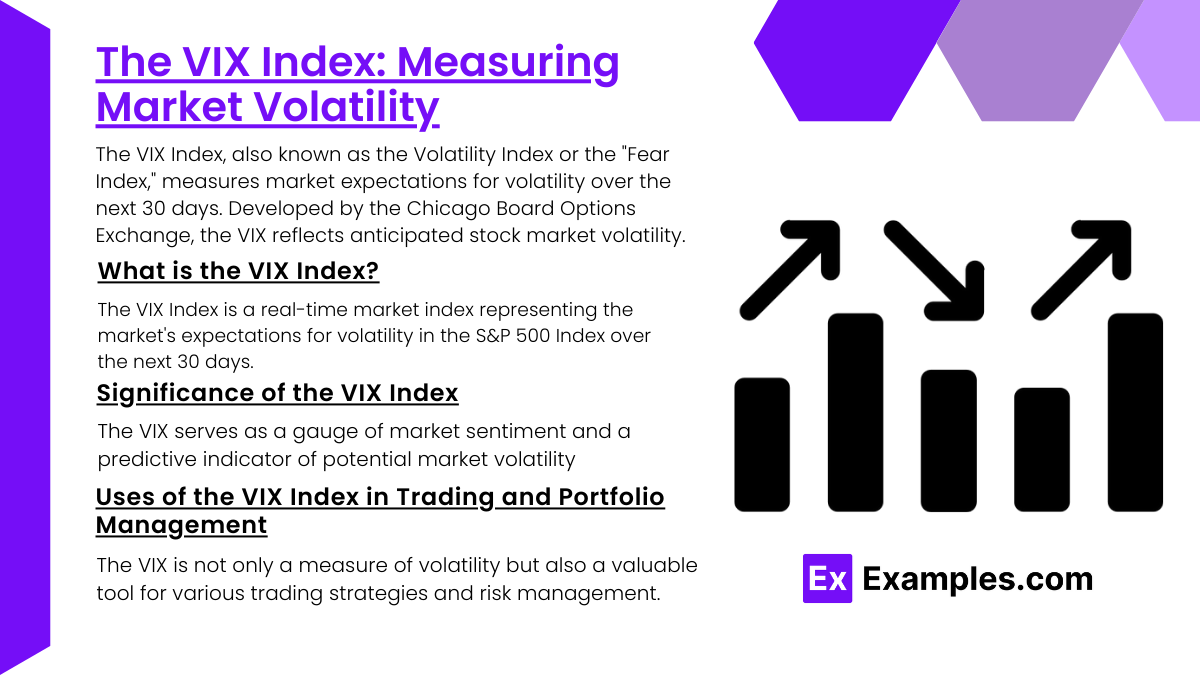
The VIX Index, also known as the Volatility Index or the “Fear Index,” measures market expectations for volatility over the next 30 days. Developed by the Chicago Board Options Exchange (CBOE), the VIX reflects anticipated stock market volatility and serves as a barometer of investor sentiment, particularly in the U.S. stock market. Here’s an overview of how the VIX works, its significance, and its role in financial markets.
1. What is the VIX Index?
The VIX Index is a real-time market index representing the market’s expectations for volatility in the S&P 500 Index over the next 30 days. It’s derived from the price of S&P 500 index options, which indicate the premium investors are willing to pay to hedge against potential market fluctuations.
- Calculation: The VIX is calculated using a formula that incorporates the prices of near-term S&P 500 call and put options. It aggregates expected volatility across a range of strikes to capture the broader market’s view on future volatility.
- Expressed as a Percentage: The VIX value is quoted as an annualized percentage, so a VIX reading of 20 implies an expected annual volatility of 20%. This reading doesn’t predict direction but only the magnitude of expected price changes.
2. Significance of the VIX Index
The VIX serves as a gauge of market sentiment and a predictive indicator of potential market volatility:
- Fear and Uncertainty: A high VIX often indicates increased fear or uncertainty in the market. Typically, the VIX rises during market downturns or periods of heightened risk aversion as investors seek protection against possible declines.
- Market Sentiment: The VIX provides insight into investor sentiment. A low VIX indicates relative calm or optimism, while a high VIX suggests concern about volatility, often in response to economic news, geopolitical events, or market shocks.
- Inverse Relationship with Stocks: The VIX often moves inversely with stock prices. When the market falls, the VIX tends to rise, reflecting increased demand for options as investors seek protection against losses.
Example: During the 2008 financial crisis, the VIX spiked as high as 80, reflecting extreme fear and market uncertainty. By contrast, in calmer periods, the VIX can fall below 15, indicating lower volatility expectations.
3. Uses of the VIX Index in Trading and Portfolio Management
The VIX is not only a measure of volatility but also a valuable tool for various trading strategies and risk management:
- Hedging Market Volatility: Traders and portfolio managers use the VIX to hedge against potential downturns. By investing in VIX-related products (like VIX futures or VIX ETFs), they can protect their portfolios from large market swings.
- Market Timing Indicator: Some investors view the VIX as a contrarian indicator. Extremely high VIX levels might signal a market bottom, as extreme fear often precedes a rebound. Conversely, a very low VIX may suggest complacency, potentially signaling a market peak.
- Volatility-Based Products: VIX options, futures, and exchange-traded products (ETPs) allow investors to trade directly on volatility expectations, providing a way to profit from changes in market volatility without exposure to market direction.
Example: A portfolio manager anticipating high volatility might purchase VIX futures as insurance, helping offset potential losses in a downturn.
How the VIX is Derived from S&P 500 Options Prices
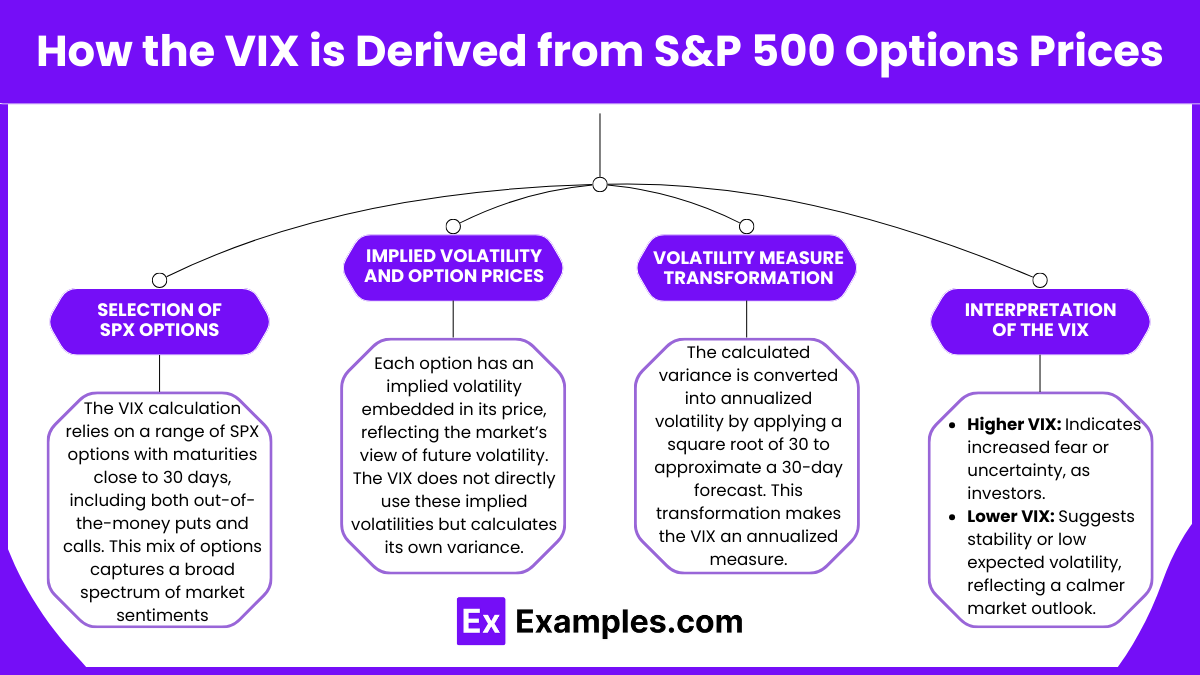
The VIX Index, often called the “Fear Gauge,” measures expected market volatility based on options prices for the S&P 500 Index (SPX). Derived from the implied volatilities of a range of S&P 500 options, the VIX is intended to reflect market participants’ expectations for volatility over the next 30 days. Here’s a step-by-step overview of how the VIX is calculated from SPX options prices:
1. Selection of SPX Options
The VIX calculation relies on a range of SPX options with maturities close to 30 days, including both out-of-the-money (OTM) puts and calls. This mix of options captures a broad spectrum of market sentiments, as OTM options are more sensitive to changes in volatility.
- Put and Call Options: Both types of options are used to give a balanced view of volatility, regardless of directional market movements.
- Maturity: Options with less than 30 days to expiration are primarily used, though the formula interpolates to keep a consistent 30-day forward-looking measure.
2. Implied Volatility and Option Prices
Each option has an implied volatility embedded in its price, reflecting the market’s view of future volatility. The VIX does not directly use these implied volatilities but calculates its own variance measure based on the prices of the options.
- Option Prices and Volatility: When investors expect significant future price movements, they often buy OTM options, driving up their prices, which, in turn, increases the VIX.
- Volatility and Demand: High demand for options (puts or calls) generally signals higher expected volatility, leading to a higher VIX level.
3. Volatility Measure Transformation
The calculated variance is converted into annualized volatility by applying a square root of 30 to approximate a 30-day forecast. This transformation makes the VIX an annualized measure, offering an intuitive interpretation of expected annual market volatility over the next 30 days.
4. Interpretation of the VIX
- Higher VIX: Indicates increased fear or uncertainty, as investors expect greater market swings in the near term.
- Lower VIX: Suggests stability or low expected volatility, reflecting a calmer market outlook.
What the VIX Index Indicates About Market Sentiment
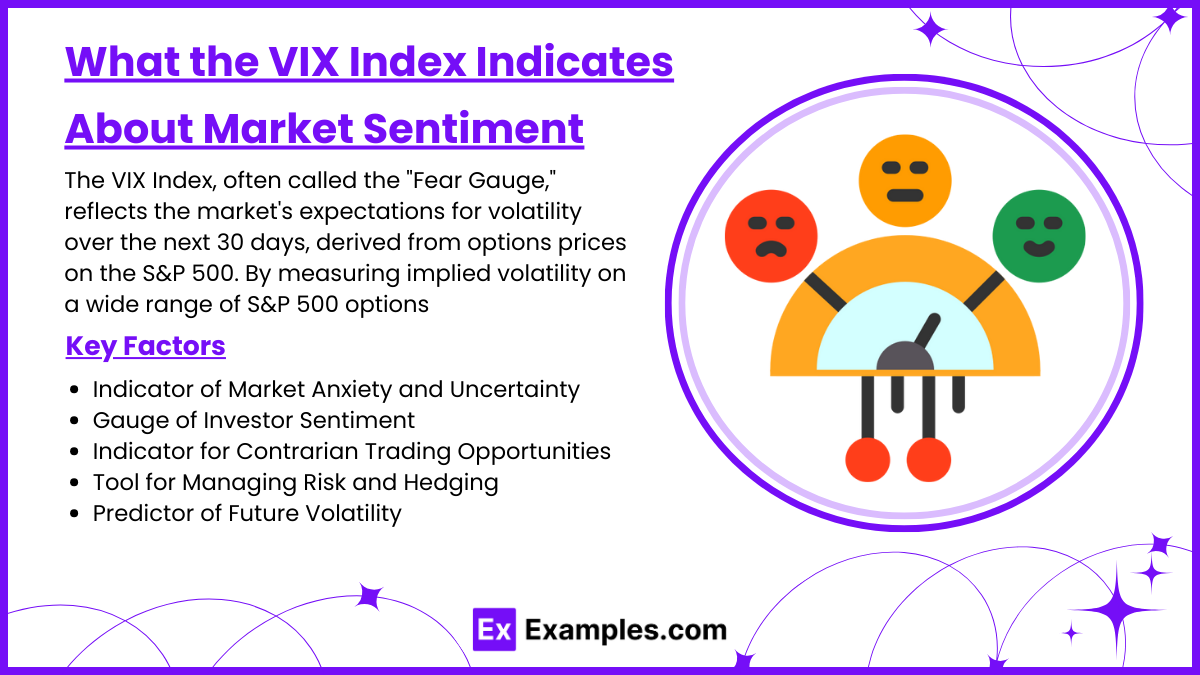
The VIX Index, often called the “Fear Gauge,” reflects the market’s expectations for volatility over the next 30 days, derived from options prices on the S&P 500. By measuring implied volatility on a wide range of S&P 500 options, the VIX offers insights into investor sentiment and expectations regarding future market risk. Here’s what the VIX indicates about market sentiment and how it can serve as a tool for traders and investors:
1. Indicator of Market Anxiety and Uncertainty
The VIX tends to rise when investors expect increased market volatility, often associated with economic uncertainty, political events, or market shocks. A high VIX level suggests heightened investor anxiety, as market participants anticipate larger price swings in the near term.
- High VIX: Typically, a VIX value above 20 is associated with elevated fear and uncertainty, signaling that investors are worried about potential market declines or instability. This often occurs during periods of economic turmoil, market corrections, or unexpected news.
- Low VIX: Conversely, a VIX reading below 20 usually indicates a period of stability or complacency, suggesting that investors do not expect significant market swings and are generally optimistic.
Example: During the 2008 financial crisis, the VIX reached unprecedented levels as fear and uncertainty surged, signaling intense market anxiety. In contrast, periods of strong economic growth and steady markets often see the VIX at lower levels, indicating relative investor calm.
2. Gauge of Investor Sentiment
The VIX is often used as a proxy for investor sentiment. When the VIX rises sharply, it typically reflects a “risk-off” sentiment, where investors may seek safer assets like bonds, gold, or cash. Conversely, a low VIX indicates a “risk-on” sentiment, where investors are more willing to hold riskier assets.
- Bullish Sentiment: A declining or low VIX suggests that investors are comfortable with current market conditions, signaling bullish sentiment and confidence in market stability.
- Bearish Sentiment: A high or rising VIX is typically associated with bearish sentiment, as investors brace for potential downturns, reflecting a desire to hedge against possible losses.
Example: After the 2020 COVID-19 market crash, the VIX spiked sharply as investor sentiment turned bearish amid global uncertainty. As markets stabilized later in the year, the VIX gradually declined, signaling a recovery in investor confidence.
3. Indicator for Contrarian Trading Opportunities
Some traders view the VIX as a contrarian indicator, meaning high VIX levels could signal a potential buying opportunity, while low VIX levels could suggest caution. The logic behind this is that extreme levels of fear or complacency may precede market reversals.
- High VIX as a Buying Signal: When the VIX reaches unusually high levels, it may indicate that markets are oversold due to panic. Contrarian traders may see this as an opportunity to buy at low prices, anticipating that fear will subside and prices will rebound.
- Low VIX as a Selling Signal: Extremely low VIX levels may signal complacency, where investors may be underestimating risks. This can indicate that markets are overbought, prompting some traders to reduce exposure to avoid potential corrections.
Example: During extreme market sell-offs, the VIX often spikes. Some investors might interpret this as a signal to buy, believing that panic selling has created undervalued opportunities.
4. Tool for Managing Risk and Hedging
The VIX is widely used as a tool for managing portfolio risk and hedging against potential losses. Options on the VIX itself or volatility-based exchange-traded products (ETPs) allow investors to hedge against anticipated market swings.
- Portfolio Hedging: Investors can use the VIX to assess the need for additional portfolio hedges. For example, if the VIX is high, they might consider buying put options or allocating assets to defensive sectors.
- Strategic Adjustments: By monitoring the VIX, investors can adjust their asset allocation based on anticipated volatility, such as increasing cash reserves or reducing equity exposure when the VIX signals higher risk.
Example: During times of high VIX, an investor might purchase put options on the S&P 500 to protect against downside risk, using the VIX as an indicator of market instability.
5. Predictor of Future Volatility
The VIX is forward-looking, indicating the market’s expectation of future volatility over the next month. Unlike historical volatility, which reflects past price fluctuations, the VIX reveals how much movement investors expect in the near term.
- High Future Volatility: When the VIX is elevated, it indicates that investors anticipate increased price fluctuations in the near future, which may impact investment decisions.
- Low Future Volatility: A low VIX suggests that investors expect relative stability and smaller market movements, providing reassurance to long-term investors who may be wary of sudden market swings.
Example: When economic data or corporate earnings reports are expected, the VIX may rise in anticipation of potential market reactions, even if the actual outcome is unknown.
The Role of the VIX for Traders and Investors
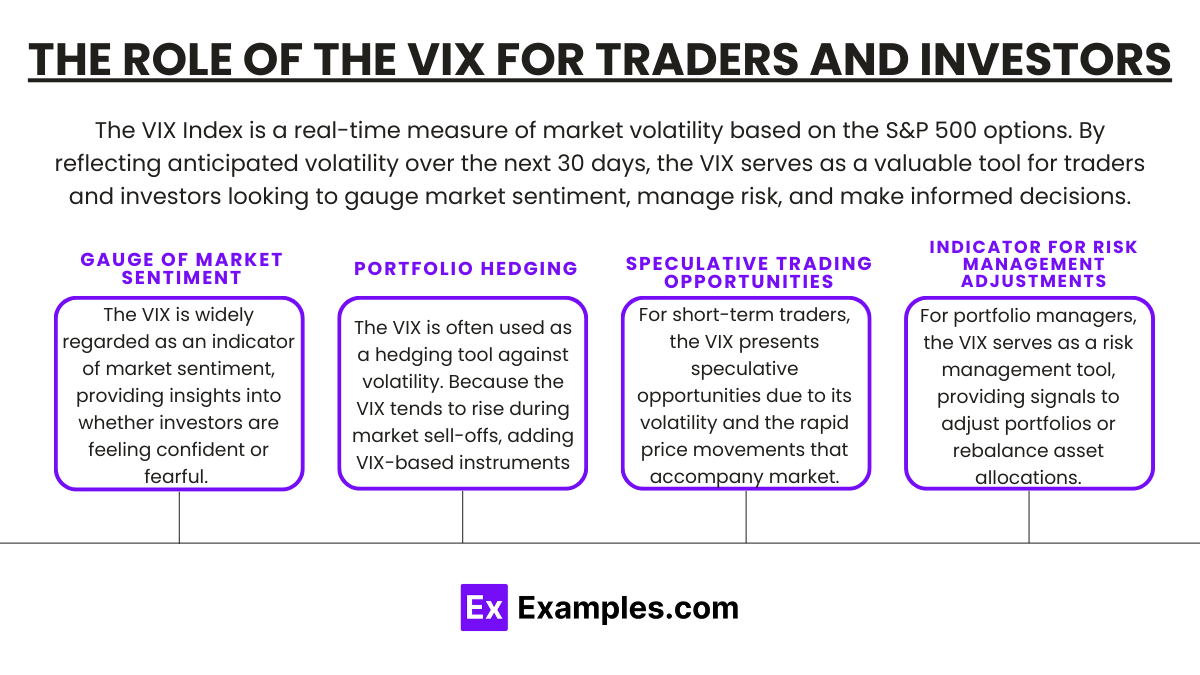
The VIX Index (often called the “Fear Index”) is a real-time measure of market volatility based on the S&P 500 options. By reflecting anticipated volatility over the next 30 days, the VIX serves as a valuable tool for traders and investors looking to gauge market sentiment, manage risk, and make informed decisions. Here’s a closer look at how the VIX is used by different market participants.
1. Gauge of Market Sentiment
The VIX is widely regarded as an indicator of market sentiment, providing insights into whether investors are feeling confident or fearful. A high VIX (usually above 30) suggests that investors expect higher volatility, typically associated with market downturns or crises, while a low VIX (below 20) indicates lower expected volatility and investor confidence.
- Investor Insight: For long-term investors, the VIX can serve as a signal for heightened caution. A rising VIX may indicate a need for conservative asset allocation, while a declining VIX can signal market stability and potential buying opportunities.
- Traders’ Sentiment Gauge: For traders, rapid changes in the VIX reveal shifts in investor sentiment, helping them anticipate market reversals or momentum. When the VIX spikes, it can signal the peak of fear and a potential reversal, while a drop in the VIX may indicate reduced uncertainty.
2. Portfolio Hedging
The VIX is often used as a hedging tool against volatility. Because the VIX tends to rise during market sell-offs, adding VIX-based instruments to a portfolio can provide protection against market declines.
- VIX Options and Futures: Traders and investors can use VIX options and futures to directly hedge against market volatility. These instruments allow for profit during spikes in the VIX, offsetting losses in equity positions.
- Inverse Correlation with Equity Markets: The VIX’s inverse correlation with equities makes it a good hedge for portfolios heavy in stocks. For instance, if an investor anticipates potential market volatility, they can add VIX futures to balance the downside risk.
Example: An investor may buy VIX call options during times of low volatility as insurance against an expected market downturn, benefiting if the VIX rises and offsetting potential losses in their equity holdings.
3. Speculative Trading Opportunities
For short-term traders, the VIX presents speculative opportunities due to its volatility and the rapid price movements that accompany market sentiment shifts.
- Volatility-Driven Trades: Traders use VIX options and futures to capitalize on price swings. Speculating on the VIX can provide quick profits during turbulent market periods.
- Market Reversal Signals: Spikes in the VIX can indicate moments of extreme fear or panic, which contrarian traders may interpret as buy signals, anticipating a market rebound once sentiment stabilizes.
Example: A trader may purchase VIX futures before a major economic event, expecting volatility to increase. Once the event passes and volatility settles, the trader can sell the futures at a profit.
4. Indicator for Risk Management Adjustments
For portfolio managers, the VIX serves as a risk management tool, providing signals to adjust portfolios or rebalance asset allocations in line with expected market conditions.
- Allocation Adjustments: A high VIX reading may prompt a shift to safer assets, such as bonds or cash, reducing equity exposure to minimize risk. Conversely, a low VIX may encourage higher equity allocations to capitalize on stable market conditions.
- Tactical Rebalancing: The VIX can also signal the need for tactical rebalancing, where assets are shifted to adapt to short-term market risks or opportunities without changing the long-term strategy.
Example: A portfolio manager might temporarily increase cash or bond holdings during a VIX spike to shield the portfolio from expected volatility, rebalancing back to equities once the VIX returns to lower levels.
Examples
Example 1: Market Sentiment Indicator
The VIX Index, often referred to as the “Fear Gauge,” measures the market’s expectation of future volatility in the S&P 500 index. It reflects investor sentiment and is typically used to assess market risk. A high VIX indicates increased uncertainty or fear, while a low VIX suggests a more stable market. Investors use this index to gauge market conditions and adjust their portfolios accordingly.
Example 2: Relationship with Stock Market
The VIX Index is inversely related to the stock market. When stock prices are rising, the VIX tends to be low, indicating that investors expect little volatility. Conversely, during market downturns or periods of uncertainty, the VIX tends to rise as investors anticipate higher volatility. This relationship helps investors understand the market’s overall mood and potential risks.
Example 3: Use in Options Trading
The VIX Index is closely tied to options trading, particularly S&P 500 index options. The VIX reflects the implied volatility of these options, showing how much traders expect the price of the S&P 500 to fluctuate over the next 30 days. Traders use the VIX to determine the level of volatility priced into options and adjust their strategies based on market expectations.
Example 4: VIX as a Hedge
Investors use the VIX Index as a tool for hedging against market downturns. When the VIX rises, it often signals increased market stress, prompting investors to seek protection for their portfolios. Financial products like VIX futures and VIX exchange-traded products allow traders to gain exposure to volatility, which can help mitigate risks in declining markets.
Example 5: Predicting Market Corrections
The VIX Index is sometimes used as a predictive tool for potential market corrections. A sudden spike in the VIX, especially when it rises rapidly, may signal that a correction or crash is imminent. While not always accurate, a sharp increase in the VIX often prompts investors to be cautious, as it indicates rising uncertainty and potential volatility in the market.
Practice Questions
Question 1
What does a high VIX Index typically indicate?
A) Increased market stability
B) Investor complacency
C) A period of high market volatility and fear
D) Low expectations for market movement
Correct Answer: C) A period of high market volatility and fear.
Explanation: The VIX Index, also known as the “Fear Gauge,” reflects the market’s expectations of future volatility. A high VIX indicates that investors expect significant fluctuations in the market, often due to uncertainty or fear, typically during times of economic stress or market crises. It is a signal of increased risk and potential downturns.
Question 2
How is the VIX Index primarily calculated?
A) By tracking the stock price movements of individual companies
B) Based on the price movements of government bonds
C) Using the implied volatility of S&P 500 index options
D) From the movement of foreign exchange rates
Correct Answer: C) Using the implied volatility of S&P 500 index options.
Explanation: The VIX Index is calculated using the implied volatility of options on the S&P 500 Index. Specifically, it reflects the expected volatility over the next 30 days as inferred from the prices of options contracts. This makes the VIX a useful tool for investors to gauge market sentiment and forecast future market fluctuations.
Question 3
What does a sudden spike in the VIX Index usually indicate?
A) Market stability and growth
B) A potential market correction or crisis
C) Rising corporate profits
D) A reduction in government intervention in the market
Correct Answer: B) A potential market correction or crisis.
Explanation: A sharp increase in the VIX typically signals rising investor anxiety and concerns about the market’s stability. This could indicate that a market correction or crisis is imminent, as higher implied volatility reflects fears about economic instability or other factors that could lead to sudden and unpredictable market moves.

