Preparing for the CMT Exam requires a thorough grasp of academic approaches to technical analysis, an essential area in market analysis. Understanding theoretical models, quantitative methods, and statistical validation is vital. This knowledge provides a foundation for analyzing price patterns, market trends, and investor behavior, essential for achieving a high CMT score.
Learning Objective
In studying “Academic Approaches to Technical Analysis” for the CMT Exam, you should learn to understand the foundational theories and quantitative methods that drive technical analysis. Evaluate key approaches, including chart pattern recognition, statistical tools, and time series analysis, which aid in predicting market trends and price movements. Analyze the application of methodologies such as moving averages, momentum indicators, and oscillators, exploring their statistical validation and limitations. Additionally, examine how these academic approaches contribute to forecasting and managing market risks, and apply your understanding to interpret price action, volume data, and trend analysis in CMT practice scenarios.
Theoretical Foundations of Technical Analysis

The Theoretical Foundations of Technical Analysis explore the principles and market theories that form the basis for technical analysis practices. This foundation includes both economic theories, like the Efficient Market Hypothesis (EMH), and behavioral finance concepts, each offering insights into how and why market prices may follow trends or exhibit predictable patterns.
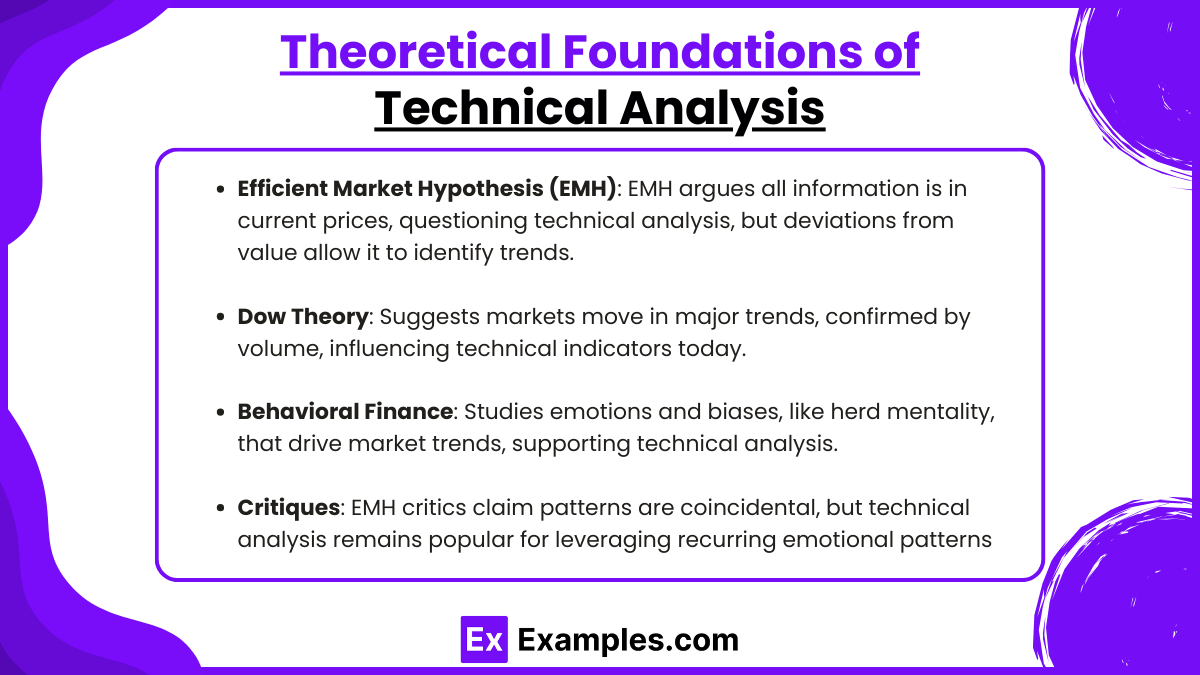
- Efficient Market Hypothesis (EMH): The EMH posits that all available information is reflected in current prices, suggesting that technical analysis should not provide any advantage in an efficient market. However, technical analysis challenges this theory by identifying situations where prices deviate from true value due to investor behaviors, market sentiment, or information asymmetry. Practitioners argue that EMH doesn’t fully account for irrational behaviors and emotional responses that often drive market trends.
- Dow Theory: One of the earliest market theories, Dow Theory asserts that the market moves in broad trends, with primary, secondary, and minor movements. Dow Theory also emphasizes that trends are confirmed by volume, and its principles have influenced many technical indicators and pattern recognition methods used today.
- Behavioral Finance and Market Psychology: Behavioral finance adds another layer by examining how emotions, biases, and irrational behaviors can drive market movements. Concepts like herd mentality, loss aversion, and overreaction suggest that price movements are not always rational, making technical analysis useful in identifying these emotional patterns and predicting market behavior.
- Critiques and Limitations of Technical Analysis: From an academic perspective, technical analysis has faced critiques, especially from proponents of EMH who argue that patterns are merely coincidental and do not hold predictive power in efficient markets. Despite this, technical analysis remains popular, as it offers tools to capitalize on recurring price patterns and emotional behaviors that continue to appear in financial markets
Quantitative Methods in Technical Analysis

Quantitative Methods in Technical Analysis involve the use of mathematical models and statistical tools to analyze past price movements and predict future trends. These methods provide a more objective, data-driven approach to technical analysis, focusing on measurable data such as price, volume, and volatility rather than subjective chart patterns.
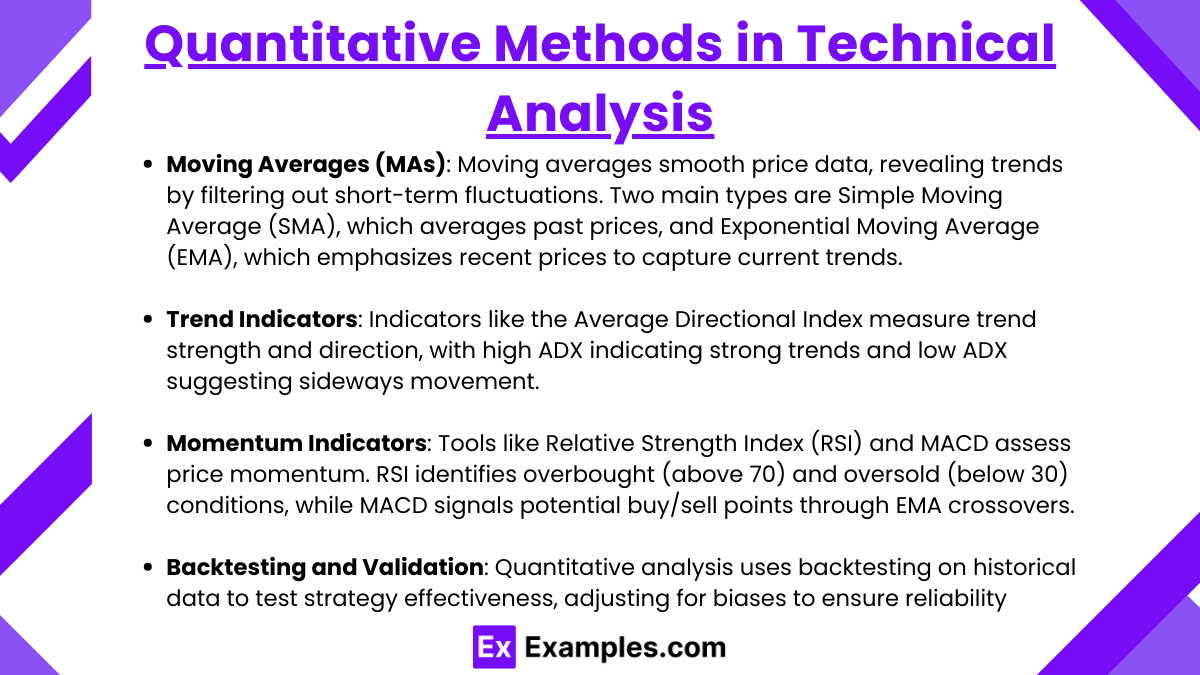
- Moving Averages (MAs): Moving averages are widely used to smooth out price data, helping to identify trends by filtering out short-term fluctuations. The two main types are:
- Simple Moving Average (SMA): An average of past prices over a set number of periods. For example, a 50-day SMA averages the closing prices of the past 50 days, updating as new data comes in.
- Exponential Moving Average (EMA): This average gives more weight to recent prices, making it more responsive to new information. EMAs are particularly useful in capturing the latest trend direction.
- Trend Indicators: Trend indicators, like the Average Directional Index (ADX), help measure the strength and direction of a trend. These indicators quantify whether a market is trending or consolidating, which is useful for choosing appropriate trading strategies. A high ADX value, for example, signals a strong trend, while a low ADX indicates a range-bound or sideways market.
- Momentum Indicators: Momentum indicators, such as the Relative Strength Index (RSI) and the Moving Average Convergence Divergence (MACD), measure the rate of price change and help identify overbought or oversold conditions. These indicators often signal potential reversals or corrections when prices move too far from their average range.
- RSI: Typically ranges from 0 to 100, with readings above 70 considered overbought and below 30 considered oversold.
- MACD: Tracks the difference between two EMAs, often leading to buy or sell signals when the MACD line crosses above or below a signal line.
- Backtesting and Statistical Validation: Quantitative methods rely on backtesting—testing strategies on historical data to evaluate their effectiveness and statistical significance. Backtesting assesses how well a strategy would have performed in the past, giving traders an idea of its potential reliability. Proper statistical validation includes adjusting for biases, such as data-snooping, to ensure that the results are robust and not merely coincidental.
Quantitative methods bring objectivity to technical analysis, allowing analysts to base decisions on tested metrics rather than subjective judgment. By integrating these tools into trading systems, analysts can identify trends, measure their strength, and develop consistent strategies based on historical price behavior.
Chart Patterns and Price Action Analysis

Chart Patterns and Price Action Analysis are central elements of technical analysis, focusing on recognizing repetitive price formations on charts that signal potential market movements. By studying price action and chart patterns, traders and analysts aim to predict future trends, reversals, or continuation moves based on past behavior.
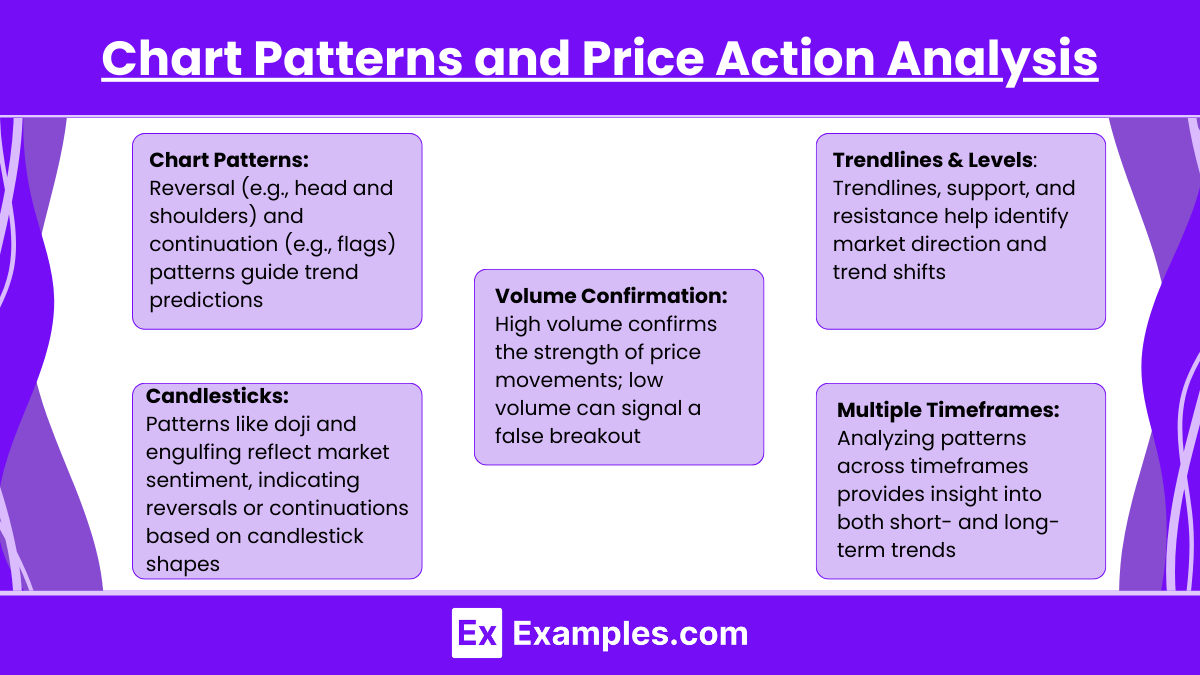
- Common Chart Patterns: Chart patterns are formed by the natural movement of prices and are divided into two main types—reversal and continuation patterns.
- Reversal Patterns: These patterns signal the likelihood of a change in trend direction. Common examples include the head and shoulders pattern, double top/bottom, and triple top/bottom. A head and shoulders pattern, for example, indicates a reversal from a bullish to a bearish trend when the “neckline” is broken.
- Continuation Patterns: These patterns suggest that the existing trend is likely to continue. Examples include triangles, flags, and pennants. A bullish flag pattern within an uptrend, for instance, signals a short consolidation before the price likely resumes its upward movement.
- Trendlines and Support/Resistance Levels: Trendlines connect successive highs or lows in a price series, helping to identify the overall direction of a market. Support is a price level where buying interest tends to prevent the price from falling further, while resistance is a level where selling interest limits price increases. Breaking these levels often indicates potential changes in trend or momentum.
- Candlestick Patterns: Candlestick patterns are part of price action analysis and provide visual clues about market sentiment within a specified time frame. Patterns like doji, engulfing, and hammer candlesticks offer insights into potential reversals or continuations. For example, a bullish engulfing pattern occurs when a small bearish candle is followed by a larger bullish candle, often suggesting a potential upward reversal.
- Volume Confirmation: Volume analysis is crucial for validating chart patterns and price movements. High volume during a breakout or breakdown from a pattern, such as a triangle or head and shoulders, suggests stronger conviction and increases the likelihood that the move is sustainable. Conversely, weak volume can signal a false breakout or the need for caution.
- Price Action within Different Timeframes: Price action analysis considers how patterns form across various timeframes, from intraday to long-term charts. Trends and patterns on larger timeframes are generally more reliable, while shorter timeframes can provide early signals. By analyzing price action in multiple timeframes, traders can achieve a balanced view, understanding both short-term fluctuations and long-term trends.
Chart patterns and price action analysis provide a framework for interpreting and forecasting market behavior. Recognizing these patterns helps traders anticipate likely movements and make informed decisions, especially when combined with other technical indicators.
Examples
Example 1
Incorporating the Efficient Market Hypothesis (EMH) into technical analysis, some analysts believe that while markets are generally efficient, technical patterns can still emerge due to behavioral biases and delayed reactions to new information. This creates opportunities for pattern recognition that EMH alone would not predict.
Example 2
Using quantitative backtesting as an academic approach, analysts test chart patterns and indicators against historical data to validate their effectiveness. Backtesting allows traders to assess the statistical significance of patterns like head and shoulders or double tops, providing a more rigorous approach to traditional technical analysis.
Example 3
Applying Dow Theory academically, technical analysts look at market movements in three trend phases: primary, secondary, and minor. This theory forms the basis for analyzing market cycles and is used to understand how trends interact with broader economic conditions, adding historical insight to technical predictions.
Example 4
Quantitative methods like moving averages and oscillators are used academically to filter price data and capture trend direction. Techniques like exponential moving averages (EMA) and relative strength index (RSI) are tested for reliability over various markets, aiming to identify patterns with statistical accuracy and reduce noise.
Example 5
Behavioral finance integrates with technical analysis to explain patterns in market data caused by irrational investor behavior. Concepts like overreaction, herd behavior, and anchoring provide a basis for understanding why certain price patterns, such as support and resistance levels, often repeat due to emotional market responses.
Practice Questions
Question 1
Which of the following best describes the purpose of backtesting in technical analysis?
A) To create new trading indicators for all market conditions
B) To validate the effectiveness of trading strategies using historical data
C) To measure emotional responses of investors during market fluctuations
D) To identify future stock prices based on fundamental analysis
Answer: B
Explanation:
Backtesting is a quantitative approach used to validate the effectiveness of trading strategies by applying them to historical data. It allows analysts to assess whether patterns or indicators would have been successful in past market conditions, making option B the correct answer. Options A, C, and D do not accurately describe the purpose of backtesting in technical analysis.
Question 2
In technical analysis, which theory proposes that prices reflect all available information, making it challenging to consistently outperform the market?
A) Dow Theory
B) Relative Strength Theory
C) Efficient Market Hypothesis
D) Behavioral Finance Theory
Answer: C
Explanation:
The Efficient Market Hypothesis (EMH) suggests that all available information is already priced into assets, making it difficult to achieve returns that consistently outperform the market. This theory challenges the predictive power of technical analysis, as it implies that patterns are unlikely to be profitable consistently. Dow Theory (A) and Behavioral Finance Theory (D) provide insights into market trends and investor behavior, but they do not specifically state that all information is priced in. Relative Strength Theory (B) is not a recognized theory in academic technical analysis.
Question 3
Which of the following is a fundamental principle of Dow Theory in technical analysis?
A) Prices always follow a random walk
B) Trends are confirmed by volume
C) Investor psychology does not impact price action
D) Market movements are solely driven by economic data
Answer: B
Explanation:
Dow Theory states that trends are confirmed by volume, indicating that price movements accompanied by high trading volume are more reliable. This principle helps analysts verify the strength of a trend. Option A contradicts technical analysis, as Dow Theory believes trends exist. Option C ignores the impact of investor psychology, and D incorrectly suggests that economic data alone drives market movements.


