Volume indicators are essential tools in technical analysis, offering insights into market strength by tracking the quantity of shares or contracts traded over time. These indicators help confirm price trends, signal potential reversals, and measure momentum by revealing the intensity of buying or selling pressure. High volume often supports price movements, while divergences between price and volume suggest weakening trends or possible reversals. By analyzing volume alongside price, traders gain a clearer picture of market sentiment, enhancing decision-making and trend validation in trading strategies.
Learning Objectives
In studying “An Introduction to Volume Indicators” for the CFA Exam, you should learn to understand how volume indicators support technical analysis by highlighting market strength, momentum, and potential reversals. Assess various volume-based tools, including On-Balance Volume (OBV), the Accumulation/Distribution (A/D) Line, and Chaikin Money Flow (CMF), and evaluate how these indicators provide insights into price trends and trader sentiment. Examine the role of volume in trend confirmation, divergence, and breakout identification. Apply your understanding of volume indicators to analyze price-volume relationships and interpret their implications for trading strategies and market behavior in CFA exam passages.
Introduction to Volume Indicators
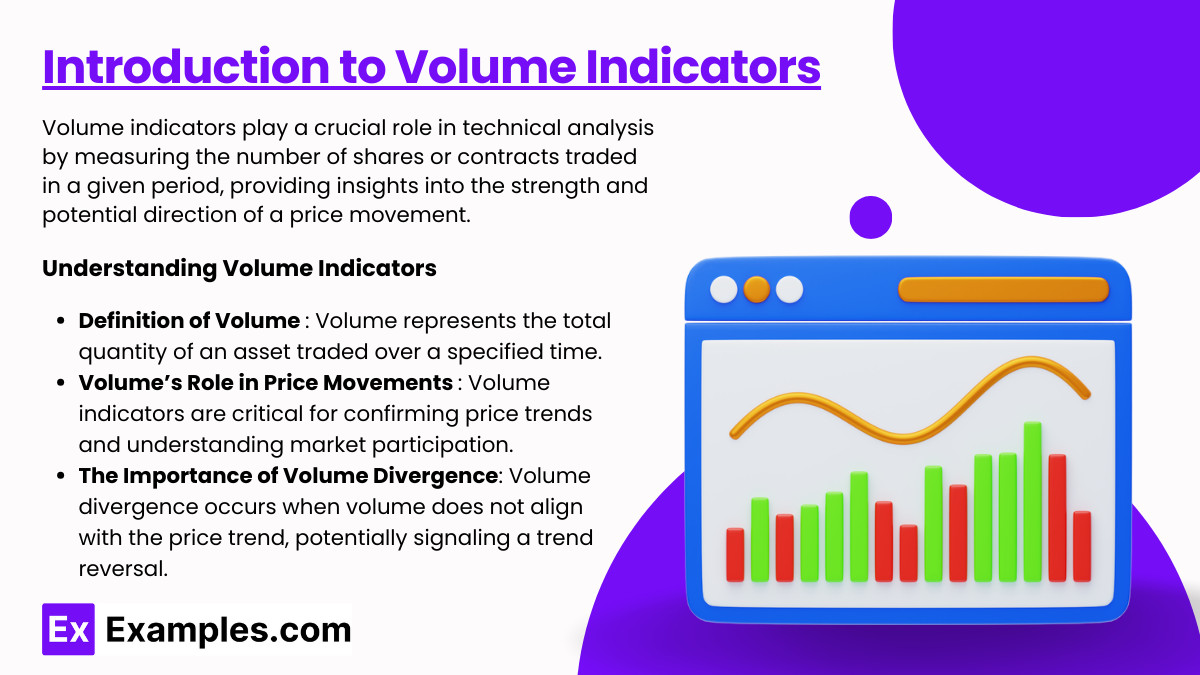
Volume indicators play a crucial role in technical analysis by measuring the number of shares or contracts traded in a given period, providing insights into the strength and potential direction of a price movement. Analyzing volume in conjunction with price patterns allows traders to gauge the market sentiment and validate trends, making volume indicators essential for spotting reversals, confirmations, and trends.
Understanding Volume Indicators
- Definition of Volume: Volume represents the total quantity of an asset traded over a specified time. In technical analysis, volume reflects the level of interest or enthusiasm among traders regarding a particular asset or security.
- Volume’s Role in Price Movements: Volume indicators are critical for confirming price trends and understanding market participation. High volume during a price increase suggests strong buying interest, while high volume during a price drop indicates intense selling pressure. Low volume, on the other hand, suggests weaker conviction behind a price move, which may signify a lack of commitment from market participants.
- The Importance of Volume Divergence: Volume divergence occurs when volume does not align with the price trend, potentially signaling a trend reversal. For example, if a stock is rising but volume is declining, it may indicate weakening momentum, suggesting the trend might reverse.
Key Volume Indicators
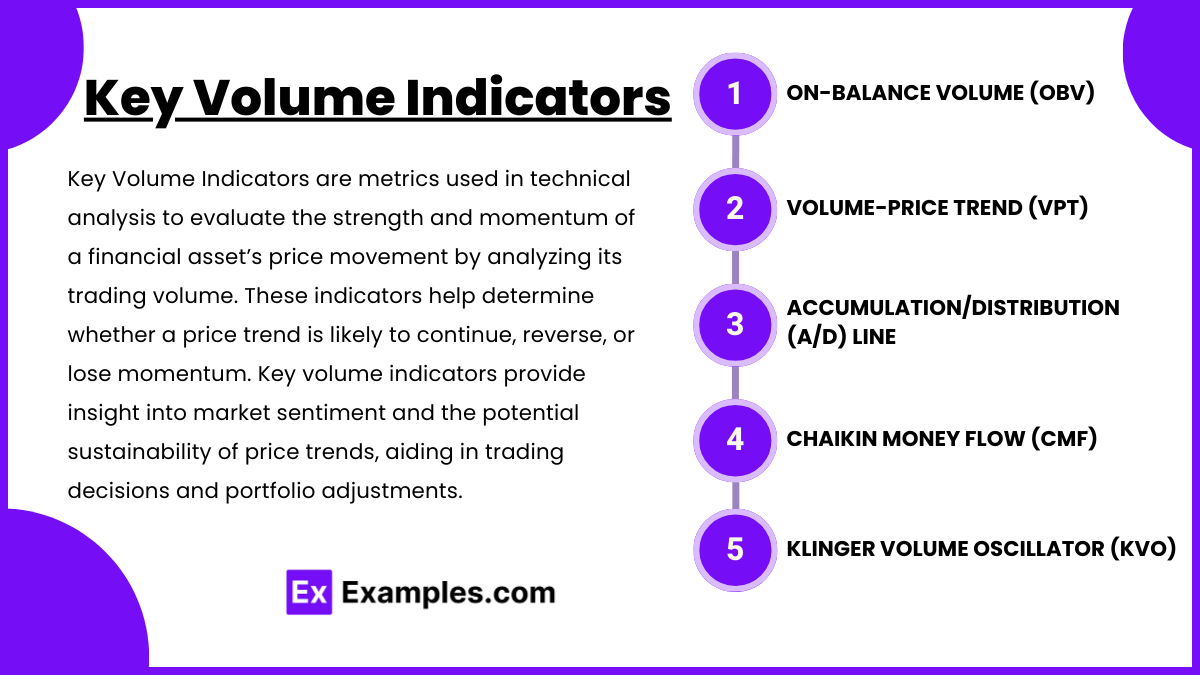
Key Volume Indicators are metrics used in technical analysis to evaluate the strength and momentum of a financial asset’s price movement by analyzing its trading volume. These indicators help determine whether a price trend is likely to continue, reverse, or lose momentum.
- On-Balance Volume (OBV):
- Description: OBV calculates a running total of volume by adding or subtracting the volume of a period based on whether the price closed higher or lower than the previous close.
- Purpose: It helps in detecting momentum and trend strength. OBV increases when there is an influx of buying volume and decreases when selling volume dominates.
- Usage: OBV divergences with price movements are often early signals of potential trend reversals.
- Volume-Price Trend (VPT):
- Description: VPT adds or subtracts a percentage of volume relative to the percentage price change, offering a cumulative volume flow.
- Purpose: It helps in identifying trend directions and potential changes in momentum. An increasing VPT generally supports upward trends, while a decreasing VPT can signal declining interest in upward price movements.
- Usage: Often used to confirm price trends; a divergence between VPT and price might indicate trend weakness or reversal.
- Accumulation/Distribution (A/D) Line:
- Description: This indicator calculates a running total of volume based on the closing price’s proximity to the high and low of the day. If the closing price is closer to the high, more volume is added; if it’s closer to the low, volume is subtracted.
- Purpose: The A/D line helps identify the balance between buying and selling pressure.
- Usage: Divergences between the A/D line and price movement may hint at an upcoming reversal or trend continuation, with a rising A/D line suggesting accumulation and a falling A/D line indicating distribution.
- Chaikin Money Flow (CMF):
- Description: CMF measures the volume-weighted average of accumulation and distribution over a specific period, usually 20 or 21 days.
- Purpose: It indicates buying or selling pressure. CMF values above zero suggest buying pressure, while values below zero indicate selling pressure.
- Usage: CMF is used to confirm trends, with higher CMF values supporting uptrends and lower CMF values supporting downtrends. Significant changes in CMF can signal potential trend shifts.
- Klinger Volume Oscillator (KVO):
- Description: KVO calculates the difference between two exponential moving averages of volume (typically 34- and 55-period EMAs), representing the long-term accumulation or distribution.
- Purpose: It seeks to detect long-term trends of money flow and potential price reversals.
- Usage: KVO is commonly used to confirm trends and identify possible reversals when the oscillator crosses above or below a signal line.
Analyzing Volume in Market Phases
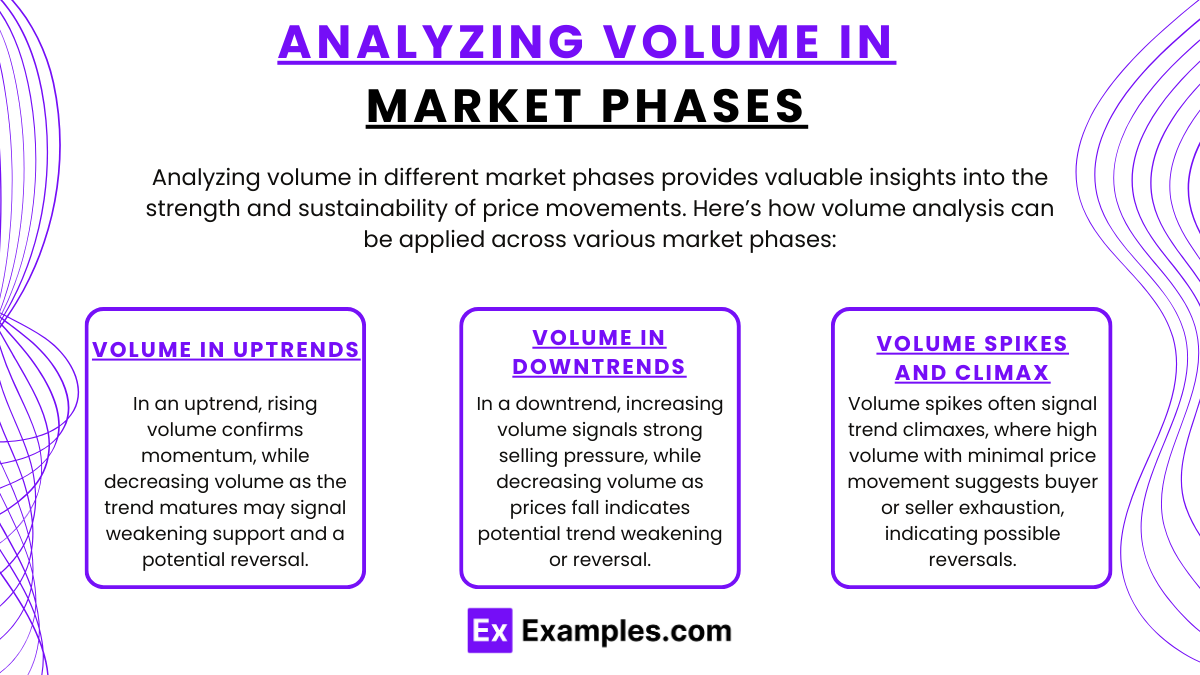
- Volume in Uptrends :
- In an uptrend, volume typically rises with prices, confirming the strength of the upward momentum.
- As the trend matures, if volume starts to decrease, it can suggest that fewer traders are supporting the price increase, potentially signaling a top.
- Volume in Downtrends :
- During a downtrend, volume tends to increase as prices fall, indicating selling pressure and a strong downward movement.
- A decrease in volume as prices continue to fall might suggest that the trend is weakening, signaling a potential reversal.
- Volume Spikes and Climax :
- Volume spikes often occur at the end of major trends, acting as climaxes. High volume with little price movement can indicate that buyers or sellers are exhausted, often leading to reversals.
Practical Applications of Volume Indicators
Volume indicators help assess market strength, confirm price trends, identify potential reversals, and guide entry and exit points in trading.
- Volume Breakouts:
- Volume often increases sharply before or during a breakout. Traders look for volume spikes to confirm breakouts from support or resistance levels.
- A breakout with high volume is considered more reliable, as it reflects strong participation.
- Identifying False Breakouts:
- Low volume on a breakout may signal a false breakout, as there is insufficient interest to sustain the move.
- Traders use volume indicators to differentiate between genuine and false breakouts, preventing entry on weak setups.
- Volume and Divergence Analysis:
- Volume divergence can be a powerful tool to spot trend reversals or weakening momentum.
- For example, if the price of a security is making higher highs but volume is declining, this divergence could indicate an imminent reversal.
- Volume-Based Stop Losses and Profit-Taking:
- Traders can also use volume as a signal to exit trades. High volume near a known resistance level, for example, can serve as an indicator to take profits.
- When volume declines in an ongoing trend, traders might tighten their stop losses as a precaution against potential reversals.
Examples
Example 1: On-Balance Volume (OBV)
The On-Balance Volume indicator is a cumulative measure that adds volume on days when the closing price is higher than the previous close and subtracts volume when it’s lower. This indicator is used to assess the direction of volume flow and can confirm trends when price and OBV move in tandem. For instance, if a stock price is rising along with OBV, it suggests that buying volume supports the price increase, which reinforces the bullish trend. If OBV diverges from the price trend (e.g., the price rises but OBV falls), it may signal weakening momentum and a potential reversal.
Example 2: Accumulation/Distribution (A/D) Line
The A/D Line uses both price and volume to measure buying and selling pressure in a security. This indicator calculates a running total based on where the close lies within the day’s range and the volume for that day. If the closing price is nearer to the high, it suggests accumulation (buying), whereas a close near the low implies distribution (selling). For example, if the A/D Line rises even as prices fluctuate within a range, it may indicate that underlying buying pressure is building, potentially foreshadowing a breakout.
Example 3: Volume-Price Trend (VPT)
Volume-Price Trend combines volume and percentage price change to illustrate the relationship between volume and price movements. The VPT increases when price and volume both move upward, supporting upward trends, and decreases when they move down, supporting downtrends. VPT is particularly useful for trend confirmation. For instance, in a rising market, a steady increase in VPT suggests strong buying momentum. If price rises but VPT fails to increase, it might indicate that the upward price movement lacks conviction, warning of a potential reversal.
Example 4: Chaikin Money Flow (CMF)
Chaikin Money Flow focuses on the relationship between volume, price, and a security’s price position within its daily range to gauge buying or selling pressure over a period, typically 20 to 21 days. A positive CMF value indicates that the asset is under buying pressure, while a negative CMF signals selling pressure. For example, if CMF is consistently positive as a stock price trends upward, it shows strong buyer interest. However, if CMF turns negative during an uptrend, it may suggest fading buying interest and could precede a trend reversal.
Example 5: Klinger Volume Oscillator (KVO)
The Klinger Volume Oscillator uses the volume’s long-term trends to assess accumulation and distribution. By calculating the difference between two EMAs of volume, it identifies shifts in money flow and potential reversals. For instance, a cross above the zero line or a signal line during a downtrend may signal the start of a bullish reversal, while a cross below during an uptrend may warn of selling pressure. KVO’s sensitivity to volume changes makes it valuable in spotting market turning points, helping traders to time entries and exits within existing trends effectively.
Practice Questions
Question 1
Which of the following volume indicators measures the cumulative total of buying and selling pressure based on the relationship of each closing price to the high-low range of the day?
A) On-Balance Volume (OBV)
B) Accumulation/Distribution (A/D) Line
C) Volume-Price Trend (VPT)
D) Chaikin Money Flow (CMF)
Answer: B) Accumulation/Distribution (A/D) Line
Explanation: The Accumulation/Distribution (A/D) Line is a volume indicator that reflects the balance between buying and selling pressure by calculating a cumulative volume total based on each period’s closing price relative to its high-low range. When the closing price is closer to the high of the range, the indicator suggests that accumulation (buying) is stronger, and volume is added. Conversely, when the closing price is closer to the low, the indicator points to distribution (selling), and volume is subtracted. This makes the A/D Line a useful tool for detecting divergence between volume and price, helping to anticipate trend reversals or continuations. Other options do not use this method; for example, OBV simply adds volume based on price movement direction, while CMF and VPT incorporate volume differently.
Question 2
Which volume indicator is most commonly used to identify potential reversals by highlighting the cumulative difference between buying and selling pressure through the use of moving averages of volume?
A) Klinger Volume Oscillator (KVO)
B) Volume-Price Trend (VPT)
C) On-Balance Volume (OBV)
D) Accumulation/Distribution (A/D) Line
Answer: A) Klinger Volume Oscillator (KVO)
Explanation: The Klinger Volume Oscillator (KVO) is designed to capture long-term trends in volume flow by calculating the cumulative difference between buying and selling pressure. It uses exponential moving averages, typically with periods of 34 and 55, to smooth out volume data, which helps to detect potential reversals. This indicator becomes particularly valuable when the oscillator crosses above or below a signal line, suggesting shifts in trend direction. The KVO’s unique use of volume moving averages distinguishes it from other indicators, such as OBV, which does not employ moving averages, and the A/D Line, which tracks accumulation versus distribution without smoothing.
Question 3
Which of the following statements is true regarding the interpretation of volume during price movements?
A) A decrease in volume as prices rise generally confirms the strength of an uptrend.
B) A volume spike with minimal price movement may signal a potential trend reversal.
C) An increase in volume during a price decline suggests a lack of seller conviction.
D) Volume divergence occurs when both price and volume increase simultaneously.
Answer: B) A volume spike with minimal price movement may signal a potential trend reversal.
Explanation: A volume spike with minimal price movement often indicates a potential trend reversal or a period of consolidation. When volume is high, but price does not move significantly, it suggests that buyers and sellers are actively trading at current levels, potentially exhausting the current trend and setting up for a reversal. This is sometimes referred to as a “volume climax.” Answer (A) is incorrect because decreasing volume during a price rise suggests that fewer traders are supporting the uptrend, potentially signaling weakness. Answer (C) is also incorrect, as an increase in volume during a decline often signals strong selling interest and conviction. Lastly, (D) is incorrect as volume divergence occurs when volume and price move in opposite directions (e.g., price increases but volume decreases).

