Preparing for the CMT exam requires a solid grasp of analyzing sentiment in derivatives markets, a vital aspect of market analysis. Understanding investor sentiment, open interest, volume trends, and derivatives pricing dynamics helps identify market psychology, risk sentiment shifts, and potential turning points, enhancing strategic decisions and achieving proficiency in market trend forecasting.
Learning Objective
In studying “Analyzing Sentiment in Derivatives Markets” for the CMT Level 2 exam, you should understand methods used to gauge market sentiment through derivatives data, such as options, futures, and volatility indexes. Evaluate how sentiment indicators like put/call ratios, volatility skews, and open interest reveal market psychology. Analyze investor behavior and sentiment extremes to anticipate potential market reversals and confirm trends. Explore behavioral finance concepts and their impact on price movements, using tools like implied volatility analysis and sentiment models. Apply this knowledge to interpret market sentiment shifts and inform trading strategies in practice questions and real-world applications.
Market Sentiment Indicators in Derivatives Markets
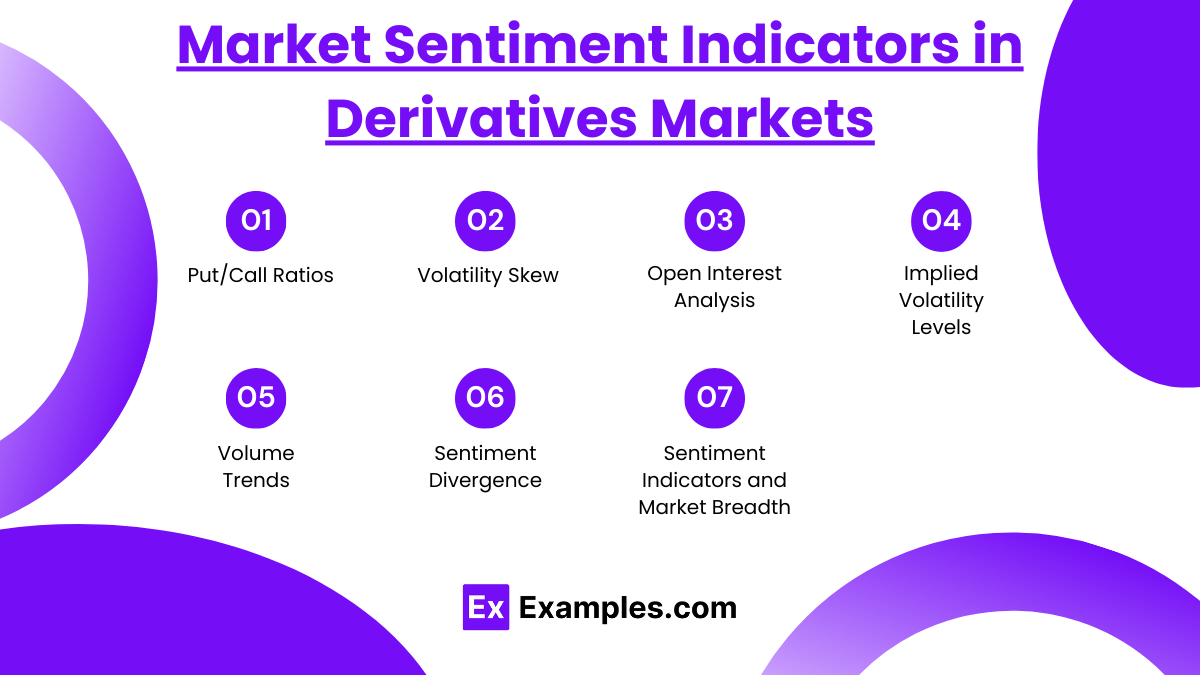
Delving into market sentiment indicators in derivatives markets provides a deeper understanding of how investor behavior shapes market dynamics. Here’s a detailed explanation of each key component:
1. Put/Call Ratios:
The put/call ratio measures the volume of put options traded relative to call options. When the ratio is high, it indicates a greater number of investors buying puts compared to calls, suggesting bearish sentiment and a higher level of market fear. Conversely, a low put/call ratio reflects bullish sentiment, as more investors are buying calls expecting prices to rise. Traders often use extreme levels in the ratio as a contrarian indicator, assuming that market sentiment at extremes may precede a reversal.
2. Volatility Skew:
Volatility skew represents the difference in implied volatility across various strike prices for options on the same underlying asset. A steep skew occurs when out-of-the-money puts trade with significantly higher implied volatility than calls, reflecting demand for downside protection and heightened risk aversion among investors. Analyzing volatility skew provides insight into the perceived risks of large market moves and potential sentiment shifts. Traders can use this to hedge their positions or anticipate potential corrections.
3. Open Interest Analysis:
Open interest tracks the total number of outstanding options or futures contracts that have not been settled. An increase in open interest indicates that new positions are being established, which can signify market confidence and strong momentum in a given direction. Conversely, a decline in open interest suggests profit-taking, position unwinding, or a lack of commitment. By examining open interest alongside price movements, traders can assess the strength of market trends and potential reversals.
4. Implied Volatility Levels:
Implied volatility (IV) reflects the market’s expectations of future price movements and is derived from option prices. High IV levels indicate heightened uncertainty and fear among investors, while low levels reflect stability and complacency. Implied volatility can be used to identify overbought or oversold conditions in the market, providing insights into possible market turnarounds or areas of high risk. The VIX, often referred to as the “fear index,” is a common measure of implied volatility for the broader market.
5. Volume Trends:
Analyzing the volume of trades in derivatives markets offers valuable information about the strength of market sentiment. Increased trading volume during price movements often signifies strong conviction, validating the direction of the trend. Conversely, weak volume during price moves may indicate a lack of consensus or a potential reversal. By studying volume trends alongside price action, traders can confirm the sustainability of market moves.
6. Sentiment Divergence:
Sentiment divergence occurs when market sentiment indicators, such as put/call ratios or implied volatility, diverge from the price trend of the underlying asset. For example, if the price of an asset is rising but sentiment indicators show increasing bearish sentiment, it could signal a weakening trend or an impending reversal. Divergence is a powerful tool for anticipating market turning points and identifying potential risks.
7. Sentiment Indicators and Market Breadth:
Combining sentiment indicators with market breadth measures, such as the number of advancing versus declining stocks, offers a comprehensive view of market health. Strong breadth with positive sentiment suggests broad market strength, while weak breadth alongside negative sentiment may indicate a fragile market susceptible to corrections. By synthesizing sentiment data with market breadth, traders can gain a holistic view of market conditions and align their strategies accordingly.
Behavioral Finance and Market Psychology in Derivatives Trading
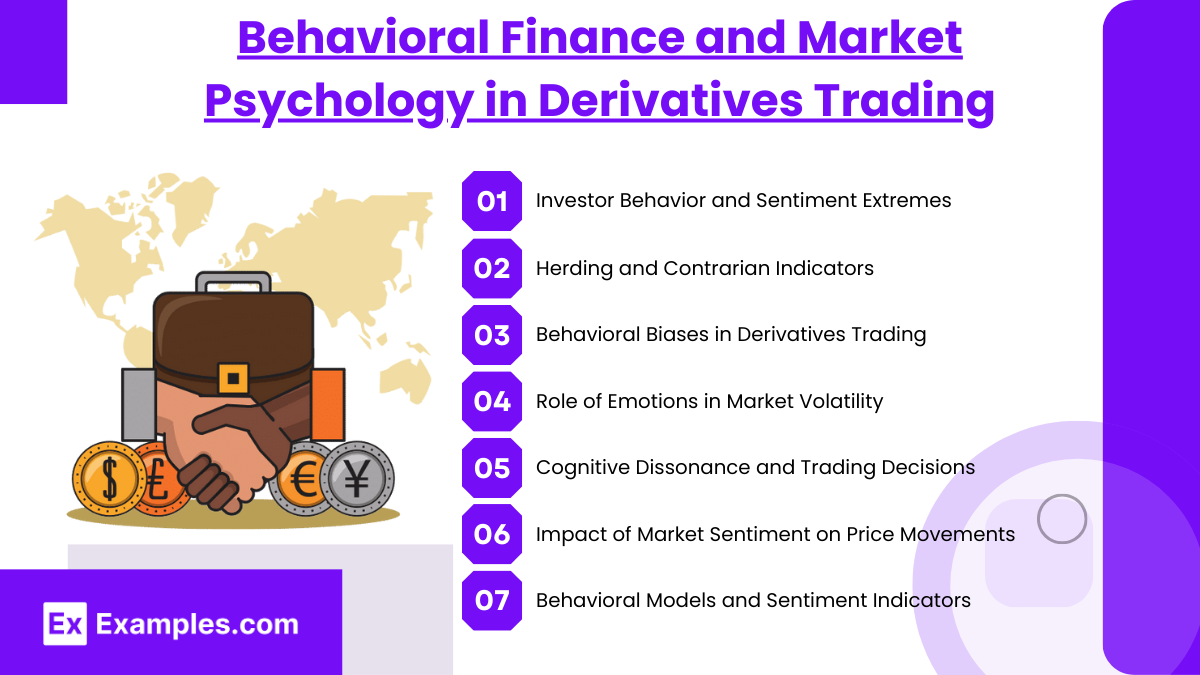
Behavioral finance explores how psychological biases and emotional factors influence investors’ decisions, often leading to market behaviors that defy traditional economic theories. In derivatives trading, understanding market psychology is crucial for interpreting and anticipating market movements driven by sentiment rather than purely rational analysis. Here’s a detailed explanation:
- Investor Behavior and Sentiment Extremes:
Investors’ behavior often shifts between optimism and pessimism, driven by emotions such as fear, greed, or euphoria. Sentiment extremes occur when most market participants exhibit a strong bias toward one direction, such as excessive optimism or deep pessimism. In derivatives trading, these extremes often precede market reversals, as the market becomes vulnerable to sudden shifts in sentiment. For example, when most traders hold bullish positions in call options, the market may be primed for a pullback due to overexposure. - Herding and Contrarian Indicators:
Herding behavior occurs when investors collectively follow the actions of others, often leading to bubbles or market crashes. In derivatives markets, herding can be observed when a large number of traders rush into similar positions, creating imbalances. Contrarian indicators, such as high levels of call or put buying, are used to identify potential turning points by assuming the crowd may be wrong at extremes. Recognizing herding behavior allows traders to adopt a contrarian approach, positioning themselves against the prevailing trend when appropriate. - Behavioral Biases in Derivatives Trading:
Common behavioral biases, such as overconfidence, loss aversion, and anchoring, play a significant role in derivatives trading. Overconfident traders may overestimate their predictive abilities and take excessive risks, while loss-averse traders may hold onto losing positions for too long, hoping for a reversal. Anchoring refers to the tendency to rely heavily on an initial piece of information, which can distort decision-making. Understanding and mitigating these biases helps traders make more rational and objective decisions. - Role of Emotions in Market Volatility:
Emotions such as fear and greed can lead to increased market volatility, particularly in derivatives markets where leverage amplifies risk. Sudden shifts in sentiment can trigger sharp price movements, as traders rush to exit or enter positions. For instance, a surge in fear may lead to increased demand for put options as traders seek protection, driving up implied volatility. By recognizing emotional drivers, traders can better anticipate market volatility and manage risk accordingly. - Cognitive Dissonance and Trading Decisions:
Cognitive dissonance occurs when traders hold conflicting beliefs or are faced with evidence contradicting their views, leading to discomfort. This psychological phenomenon often causes traders to ignore new information that challenges their existing positions, resulting in poor decision-making. In derivatives trading, overcoming cognitive dissonance is essential for adapting to changing market conditions and avoiding unnecessary losses. - Impact of Market Sentiment on Price Movements:
Market sentiment, as driven by psychological factors, can lead to price movements that deviate from fundamental values. Sentiment-driven trends in derivatives markets may be fueled by speculative activity, fear of missing out (FOMO), or panic selling. Recognizing sentiment’s influence allows traders to differentiate between genuine trend shifts and noise, adapting their strategies to changing market dynamics. - Behavioral Models and Sentiment Indicators:
Behavioral finance has led to the development of models and indicators that quantify market sentiment. Tools such as sentiment indexes, volatility measures, and derivatives-based sentiment indicators offer insights into the emotional state of the market. By integrating these models into their analysis, traders can better assess market psychology and identify opportunities or risks in derivatives trading.
Analytical Tools and Techniques for Sentiment Analysis
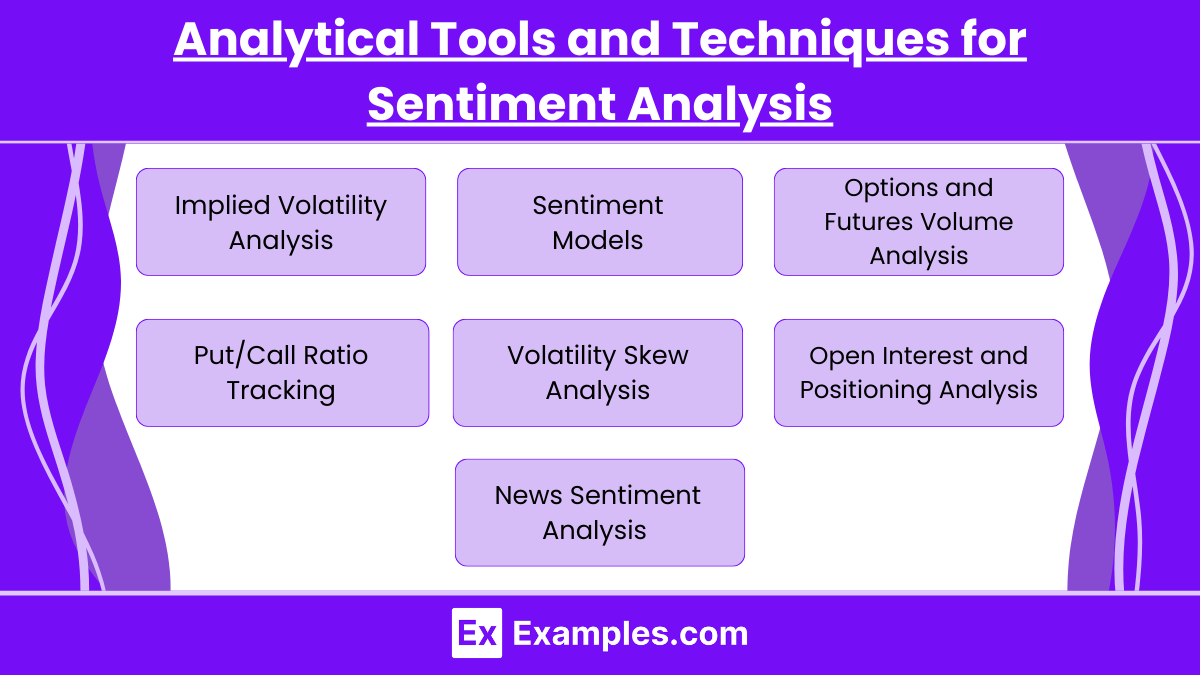
Sentiment analysis in derivatives markets involves using various tools and techniques to gauge market participants’ emotional and psychological states. This helps traders understand underlying market sentiment, anticipate potential price movements, and make informed trading decisions. Here’s an overview of key tools and techniques:
- Implied Volatility Analysis:
Implied volatility (IV) is derived from the price of options and reflects market expectations of future volatility. High implied volatility often indicates increased fear or uncertainty among market participants, while low IV suggests market complacency. Tools such as the VIX (Volatility Index), often referred to as the “fear gauge,” track market sentiment and provide insights into expected market volatility. Analyzing changes in implied volatility helps traders anticipate market reversals or periods of heightened risk. - Sentiment Models:
Sentiment models are designed to quantify and analyze market sentiment through a combination of data inputs, such as put/call ratios, open interest, volume trends, and other indicators. These models help traders identify sentiment extremes and potential turning points. For example, a sentiment model might flag overbought or oversold market conditions based on a combination of indicators, signaling potential market corrections or reversals. - Options and Futures Volume Analysis:
The analysis of options and futures trading volume provides insights into market activity and sentiment strength. An increase in volume during price movements indicates strong sentiment and conviction, while low volume may suggest lack of enthusiasm or potential market fatigue. Volume analysis, when combined with other sentiment indicators, helps confirm trends and assess market momentum. - Put/Call Ratio Tracking:
The put/call ratio measures the volume of put options relative to call options and serves as a contrarian sentiment indicator. A high put/call ratio often indicates bearish sentiment, while a low ratio suggests bullish sentiment. Tracking changes in the ratio can help identify sentiment extremes and potential reversals, making it a valuable tool for analyzing market psychology. - Volatility Skew Analysis:
Volatility skew measures the difference in implied volatility between different strike prices for options on the same underlying asset. Skew can reveal market sentiment regarding potential upward or downward movements. A steep skew often reflects demand for downside protection (puts), indicating increased caution or bearish sentiment. Traders use skew analysis to assess market sentiment and anticipate possible shifts. - Open Interest and Positioning Analysis:
Open interest refers to the total number of outstanding contracts in the derivatives market. Analyzing changes in open interest helps gauge market sentiment and commitment levels. For example, increasing open interest alongside rising prices suggests new buying interest and strong sentiment, while declining open interest may indicate profit-taking or a lack of conviction. - News Sentiment Analysis and Social Media Data:
In recent years, sentiment analysis has expanded to include news and social media data. Analyzing trends in market-related news articles, tweets, and other social media activity can provide real-time sentiment insights. Machine learning algorithms and natural language processing (NLP) techniques are often used to analyze large datasets and identify sentiment trends, offering a broader perspective on market sentiment.
Application of Sentiment Analysis in Trading Strategies
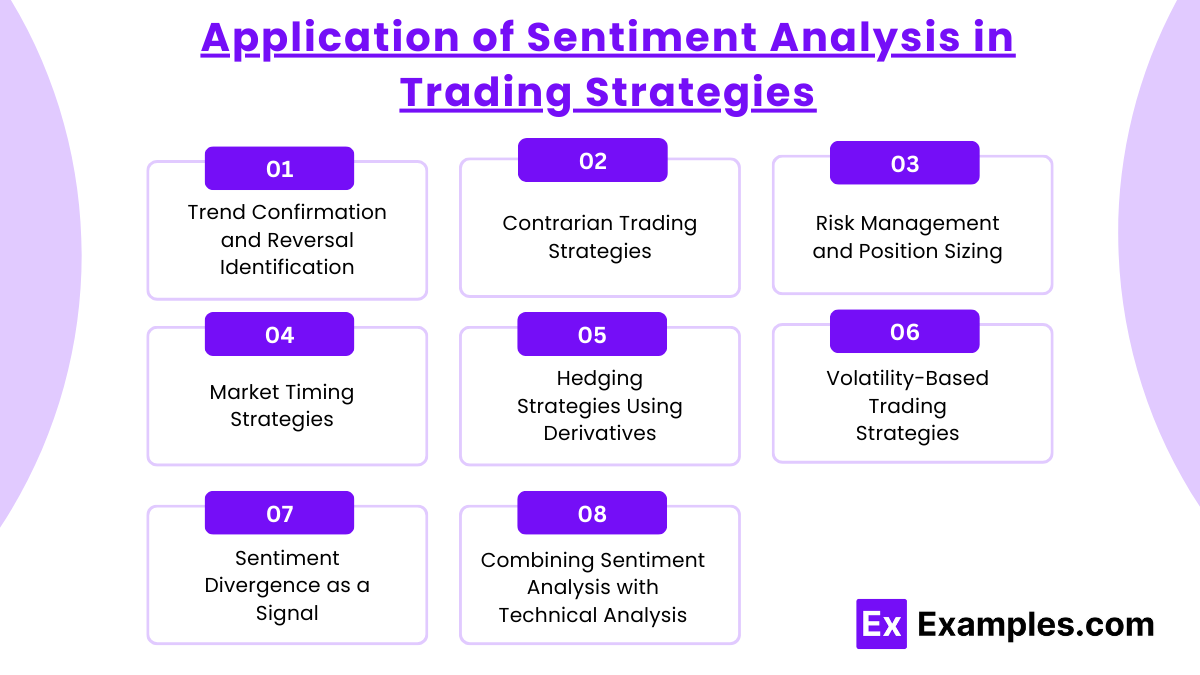
The application of sentiment analysis in trading strategies involves using insights from market sentiment indicators to enhance decision-making and improve trading outcomes. By understanding the emotional and psychological state of market participants, traders can better anticipate market movements, identify opportunities, and manage risks. Here’s how sentiment analysis is applied in trading strategies:
- Trend Confirmation and Reversal Identification:
Sentiment analysis helps confirm existing market trends or signal potential reversals. When sentiment indicators align with a strong trend (e.g., bullish sentiment during an uptrend), it reinforces the trend’s strength. Conversely, when sentiment diverges (e.g., bearish sentiment during rising prices), it may signal weakening momentum or a pending reversal. Traders use this information to validate their trading positions or prepare for trend changes. - Contrarian Trading Strategies:
Contrarian trading involves taking positions opposite to the prevailing market sentiment, assuming that extreme levels of optimism or pessimism often precede reversals. For example, when put/call ratios indicate excessive bearish sentiment, contrarians may see this as a buying opportunity, anticipating that the market may reverse upward. Contrarian strategies rely heavily on identifying sentiment extremes and using them to enter trades against the prevailing trend. - Risk Management and Position Sizing:
Sentiment analysis plays a crucial role in managing risk and determining appropriate position sizes. For instance, during periods of heightened market volatility or extreme sentiment (e.g., very high implied volatility), traders may reduce position sizes to manage risk. Conversely, low volatility and complacent sentiment may encourage larger positions due to reduced perceived risk. By aligning position sizes with market sentiment, traders can optimize their risk exposure. - Market Timing Strategies:
Sentiment indicators can aid in timing market entries and exits. For example, an increase in open interest alongside strong positive sentiment may suggest a continuation of an upward move, signaling a potential entry point. On the other hand, sharp spikes in implied volatility or bearish sentiment indicators may signal caution, suggesting it might be time to exit positions or hedge against downside risk. - Hedging Strategies Using Derivatives:
Sentiment analysis helps traders identify when to use derivatives for hedging purposes. During periods of extreme fear or uncertainty, demand for put options may rise, indicating heightened market risk. Traders can use this information to hedge their portfolios by purchasing protective puts or employing options strategies that mitigate downside exposure. Understanding sentiment-driven demand for options helps optimize hedging tactics. - Volatility-Based Trading Strategies:
Volatility is a key sentiment indicator in derivatives markets, and its fluctuations can be exploited for profit. For example, strategies like straddles or strangles are designed to capitalize on expected increases in volatility. Sentiment-driven spikes in implied volatility can offer profitable opportunities for such strategies, while periods of low volatility may favor selling options to capture premium income. - Sentiment Divergence as a Signal:
Divergence between market sentiment indicators and price movements can act as a powerful signal for traders. For instance, if prices are rising but sentiment indicators (like put/call ratios or open interest) show increasing bearish sentiment, it may suggest that the rally lacks strong conviction and could reverse. Traders can use such divergence signals to adjust their positions or take advantage of potential market inflection points. - Combining Sentiment Analysis with Technical Analysis:
Integrating sentiment analysis with traditional technical analysis tools, such as trendlines, moving averages, and support/resistance levels, provides a comprehensive approach to market analysis. For example, sentiment data can help confirm the validity of a breakout or identify potential false breakouts when sentiment indicators suggest otherwise. This combination enhances decision-making by providing a broader perspective on market conditions.
Examples
Example 1: High Put/Call Ratio Signaling Bearish Sentiment
In the derivatives market, a high put/call ratio, indicating a larger volume of put options relative to call options, often reflects bearish sentiment among traders. This suggests that investors are hedging against potential declines or speculating on downward price movements, providing insights into market pessimism and potential trend reversals.
Example 2: VIX Futures to Gauge Market Volatility
The VIX futures market, which allows traders to speculate on future volatility levels, offers insights into market sentiment. Rising VIX futures prices indicate increased expectations of volatility and fear among market participants. This sentiment can guide trading strategies in options and futures markets, highlighting periods of risk or caution.
Example 3: Skew Index as a Measure of Tail Risk
The Skew Index measures the relative cost of out-of-the-money put options compared to calls, reflecting the market’s perception of extreme downside risk. A high Skew Index suggests traders are willing to pay more for protection against sharp declines, signaling heightened bearish sentiment or tail risk concerns.
Example 4: Sentiment Shifts Through Implied Volatility Changes
Monitoring changes in implied volatility of options provides insights into shifts in market sentiment. Sudden spikes in implied volatility indicate increased demand for options, reflecting rising uncertainty, fear, or anticipation of significant market moves. This helps traders assess sentiment-driven changes in derivatives markets.
Example 5: Open Interest Analysis in Futures Contracts
Changes in open interest in futures contracts reveal shifts in trader sentiment. Increasing open interest during a price rally indicates new money flowing in, signaling confidence in the trend’s continuation. Conversely, declining open interest during a rally suggests waning sentiment and potential exhaustion of the trend.
Practice Questions
Question 1:
What does a high put/call ratio typically indicate in the derivatives market?
A. Bullish sentiment, with more call options being purchased
B. Market neutrality, with balanced put and call trading
C. Bearish sentiment, with more put options being purchased
D. Increased volatility with no directional bias
Answer: C) Bearish sentiment, with more put options being purchased
Explanation:
A high put/call ratio indicates a greater volume of put options (used to hedge or bet on declines) relative to call options, suggesting bearish sentiment among traders. It reflects increased concern or caution about potential price declines in the market.
Question 2:
How does the Skew Index reflect market sentiment in derivatives markets?
A. It measures the ratio of futures contracts traded
B. It indicates the cost difference between at-the-money and deep in-the-money options
C. It reflects the market’s perception of extreme downside risk
D. It measures the expected volatility of large-cap stocks
Answer: C) It reflects the market’s perception of extreme downside risk
Explanation:
The Skew Index measures the relative cost of out-of-the-money puts versus calls, indicating how much traders are willing to pay for downside protection. A high Skew Index signals heightened concern about potential extreme downside risk, showing bearish sentiment in the derivatives market.
Question 3:
What does rising open interest in futures contracts during a price rally typically signify?
A. Weak sentiment and potential market reversal
B. Increased market confidence and strong sentiment
C. Declining sentiment and fading momentum
D. Neutral market activity with no impact
Answer: B) Increased market confidence and strong sentiment
Explanation:
Rising open interest during a price rally suggests that new money is entering the market, indicating increased confidence in the trend’s continuation. It reflects strong market sentiment, as more participants are willing to commit resources to maintain or enhance the rally.

